Cisco MDS 9000 Family Fabric Manager Quick Configuration Guide
Fabric Manager Client

Table Of Contents

Fabric Manager Client

Launching Fabric Manager Client in Cisco SAN-OS Release 3.2(1) and Later

Fabric Manager Client Quick Tour

Multiple Fabrics in the Fabric Pane

Contents Panes

Fabric Pane

Main Menu

Toolbar

Information Pane

Logical Domains Pane

Physical Attributes Pane

Status Bar

Context Menus

Filtering

Detachable Tables

Fabric Manager Wizards


Fabric Manager Client


The Cisco Fabric Manager Client is a Java-based GUI application that provides easy access to Fabric Manager applications from a remote workstation.

This appendix contains the following sections:

Launching Fabric Manager Client in Cisco SAN-OS Release 3.2(1) and Later

Fabric Manager Client Quick Tour

Fabric Manager Wizards

In addition to complete configuration and status monitoring capabilities for Cisco MDS 9000 switches, Fabric Manager Client provides powerful Fibre Channel troubleshooting tools. These in-depth health and configuration analysis tools leverage unique MDS 9000 switch capabilities including Fibre Channel ping and traceroute.


Note You must have the same release of Fabric Manager Client and Fabric Manager Server.


Launching Fabric Manager Client in Cisco SAN-OS Release 3.2(1) and Later


Note As of Cisco SAN-OS Release 3.2(1), the Fabric Manager Client login procedure has changed. If you are running a version of Cisco SAN-OS that is earlier than Cisco SAN-OS 3.2(1), follow the login instructions in the "Setting the Seed Switch in Cisco SAN-OS Releases 3.1(1) to 3.2(1)" section on page A-1 or the "Setting the Seed Switch in Releases Prior to Cisco SAN-OS Release 3.1(1)" section on page A-3.


Note Network administrators must initially launch Fabric Manager Client using Fabric Manager Web Server, as described below. Once an administrator has installed the Fabric Manager Client icon on your desktop, you can double click on the icon to launch the Fabric Manager Client.


To launch Fabric Manager Client, follow these steps:


Step 1 Open your browser and enter the IP address where you installed Fabric Manager Server, or enter localhost if you installed Fabric Manager Server on your local workstation.

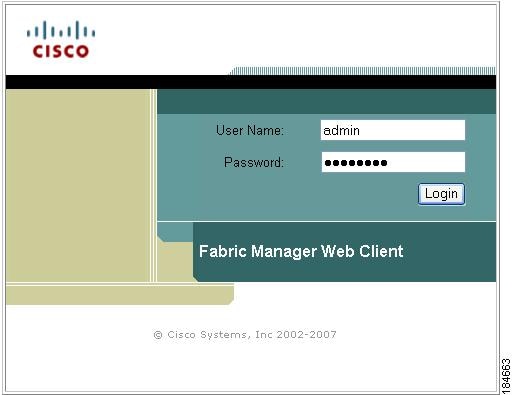
You see the Fabric Manager Web Server Login dialog box shown in Figure 4-1.

Figure 4-1 Fabric Manager Web Server Login Dialog Box

Step 2 Enter your user name and password and click Login.

You see the Fabric Manager Web Server Summary page.

Step 3 Click the Download link in the upper right corner of the page.

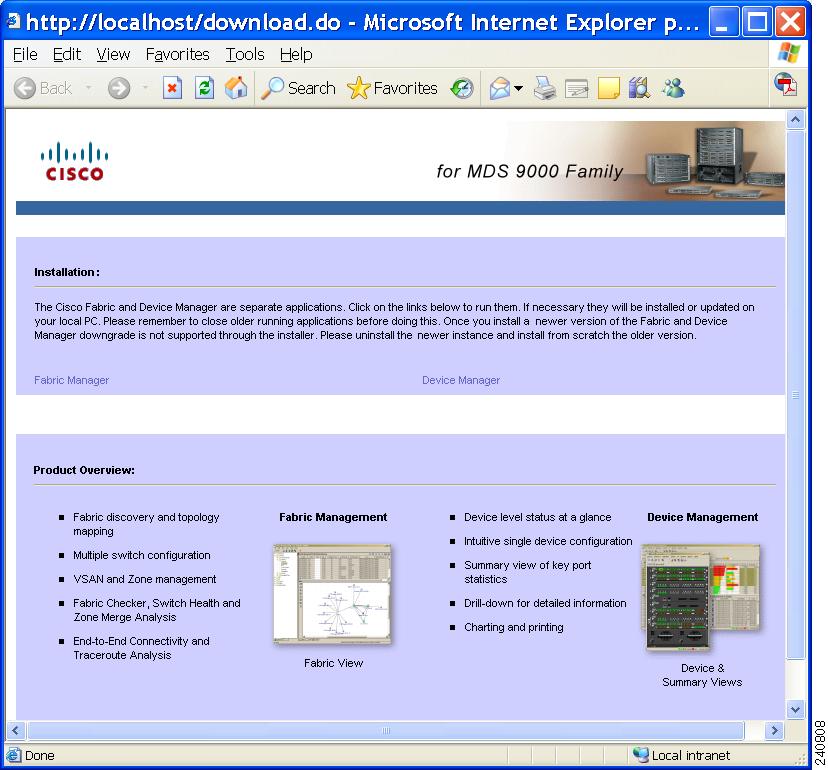
You see the Download page for Fabric Manager and Device Manager (see Figure 4-2).

Figure 4-2 Fabric Manager and Device Manager Download Page

Step 4 Click the link for either Fabric Manager or Device Manager.

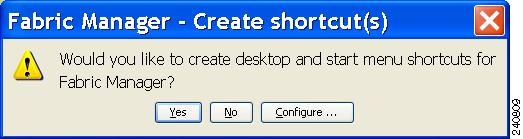
If you are launching Fabric Manager Client for the first time, you see a message asking whether you want to create shortcuts for Fabric Manager (see Figure 4-3).

Figure 4-3 Fabric Manager Create Shortcut(s) Message

Step 5 Click Yes to create shortcuts for Fabric Manager.


Note This message only appears the first time you launch Fabric Manager Client.


Step 6 When the software is installed and icons are created on your desktop, double-click the Fabric Manager icon to launch Fabric Manager.

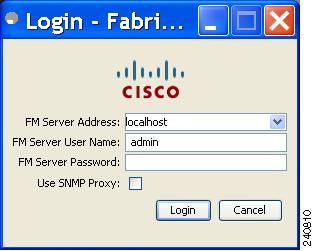
You see the Fabric Manager Login dialog box shown in Figure 4-4.

Figure 4-4 Fabric Manager Login Dialog Box

Step 7 Enter the Fabric Manager Server user name and password.

Step 8 Check the Use SNMP Proxy check box if you want Fabric Manager Client to communicate with Fabric Manager Server through a TCP-based proxy server.

Step 9 Click Login. Once you successfully log in to Fabric Manager Server, you can set the seed switch and open the fabrics that you are entitled to access.


Note When you launch Fabric Manager Client for the first time or when there are no available fabrics, you see the Discover New Fabric dialog box.


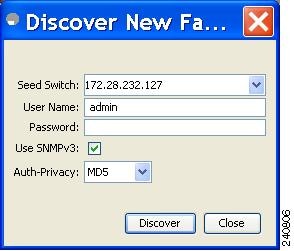
See the Discover New Fabric dialog box in Figure 4-5.

Figure 4-5 Discover New Fabric Dialog Box


Note Only network administrators can discover new fabrics.


Step 10 Set the fabric seed switch to the Cisco MDS 9000 Family switch that you want Fabric Manager to use.

Step 11 Enter the user name and password for the switch.

Step 12 Choose the Auth-Privacy option according to the privacy protocol that you configured on your switch:

a. If you have not configured the switch with a privacy protocol, then choose Auth-Privacy option MD5 (no privacy).

b. If you have configured the switch with your privacy protocol, please choose your Auth-Privacy choice.


Note If you want a clean discovery, remove the fabric and rediscover it.


Step 13 Click Discover.

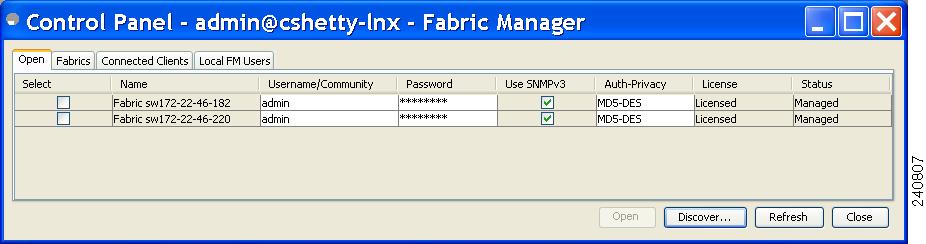
You see the Control Panel dialog box shown in Figure 4-6.

Figure 4-6 Control Panel Dialog Box


Note You see a message in the dialog box when the server and client are running on the same workstation and there are unlicensed fabrics in the database. You also see a message when there are unmanaged fabrics (the state of the licenses is unknown).


Step 14 Check the check box(es) next to the fabric(s) you want to open in the Select column, or click Discover to add a new fabric.


Note Only network administrators can continuously manage or unmanage fabrics.


Step 15 Click Open to open the selected fabric(s).


Note If you have an incomplete view of your fabric, rediscover the fabric with a user that has no VSAN restriction.


To launch Fabric Manager Client from within a running instance of Fabric Manager, follow these steps:


Step 1 Choose File > Open Fabric or click the Open Switch Fabric icon on the Fabric Manager toolbar.

You see the Control Panel dialog box (see Figure 4-6).

Step 2 Check the check box(es) next to the fabric(s) you want to open in the Select column and click Open.


Note Changes made using Fabric Manager are applied to the running configuration of the switches that you are managing. If you have made changes to the configuration or performed an operation (such as activating zones), Fabric Manager prompts you to save your changes before you exit.


Fabric Manager Client Quick Tour

This section helps you get familiar with the various icons and sections that enable navigation in the Fabric Manager Client interface, as shown in Figure 4-7.

Figure 4-7 Fabric Manager Main Window

1

Menu bar—Provides access to options that are organized by menus.

2

Toolbar—Provides icons to access the most commonly used options on the File, Tools, and Help menus.

3

Information pane—Displays information about whatever option is selected in the menu tree.

4

Status bar (right side)—Shows the last entry displayed by the discovery process, and the possible error message.

5

Fabric pane—Displays a map of the network fabric, including switches, hosts, and storage. It also provides tabs for displaying log and event data.

6

Logical domains—Displays a tree of configured SANs, fabrics, VSANs, and zones.

7

Physical attributes—Displays a tree of available configuration tasks depending on the SAN, fabric, VSAN, or zone selected above. Lists the switches and end devices in the logical selection.

8

Status Bar (left side)—Shows short-term transient messages, such as the number of rows displayed in a table.


Note As of Cisco MDS SAN-OS Release 2.1(1a), advanced mode is enabled by default and provides the full suite of Fabric Manager features, including security, IVR, iSCSI, and FICON. Uncheck the Advanced check box in the upper right corner of Fabric Manager Client to simplify the user interface. In this mode, you can access the basic MDS 9000 features like VSANs, zones, and interfaces.


Multiple Fabrics in the Fabric Pane

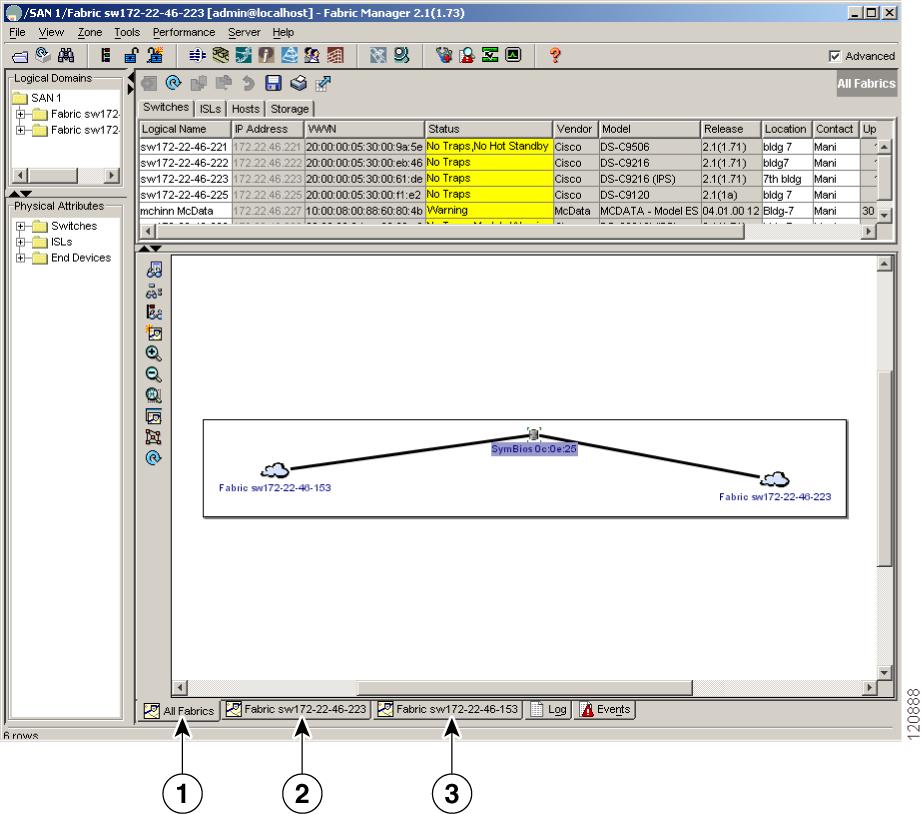
You can display multiple fabrics in the same fabric pane (see Figure 4-8). The tabs displayed at the bottom of the screen represent the various fabrics in your setup. You can access the fabrics by clicking the cloud icon.

Figure 4-8 Displaying Multiple Fabrics

1

All Fabrics tab (selected), showing two fabrics.

2

The Fabric view tab for fabric sw172-22-46-223.

3

The Fabric view tab for fabric sw172-22-46-153.


Note The same username and password must be used to log into multiple fabrics.


The information for both fabrics is displayed, with no need to select a seed switch. To see details of a fabric, select the tab for that fabric at the bottom of the Fabric pane, or double-click the cloud icon for the fabric in the All Fabrics tab.

Contents Panes

The following sections describe the panes in the Fabric Manager view. You can resize each pane by dragging the boundaries between each region or by clicking the Minimize or Maximize controls.

Fabric Pane

The Fabric pane shows the graphical representation of your fabric. Table 4-1 explains the graphics you may see displayed, depending on which devices you have in your fabric.

Table 4-1 Fabric Manager Graphics 

Icon or Graphic
Description

Director class MDS 9000 switch.

Non-director class MDS 9000 switch.

Generic Fibre Channel switch.

Cisco SN5428.

An orange X through a device or link indicates that the device or ISL is not working properly.

A red line through a device indicates that the device is not manageable.

A red X through a device or link indicates that the device is down or that the ISL is down.

Fibre Channel HBA (or enclosure).

Fibre Channel target (or enclosure).

iSCSI host.

Fibre Channel ISL and edge connection.

Fibre Channel PortChannel.

IP ISL and edge connection.

IP PortChannel.

Fibre Channel loop (storage).

IP cloud (iSCSI hosts). This icon is also used to represent a fabric when viewing a SAN (multiple fabrics) in the Fabric pane.

Any device, cloud, or loop with a box around it means that there are hidden links attached.


If a switch or director is dimmed, Fabric Manager can no longer communicate with it.

There are multiple tabs on the bottom of the Fabric pane:

Fabric—Displays multiple fabrics; each fabric has its own tab. You can switch between fabrics by clicking on their respective tabs.

Log—Displays messages that describe Fabric Manager operations, such as fabric discovery.

Events—Displays information about the SNMP traps received by the management station, including combination events as detected by discovery and important traps such as license, SNMP, and FICON.

When viewing large fabrics in the Fabric pane, it is helpful to:

Turn off end device labels.

Collapse loops.

Collapse expanded multiple links (collapsed multiple links are shown as very thick single lines).

Dim or hide portions of your fabric by VSAN.


Note When a VSAN, zone, or zone member is selected in the VSAN tree, the map highlighting changes to identify the selected objects. To remove this highlighting, click Clear Highlight on the Fabric pane toolbar or choose Clear Highlight from the pop-up menu.


Main Menu

The menu bar at the top of the Fabric Manager Client main window provides options for managing and troubleshooting the current fabric and for controlling the display of information on the Fabric pane. The menu bar provides the following menus:

File—Opens a new fabric, rediscovers the current fabric, locates switches, sets preferences, prints the map, and clears (right-click on log) or exports the Fabric pane log.

View—Changes the appearance of the map (these options are duplicated on the Fabric pane toolbar).

Zone—Manages zones, zone sets, and inter-VSAN routing (IVR).

Tools—Verifies and troubleshoots connectivity and configuration.

Performance—Runs and configures Performance Manager and Cisco Traffic Analyzer and generates reports.

Server—Runs administrative tasks on clients and fabrics. Provides Fabric Manager Server management and a purge command. Lists the switches that are being managed.

Help—Displays online help topics for specific dialog boxes in the Information pane.

Toolbar

The Fabric Manager Client main toolbar provides buttons for accessing the most commonly used menu bar options as shown in Table 4-2.

Table 4-2 Fabric Manager Client Main Toolbar 

Icon
Description

Opens switch fabric.

Rediscovers current fabric.

Finds in the map.

Creates VSAN.

Launches DPVM wizard.

Edits full zone database.

Launches IVR zone wizard.

Launches PortChannel wizard.

Launches FCIP wizard.

Launches iSCSI wizard.

Launches QoS wizard.

Configures users and roles.

Launches IP-ACL wizard.

Launches License Install wizard.

Launches Software Install wizard.

Performs switch health analysis.

Performs fabric configuration analysis.

Performs end-to-end connectivity analysis.

Monitor ISL performance.

Show online help.


Information Pane

The Information pane displays tables of information associated with the option selected from the menu tree in the Logical Domains or Physical Attributes panes. The Information pane toolbar provides buttons for performing one or more of the operations shown in Table 4-3.

Table 4-3 Information Pane Toolbar 

Icon
Description

Apply Changes

Applies configuration changes.

Refresh Values

Refreshes table values.

Create Row

Opens the appropriate dialog box to create a row in the table.

Delete Row

Deletes the currently highlighted rows from the table.

Copy/Ctrl+C

Copies data from one row to another.

Paste/Ctrl +V

Pastes the data from one row to another.

Undo Changes/Ctrl-Z

Undoes the most recent change.

Export

Exports and saves information to a file.

Print Table

Prints the contents of the Information pane.

Detach Table

Displays a non-editable copy of the table in the Information pane in its own window, which you can move around the screen.


Note After making changes, you must save the configuration or the changes are lost when the device is restarted.


Note The buttons that appear on the toolbar vary according to the option that you select. They are activated or deactivated (dimmed) according to the field or other object that you select in the Information pane.


Logical Domains Pane

Use the Logical Domains pane to manage attributes for SANs, fabrics, VSANs, and zones.

To manage these things, right-click one of the folders in the tree and click a menu item from the pop-up menu. You see the appropriate configuration dialog box.

The default name for the fabric is the name, IP address, or WWN for the principal switch in VSAN 1. If VSAN 1 is segmented, the default name is chosen from a principal switch with the smallest WWN. In order, you might see the following fabric names:

Fabric <sysname>

Fabric <ipAddress>

Fabric <sWWN>

Physical Attributes Pane

Use the Physical Attributes pane to display a tree of the options available for managing the switches in the currently discovered SAN, fabric, VSAN, or zone.

To select an option, click a folder to display the options available and then click the option. You see the table with information for the selected option in the Information pane. The Physical Attributes pane provides the following main folders:

Switches—View and configure hardware, system, licensing, and configuration files.

Interfaces—View and configure FC Physical, FC Logical, Ethernet, SVC, and PortChannel interfaces.

FC Services—View and configure Fibre Channel network configurations.

IP—View and configure IP storage and IP services.

Events—View and configure events, alarms, thresholds, notifications, and informs.

Security—View and configure MDS management and FC-SP security.

ISLs—View and configure Inter-Switch Links.

End Devices—View and configure end devices.

Status Bar

The status bar at the bottom of the Fabric Manager window shows the last entry displayed by the discovery process, and the possible error message on the right side. The status bar displays a message stating that something has changed in the fabric and a new discovery is needed. The status bar shows both short-term, transient messages (such as the number of rows displayed in the table) and long-term discovery issues.

Context Menus

When you right-click an icon in the Fabric pane, you see a pop-up menu with options that vary depending on the type of icon selected. The various options available for different objects include the following:

Open an instance of Device Manager for the selected switch.

Open a CLI session for the selected switch.

Copy the display name of the selected object.

Execute a ping or traceroute command for the device.

Show or hide end devices.

View attributes.

Quiesce and disable members for PortChannels.

Set the trunking mode for an ISL.

Create or add to a PortChannel for selected ISLs.

The Fabric pane has its own toolbar with options for saving, printing, and changing the appearance of the map. When you right-click on the map, a pop-up menu appears that provides options (duplicated on the toolbar) for changing the appearance of the map.


Note You can launch web-based or non-web-based applications from the Fabric pane. Assign an IP address to the storage port or enclosure, and then right-click to bring up the pop-up menu, and select Device Manager.


Filtering

Fabric Manager has a built-in filtering mechanism that displays only the data that you are interested in. To filter, first select the SAN, fabric, and VSAN from the Logical Domains pane to narrow the scope of what is displayed in the Fabric pane. Any information that does not belong to the selected items is dimmed. Also, any information that does not belong to the selected items is not displayed in the tables in the Information pane.

To further narrow the scope, select attributes from the Physical Attributes pane. The Fabric Manager tables, display, and filter criteria change accordingly.

Detachable Tables

As of Cisco MDS SAN-OS Release 2.0(2b), Fabric Manager Client has detachable tables. You can detach tables and move them to different areas on your desktop so that you can compare similar tables from different VSANs, or you can keep informational tables open from one view while you examine a different area in Fabric Manager. To detach tables, click the Detach Table icon in the Information pane in Fabric Manager.

Fabric Manager Wizards

Fabric Manager Client provides a series of wizards to facilitate common configuration tasks. These wizards are as follows:

VSAN—Creates VSANs on multiple switches in the fabric and sets VSAN attributes including interop mode, load balancing, and FICON.

Zone Edit Tool—Creates zone sets, zones, and aliases. Adds members to zone and edits the zone database.

IVR Zone—Creates IVR zone sets, zones, and aliases. Enables IVR NAT and auto-topology. Adds members to IVR zones and edits the IVR zone database.

PortChannel—Creates PortChannels from selected ISLs either manually or automatically. Sets PortChannel attributes such as channel ID and trunking mode.

FCIP —Creates FCIP links between Gigabit Ethernet ports. Enables Fibre Channel Write Acceleration and IP compression

DPVM—Establishes dynamic port VSAN membership, enables autolearning, and activates the DPVM database.

iSCSI—Zones iSCSI initiators and adds VSAN to the target allowed VSAN list.

QoS—Sets QoS attributes for zones in the selected VSAN.

IP ACL—Creates ordered IP access control lists and distributes to selected switches in the fabric.

License Install—Facilitates download and installation of licenses in selected switches in the fabric.

Software Install—Verifies image compatibility and installs software images on selected switches in the fabric.