SD-WAN Secure Direct Cloud Deployment Guide
Available Languages
Bias-Free Language
The documentation set for this product strives to use bias-free language. For the purposes of this documentation set, bias-free is defined as language that does not imply discrimination based on age, disability, gender, racial identity, ethnic identity, sexual orientation, socioeconomic status, and intersectionality. Exceptions may be present in the documentation due to language that is hardcoded in the user interfaces of the product software, language used based on RFP documentation, or language that is used by a referenced third-party product. Learn more about how Cisco is using Inclusive Language.
- US/Canada 800-553-2447
- Worldwide Support Phone Numbers
- All Tools
 Feedback
 Feedback
Contents
This document provides the design and deployment of the Cisco SD-WAN security policy specific to secure Direct Cloud Access (DCA) within remote sites running IOS-XE SD-WAN WAN Edge platforms. The security features leveraged within this guide include Enterprise Firewall with Application Awareness, Intrusion Prevention System (IPS), Advanced Malware Protection (AMP) and DNS/Web-layer Security with Umbrella Integration.
The guide explains at length the platforms deployed, highlights the best practices and assists with the successful configuration and deployment of security features. However, the document is not meant to exhaustively cover all options.
This document assumes that the controllers are already deployed and integrated into vManage NMS, the WAN Edge devices are deployed and the SD-WAN overlay network is successfully established. Refer to the Cisco SD-WAN Design Guide for background information and the Cisco SDWAN Deployment Guide for information on deploying device templates to establish a Cisco SD-WAN overlay network. For the design and deployment of local Internet exit on remote site WAN Edge devices refer Cisco SD-WAN Direct Internet Access Design and Deployment Guide. For details regarding the required licenses to deploy the Cisco SD-WAN security feature set, refer to Cisco DNA Software for SD-WAN and Routing.
This document contains four major sections:
● The Define section defines the shortcomings of a secure traditional WAN architecture, and then explains the benefits of deploying SD-WAN security policy on remote sites.
● The Design section includes the use case covered in the guide, along with the design components and considerations for the security features associated with the use case.
● The Deploy section discusses the automated deployment of the Cisco SD-WAN security features specific to the secure Direct Cloud Access (DIA) use case using the vManage security policy dashboard. The section also includes the prerequisites to deploy this security solution.
● The Operate section explains some of the monitoring and troubleshooting methods used when Cisco SD-WAN security features, Enterprise Firewall with Application Awareness, Intrusion Prevention System (IPS), Advanced Malware Protection (AMP) and DNS/Web-layer Security with Umbrella Integration, is configured.
Refer to Appendix B for the hardware models and software versions used in this deployment guide, Appendix C for the feature and device templates, along with the CLI-equivalent configuration for one of the WAN Edge devices configured.
The audience for this document includes network design engineers, network operations personnel, and security operations personnel who wish to implement the Cisco SD-WAN security infrastructure to establish secure Direct Cloud Access (DCA) within SD-WAN enabled remote sites.
In traditional wide-area networking, Internet traffic from a branch or remote site is sent to a central location such as a data center or regional hub site. This allows for the traffic returning from the Internet to be scrubbed by a data center security stack before being sent back to the branch. This is traditionally done due to the prohibitive cost of deploying a security stack in every branch or remote site location.
However, as the demand for Internet traffic increases, more companies are utilizing cloud services such as SaaS (e.g. Office 365, Box) and IaaS. In addition, more applications are Internet-based, more business employees are teleworking, and Internet of Things (IoT) devices are demanding bandwidth as well. Backhauling traffic to a central site across the transport tunnels for Internet access causes increased bandwidth utilization from branch to the central site, along with increased latency, resulting in a degradation of overall application performance.
The solution is to enable local internet exit for guest and employee traffic at the remote site by deploying and maintaining Cisco SD-WAN within your WAN infrastructure. This allows you to manage your Cisco SD-WAN WAN network centrally via Cisco vManage GUI and leverage the security capabilities embedded natively in the Cisco SD-WAN single-pane of management.
Benefits of Enabling Local Internet Exit within the Remote Site
Some of the benefits of enabling local Internet breakout within the remote-site include,
● Improved Internet experience by eliminating latency in backhauling traffic to a central site.
● Enhanced crypto throughput and better application performance for corporate applications due to reduced load on IPsec encrypted WAN links.
● Reduced bandwidth consumption at the central site, which thereby also reduces WAN costs.
● Simplified Cisco SD-WAN template and policy configuration at the remote site to enable local Internet exit of specific application traffic, keeping business-critical applications on premium WAN links.
● Controlled access to the Internet per VPN basis, by leveraging segmentation to allow for separation of employee and guest traffic.
Within an Internet exit enabled branch or remote site, users and branch network can be secured by implementing Cisco SD-WAN security features within the remote site devices via the vManage GUI. The security capabilities available within the security policy dashboard on vManage include Enterprise Firewall with Application Awareness (Application Firewall), Intrusion Prevention System (IPS), URL Filtering (URLF), Advanced Malware Protection (AMP), and DNS/Web-layer Security.
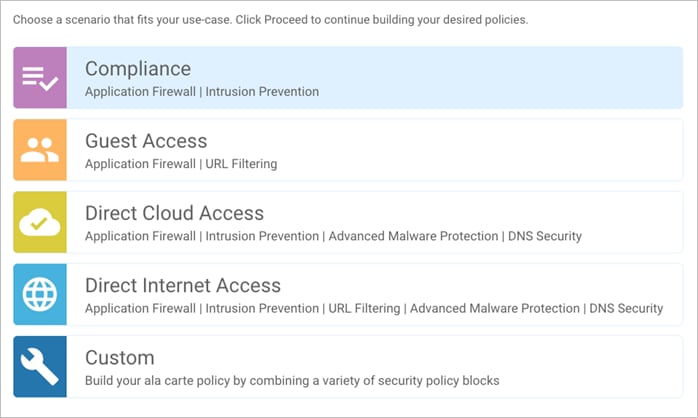
Based on common customer deployment scenarios, predefined workflows are added into vManage to facilitate ease of deployment for the following use cases, such as:
● Compliance Use Case: This use case caters to any organization that services customers, accepts credit card payment to be PCI compliant. In addition to the data being encrypted and sent over an IPsec tunnel, all packets are subjected to a stateful firewall and an IPS solution.
Security features leveraged in this use case include Enterprise Firewall with Application Awareness and Intrusion Prevention System (IPS).
● Guest Access Use Case: This use case caters to companies wherein guests bring in BYOD devices and connect to an open or password protected Internet connection. To avoid any litigation, companies are liable to inspect and provide a good content filtering solution.
Security features leveraged in this use case include Enterprise Firewall with Application Awareness and URL Filtering (URLF).
● Direct Cloud Access (DCA): This use case caters to customers who need to route some SaaS application traffic for optimal performance via local Internet exit and the rest of the Internet traffic via the HQ. The cloud traffic is inspected for malware.
Security features leveraged in this use case include Enterprise Firewall with Application Awareness, Intrusion Prevention System (IPS), Advanced Malware Protection (AMP) and DNS/Web-layer Security.
● Direct Internet Access (DIA): This use case caters to organizations wherein all Internet traffic from a remote site exit via the local branch Internet exit and is inspected for malware, along with content filtering etc.
Security features leveraged in this use case include Enterprise Firewall with Application Awareness, Intrusion Prevention System (IPS), URL Filtering (URLF), Advanced Malware Protection (AMP) and DNS/Web-layer Security.
In addition, you can also build your own custom policy by combining a custom variety of security features.
Within this solution, the security features available within the Direct Cloud Access (DCA) use case is explained.
Benefits of Deploying SD-WAN Security
Some of the benefits of deploying Cisco SD-WAN security policy within the remote site include:
● Simple and automated security solution: The intent-based workflow is designed for ease of configuration and deployment of the SD-WAN security solution. The workflow allows you to fill out the template to include all of the security capabilities and deploy it to multiple WAN Edge devices at the same time.
● Cisco SD-WAN security solution eliminates the need to deploy any addition security appliance within your SD-WAN network, thereby, avoiding any additional costs or complications associated with designing, configuring and managing those appliances.
● Centralized management: Deploy, troubleshoot and monitor the SD-WAN overlay solution with security capabilities across the WAN Edge devices centrally via the Cisco vManage GUI.
● Comprehensive SD-WAN security: With security capabilities enabled on your WAN Edge device, you can secure the remote site with:
◦ Enterprise firewall with application awareness restricts access to certain Internet destinations based on IP address/ port/ application family and more for remote employees and guests, with improved application experience.
◦ Intrusion Prevention System (IPS) with deep-packet inspection mitigates network attacks by providing your network with the intelligence to accurately identify, classify, and stop or block malicious traffic in real time.
◦ Advanced Malware Protection (AMP) leverages global threat intelligence, advanced sandboxing and real-time malware blocking to prevent breaches by continuously analyzing the file activity across the extended network to quickly detect, contain, and remove malware.
◦ DNS/Web-layer Security with Umbrella Integration leverages cloud security platforms to improve security visibility, to detect compromised systems, and to protect users on and off the network by stopping threats over any port or protocol before they reach your network or endpoints.
Design: Cisco SD-WAN Secure Direct Cloud Access
Out of the four intent-based use cases available within the vManage security policy, the use case discussed in this guide is secure Direct Cloud Access (DCA).
Use Case - Secure Direct Cloud Access
Within the direct cloud access use case, the primary requirement is to allow users to route some or all of the critical or non-critical SaaS application traffic directly from the remote site WAN Edge router via the local Internet exit. This helps to offload some of the SaaS traffic from premium WAN connections and improve application experience.
The second requirement is to thwart any potential threats that could come from cloud hosted applications and its associated file download. In this use case, Enterprise firewall with Application Awareness is configured to inspect and limit access to cloud applications, Snort IPS/IDS to inspect & block known attack or malware signatures, Advanced Malware Protection (AMP) to prevent download of malicious content or file, and DNS/Web-layer security as an additional layer of protection at the DNS layer.
The Cisco SD-WAN features leveraged within this use case include,
● Secure Segmentation via VPN/Zone to segment user traffic into zones and VPN/VRF.
● Centralized data policy to redirect some or all of the segmented user cloud traffic via local Internet exit.
● (optional) Application Awareness Route (AAR) policy to track network and path characteristics of the data plane tunnels between the WAN Edge routers and use the collected information to compute optimal paths for cloud-based SaaS traffic.
● Enterprise Firewall with Application Awareness, Intrusion Prevention System (IPS), Advanced Malware Protection (AMP) and DNS/Web-layer Security to maintain a secure Direct Cloud Access (DCA)
| Technical tip |
| In this deployment guide, enterprise firewall policy with application awareness is leveraged for traffic allow/drop and it works similar to a localized security policy that defines the conditions that data traffic flow originating from the source zone must match to continue to the destination zone. Firewall policies can match IP prefixes, IP ports, protocols (TCP, UDP, ICMP), and application names or families. Matching flows for prefixes, ports, and protocols can be allowed, dropped, or inspected, and their packet headers can be logged. Non-matching flows are dropped by default. However, note that applications listed in the "application/application family list to drop" will be blocked regardless of the action associated with them. It is currently not possible to create a firewall rule to allow for flow of specific applications in the 16.12/19.2 release. |
Table 1. Cisco SD-WAN Features for Direct Cloud Access
| Security Pillar |
SD-WAN Security Feature |
| Segmentation |
VPN and Zone |
| Local SAAS exit |
Centralized Data Policy |
| Controlled Redirection |
Application Aware Routing (optional) |
| Perimeter Control |
Enterprise Firewall with Application Awareness |
| Attack Prevention |
Intrusion Prevention System |
| Malware Prevention |
Advanced Malware Protection |
| Liability Protection |
DNS/ Web-layer Security |
Direct Internet Access Design and Deployment: For the design considerations and configuration of segmentation (VPN), centralized data policy and NAT DIA route on remote-site WAN Edge devices refer to the Cisco SD-WAN: Enabling Direct Internet Access design and deployment guide.
Application Aware Routing Design and Deployment: For the steps to configure Application Awareness Routing (AAR), refer to the configuration guide - Configuring Application-Aware Routing.
Security Policy Design: For the design components, workings and considerations of Cisco SD-WAN Security features such as, Enterprise Firewall with Application Awareness (Application Firewall), Intrusion Prevention System (IPS), URL-Filtering, Advanced Malware Protection (AMP) and DNS/Web-layer Security, refer to the Security Policy Design Guide for Cisco IOS-XE SD-WAN Devices.
Prerequisites: Cisco SD-WAN Secure Direct Cloud Access
This section covers the prerequisites specific to secure Direct Cloud Access (DCA).
Process 1: Successful Deployment of Controllers and WAN Edge Devices
Step 1. Make sure the controllers and WAN Edge devices are successfully deployed and operational.
| Technical Tip |
| Make sure to choose platforms that support the SD-WAN security features running the minimum required IOS-XE SD-WAN code with supported memory. For details refer to the design guide – Security Policy for Cisco IOS-XE SD-WAN Devices. |
Process 2: Enable Local Internet Exit for User SAAS Traffic using Centralized Policy
Step 1. Make sure to enable the NAT feature on the Internet transport VPN 0 Interface. The NAT feature translates the user IP address to the Internet facing Interface’s IP address.
Step 2. Configure centralized data policy to redirect certain application (cloud) traffic to transport VPN 0 NAT Interface. Within the data policy, application traffic matching a list of applications (SAAS_Application) is leaked from service-side VPN 1 to a NAT enabled interface in transport VPN 0. The Default Action is set to Accept.
Note: In this example, NAT Fallback feature is not enabled.
| Technical Tip |
| NAT Fallback feature is not supported today on IOS-XE SD-WAN WAN Edge devices. Note, regardless of whether the feature is enabled or not, the saved policy will still contain the fallback tab. When the Fallback tab points to neither True/False, it means the tab is not enabled. When the feature is enabled, Fallback is set to True, as shown in the example figure below.
|
Based on your requirement, add in additional sequence rules within the traffic policy. In this policy, applications matched under SAAS_Application include Gmail, Office 365 and Facebook. Note, you can also enable local Internet breakout from the remote site by configuring a NAT DIA route to redirect traffic from service-side VPN to global, or NAT enabled transport VPN 0 Interface. For the step-by-step procedure to build NAT DIA route or centralized data policy, refer to Cisco SD-WAN: Enabling Direct Internet Access.
| Technical tip |
| Due to First Packet Match (FPM), some application traffic may not be routed by the NAT DIA data policy, as it requires a number of packets to go through, before an application is matched. |
In this guide, both the app-visibility and flow-visibility policy was enabled.
!
policy
app-visibility
flow-visibility
| Technical tip |
| If you are deploying centralized data policy to enable DIA within the remote-site and also plan to configure umbrella Integration via the DNS/Web-layer security policy with target VPN as a service-side VPN, then the DNS Server IP address on the host machine must point to one of the IP addresses on the Edge device belonging to an interface which is part of the same VRF that umbrella belongs to. For instance, if the Target VPN in DNS/Web-layer Security (Umbrella integration) is configured as VPN 1 and an Interface within VPN 1 is configured as 10.1.1.1, then the DNS Server IP address on the host machine must be configured as 10.1.1.1. To use your local DNS server on the host/ client machine and still enable DIA and Umbrella integration on the WAN Edge router, then enable IP NAT route on the WAN Edge device and skip configuring centralized data policy. For the step-by-step procedures to build the NAT DIA route or centralized data policy, refer to Cisco SD-WAN: Enabling Direct Internet Access.
Cause: Within the Data policy, nat-vpn0 action bypasses umbrella integration. The centralized data policy kicks in before the Umbrella redirection. |
Process 3: Upload Software Virtual Image to Enable Snort
If you plan to deploy security features such as Intrusion Prevention/ Detection System (IPS/IDS), Advanced Malware Protection (AMP) or URL Filtering within the remote-site WAN Edge device, then begin by downloading the UTD Engine TAR file from the Cisco website to enable these features. Make sure to upload the downloaded TAR file to your vManage software repository prior to building the security policy.
Once the configured security policy is deployed in a WAN Edge router, then the TAR file is automatically downloaded from the vManage repository into the WAN Edge device to enable the required virtual services (IPS/ AMP/ URL Filtering).
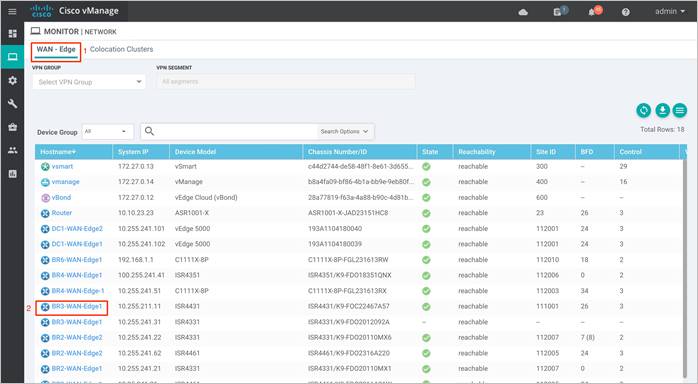
Step 1. Upload the correct Cisco security virtual image (UTD Engine TAR File) to vManage. To make sure a compatible image is downloaded from the Cisco website, login to vManage GUI and navigate to Monitor > Network.
Step 2. Each router image supports a specific range of versions for a hosted application. You can find the range of supported versions (and the recommended version) for a device within its Device Options page. Click on the specific WAN Edge device to which the virtual image will be added.
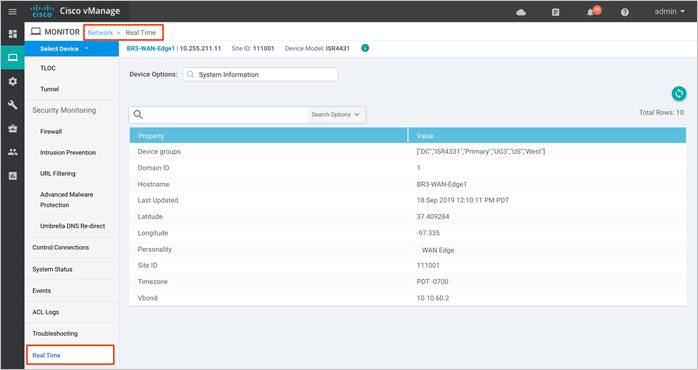
Step 3. Within Network, click on Real Time.
Step 4. Within the Device Options, enter Security App Version Status. Within the Recommended Version, you will find the recommended UTD Image that must be downloaded for that specific device.
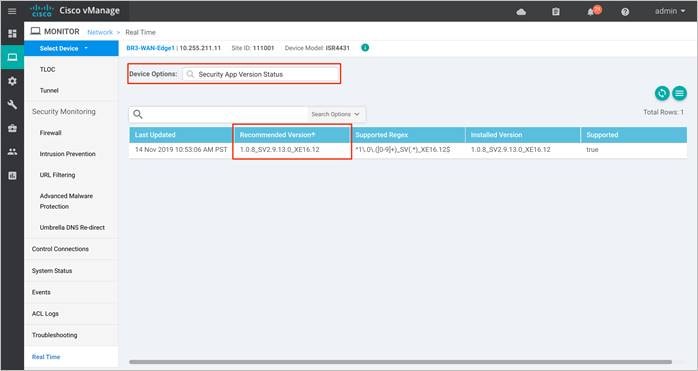
Note: The third column displays the Supported Regex pattern. The supported regex is the range of compatible virtual image versions for the router image.
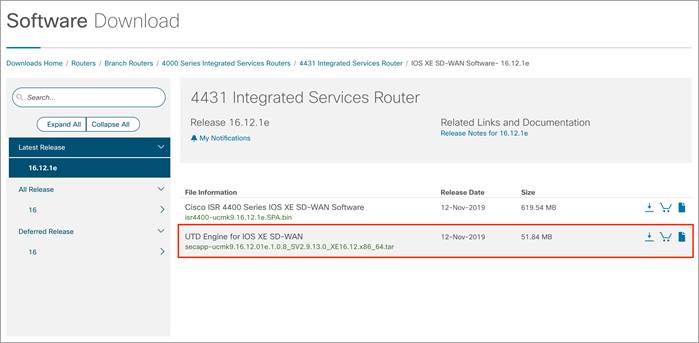
Step 5. From the Software Download page, locate the image “UTD Engine for IOS XE SD-WAN”. Click the download icon on the right-hand side of the window to download the UTD image file.
Step 6. Within the vManage dashboard, select Maintenance > Software Repository.
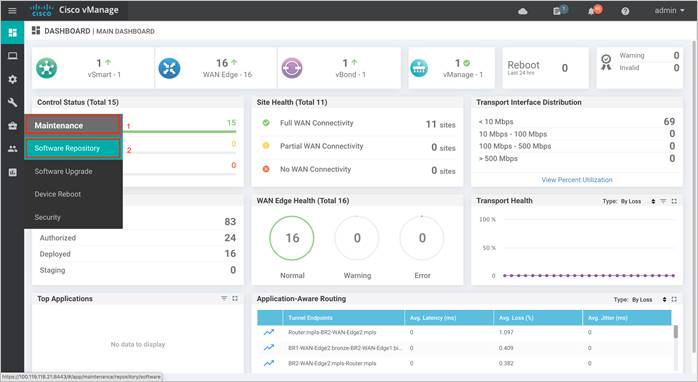
Step 7. To upload the UTD file to the vManage Software Repository, click on Upload Virtual Image tab and select vManage.
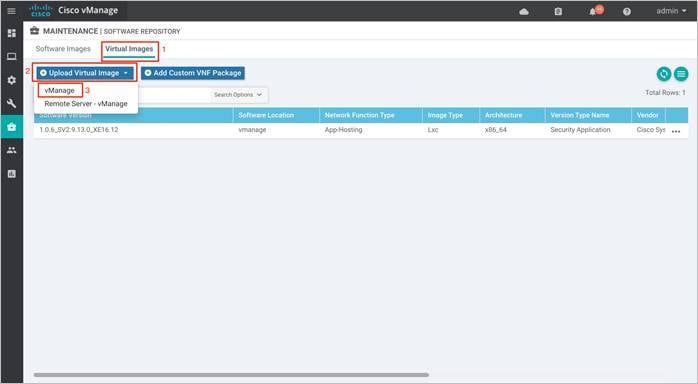
Step 8. Next, click on Browse to upload the downloaded UTD image. The image will appear on the right, and Click on Upload to add the image into the Software Repository. In case you already have the same image uploaded a notification of possible overwrite will populate.
When the security policy is activated, the UTD image is automatically downloaded from the vManage virtual images software repository into the device’s flash drive over a control plane connection.
| Technical Tip |
| To delete the software image from your vManage software repository, select the software image, click on the three dots - More actions icon and click Delete. Also, note the UTD image can be upgraded via vManage to a later code as long as the latest code is uploaded to the Software Repository. |
Process 4: (Optional) Create a Security App Hosting Profile Template
As explained in the design section on attaching a configured IPS/ AMP/ URL security policy within the device template, a sub-template titled Container Profile must be added. The container profile template allows you to enable/disable NAT for your virtual services (IPS/ AMP/ URL Security) and allocate resources for the virtual services.
The container profile template contains:
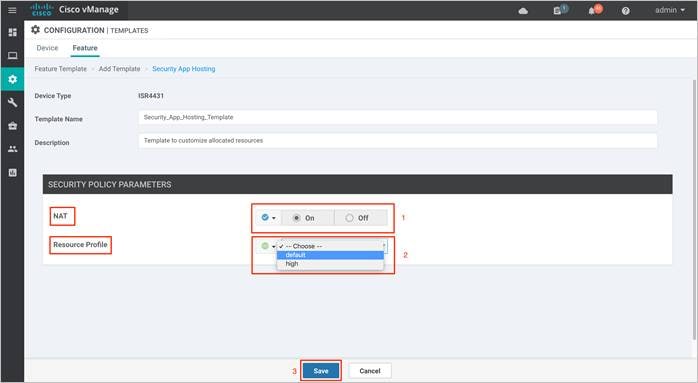
● Resource Profile that is set to Default, which allocates one core. For higher throughput, you may set the resource profile to High, which allocates two cores.
● NAT functionality can be enabled if virtual services must go out to the Internet for manual signature updates or if there is a need to send syslog’s to an external syslog server that is not necessarily in the Data Center.
Note: If you do not wish to alter the values, skip building the template and use the default Security App Hosting Profile template wherein NAT is by default turned ON and the Resource Profile is set to Default.
To create a new template, proceed to the steps below,
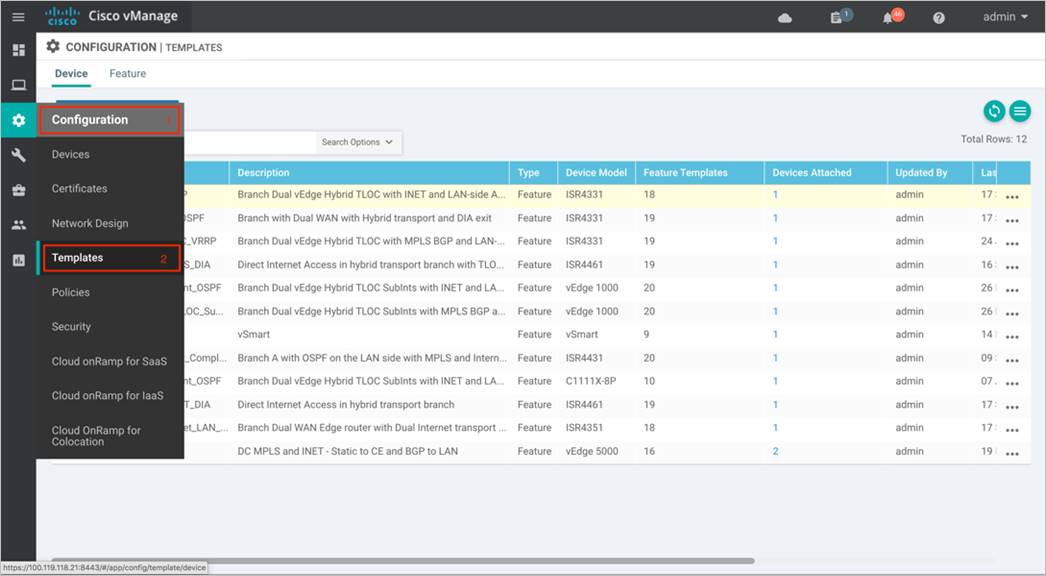
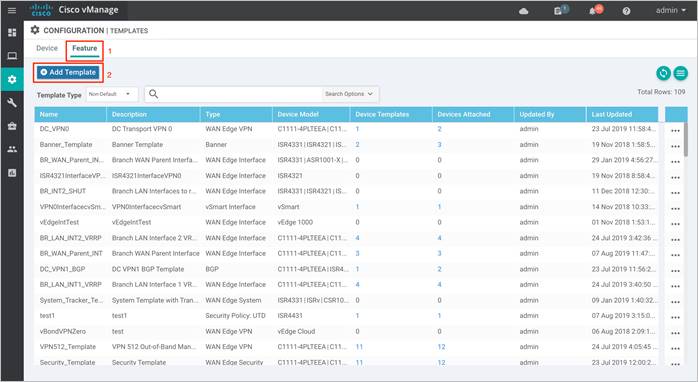
Step 1. Navigate to Configuration > Templates.
Step 2. Select Feature and click on Add Template to create a new feature template.
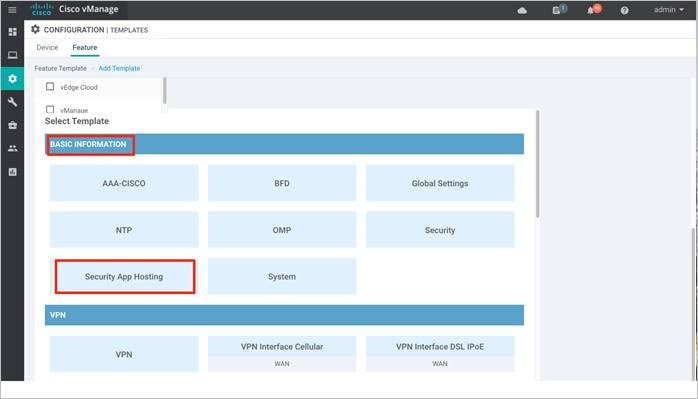
Step 3. Within Feature Template, select a device(s) or enter the device in the search bar.

Step 4. Next, select Security App Hosting to create the template.
Step 5. Within the Feature Template, enter a name for the template along with the description.
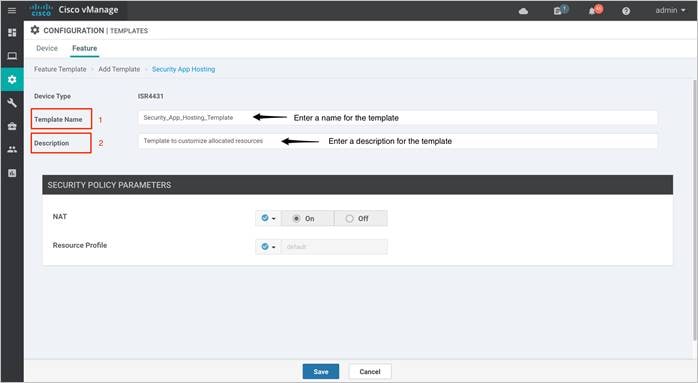
Step 6. Customize the security policy parameters if required. Enable or disable NAT feature, based on your use case. For higher throughput or if more packets need to be inspected, set the Resource Profile to High. Please refer to the Security Policy for Cisco IOS-XE SD-WAN Devices Design Guide, before making changes to the template. Finally, Save the template.
Process 5: Define Lists for Security Policy (Optional)
You can choose to either configure firewall zones, data prefixes, domain and application families prior to building the security policy or at the time when the policy is built.
Step 1. Navigate to Configuration > Security.
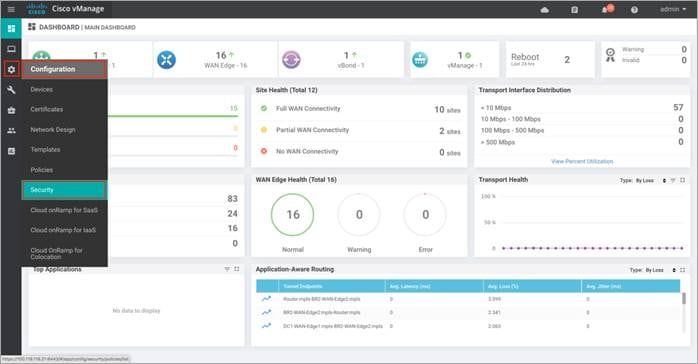
Step 2. Click Custom Options. A drop down of security options will appear. Click Lists.
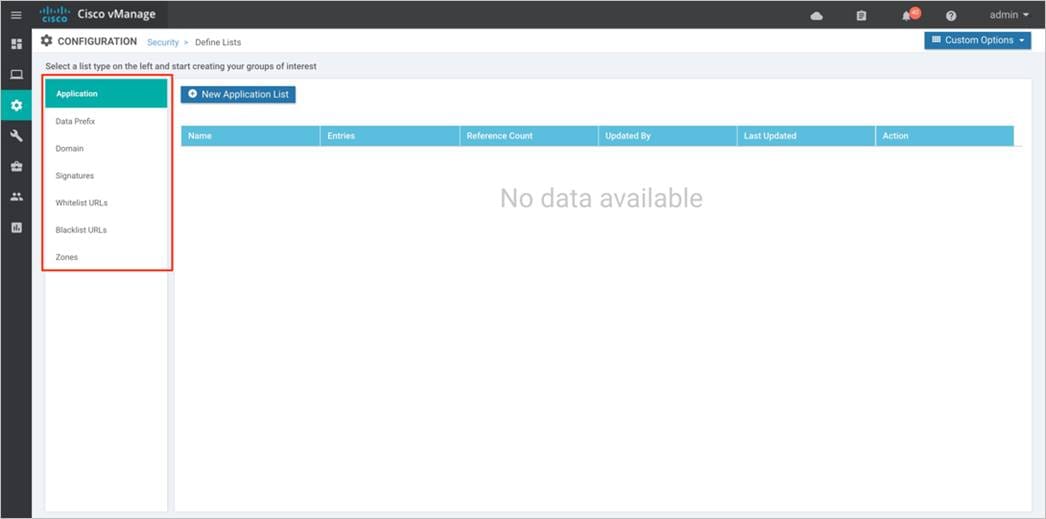
Step 3. Here, you can preconfigure lists such as Application Lists, Data Prefixes, Signatures and Zones which are later used as a part of the security policy.
| Technical Tip |
| Applications matched within a firewall policy is always dropped, regardless of what the action condition states. |
Procedure 1. Configure Lists for Enterprise Firewall with Application Awareness (Optional)
Step 1. To configure a data prefix list, select Data Prefix and then click on New Data Prefix List.
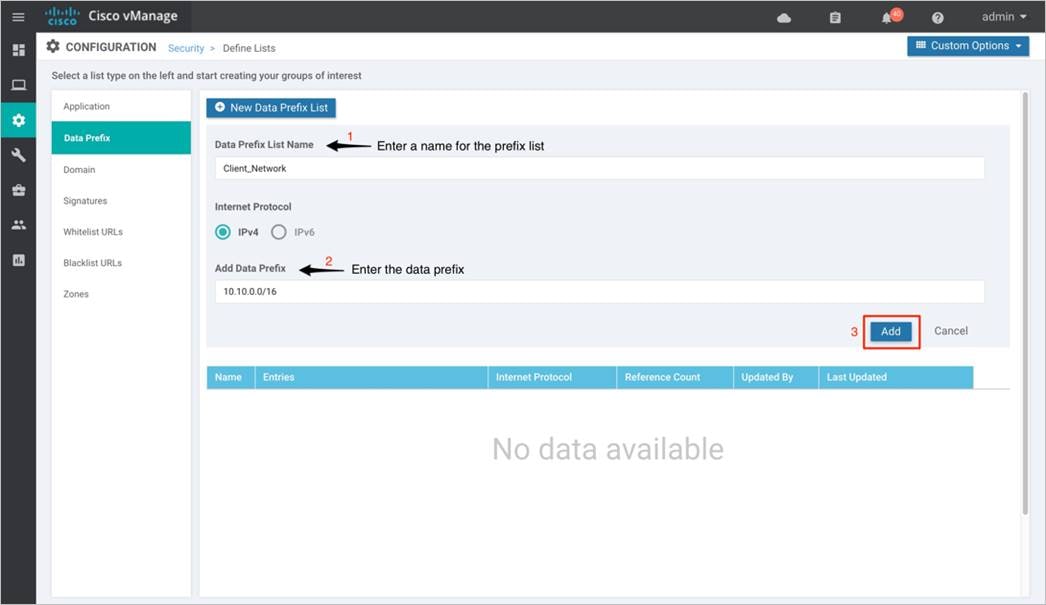
Step 2. Enter a name under Data Prefix List Name, along with the data prefix under Add Data Prefix. Enter prefix details and click Add.
The lists configured under Data Prefix include,
Table 2. Data Prefix list
| Data Prefix |
Associated Prefix |
| Client_Network |
10.10.0.0/16 |
Step 3. Similarly, configure a zone. Select Zones and then click on New Zone List. Enter a name within Zone List Name and add VPN’s within Add VPN. Finally, click Add.
The list of zones configured for Direct Cloud Access (DCA) use case.
Table 3. Data Prefix list
| Zone |
Associated VPN |
| INSIDE |
1 |
| OUTSIDE |
0 |
Procedure 2. Define Domain Lists. (Optional)
Define domain lists through the vManage security configuration wizard that must be bypassed by the DNS server configured within DNS Security.
Step 1. In the security screen, click on the Custom Options drop-down and click on Lists.

Step 2. Select Domain from the left pane, enter a domain name and add domain names to the list. Finally, Add the list of domain names.
Note, no domain lists were configured in this deployment.
Process 6: Configure Threat Grid API Key
Once you have an active Threat Grid (TG) account with access/role set as device-admin, configure the Threat Grid (TG) API key on WAN Edge device.
Step 1. Log into the Cisco AMP Threat Grid dashboard and click on My Account.
Step 2. Under your Account Details, an API key may already be visible if you've created one already. Click on the copy icon to copy the API Key.
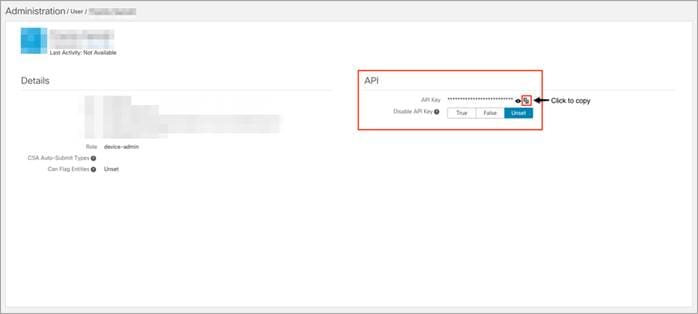
If you do not have an API key available, click Generate New API Key. Your API key should then be visible under User Details > API Key.
Step 3. Log into Cisco vManage and navigate to Configuration > Security in the left side panel.
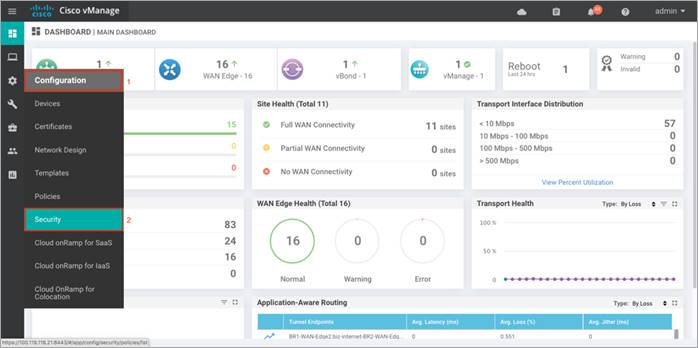
Step 4. In the security screen, click on the Custom Options drop-down and select Threat Grid API Key.
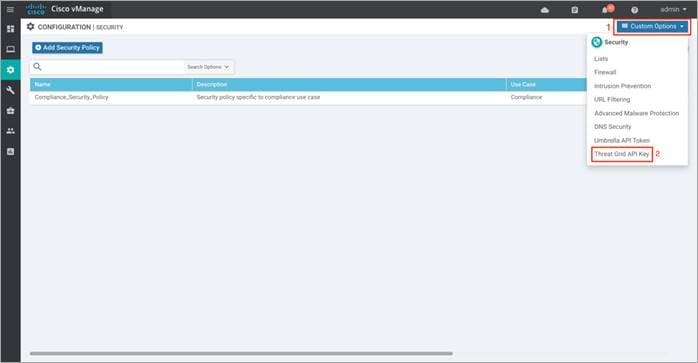
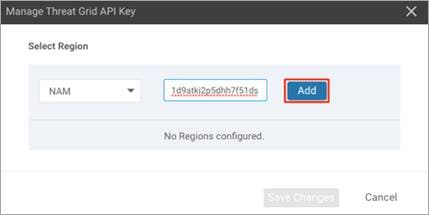
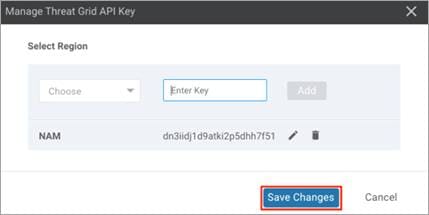
Step 5. In the Manage Threat Grid API key pop-up box, choose a region from the Region drop-down and enter the API key in the Key field.
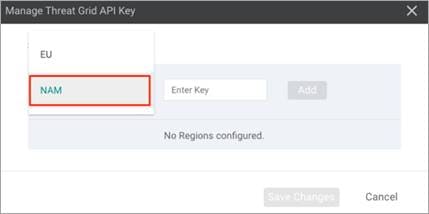
Step 6. Click Add and Save Changes.
Process 7: Configure Umbrella API Token
Make sure you have an active Umbrella account with reachability from the WAN Edge device to the Cisco Umbrella DNS servers. Configure the Umbrella API token from the Umbrella portal using the vManage security policy wizard.
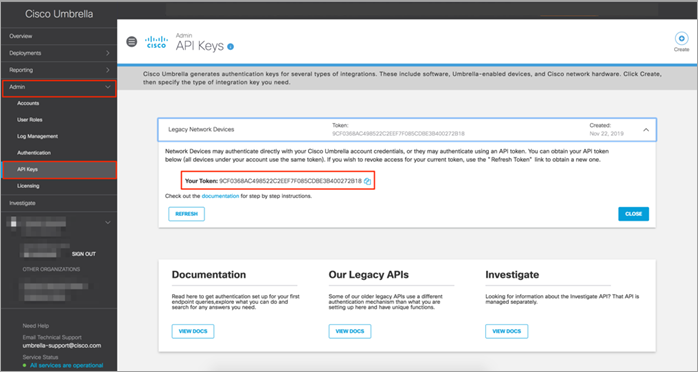
Step 1. Log in to the Umbrella account, navigate to Admin and click on API Keys. Within Admin API Keys dashboard, Copy Your Token.
Step 2. Next, log in to Cisco vManage and navigate to Configuration > Security in the left side panel.

Step 3. In the security screen, click on the Custom Options drop-down list and select Umbrella API Token.
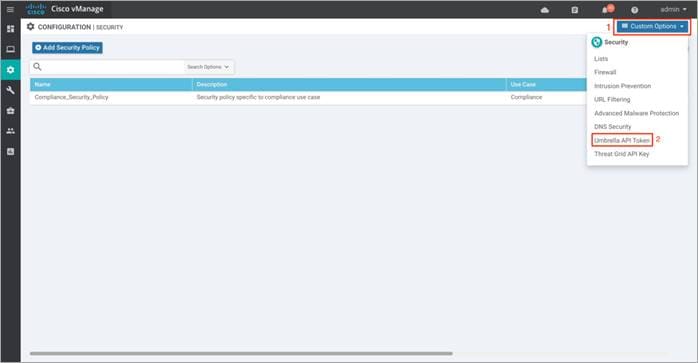
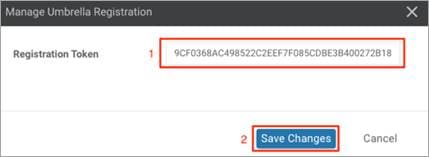
Step 4. Enter Registration Token number in the field and click Save Changes to configure the Umbrella API Token.
Deploy: Cisco SD-WAN Secure Direct Cloud Access
This section covers the steps to deploy Cisco SD-WAN security features specific to the Direct Cloud Access (DCA) use case. The features discussed include Enterprise Firewall with Application Awareness (Application Firewall), Intrusion Prevention (IPS), Advanced Malware Protection (AMP) and DNS/ Web-Layer Security.
● Make sure the prerequisites explained previously are added.
● Enable the IPS signature automatic updates using vManage.
● Create the security policy containing Enterprise Firewall with App Aware (Application Firewall), Intrusion Prevention (IPS), Advanced Malware Protection (AMP) and DNS/ Web-layer Security feature.
● Attach the security policy to the Device Template.
● Attach the Security App Hosting (Container Profile) feature template to the device template.
Process 1: IPS Signature Update
Step 1. To enable the automatic IPS signature update, navigate to Administration > Settings tab in the left side panel.
Step 2. Click Edit to enable IPS Signature Update.
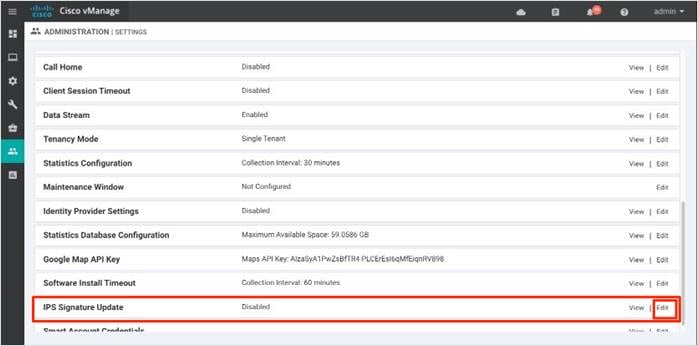
Step 3. Enter your Cisco CEC username and Password, and set the IPS Signature Download Interval from 1 minute to 24 hours. In this guide, the time interval is set to 1 hour.
For successful signature update, make sure you have reachability to cloudsso2.cisco.com from vManage GUI - VPN 0 transport interface.
Note: To verify if the signatures are being updated, refer to the operate section for the troubleshooting steps.
| Technical Tip |
| To manually update the signature package via CLI on a WAN Edge device that has reachability to the Internet, you can either enter utd signature update server cisco username <username> password <password>. To manually update the signature package on a WAN Edge device with no internet access, download the signature package from CCO and upload the file to the WAN Edge device. Next, enter utd signature update file bootflash:<signature.pkg>. |
Process 2: Create Security Policy
Configure security parameters such as Enterprise Firewall with Application Awareness, Intrusion Prevention System (IPS), Advanced Malware Protection (AMP) and DNS/ Web-layer Security.
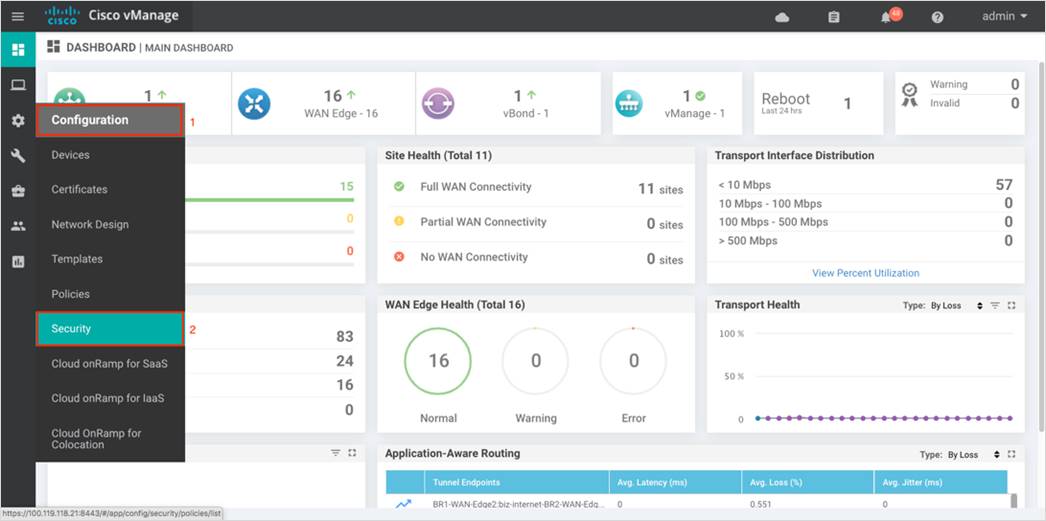
Step 1. In Cisco vManage NMS, navigate to Configuration > Security in the left side panel.

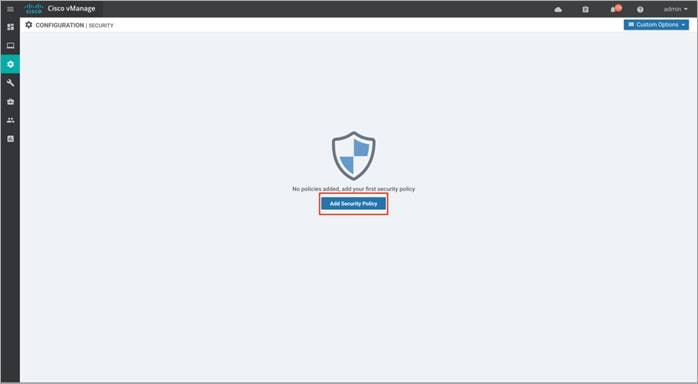
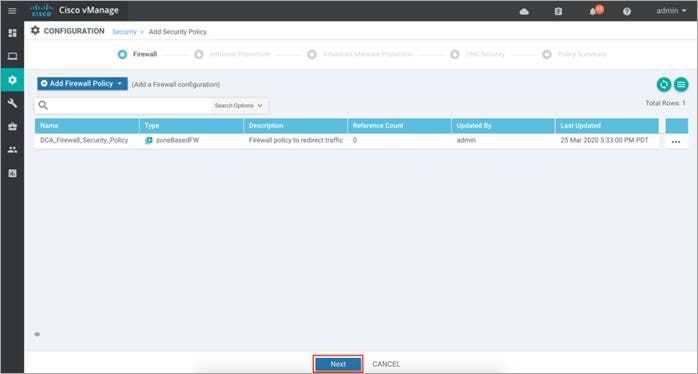
Step 2. Click Add Security Policy to create a new security policy.
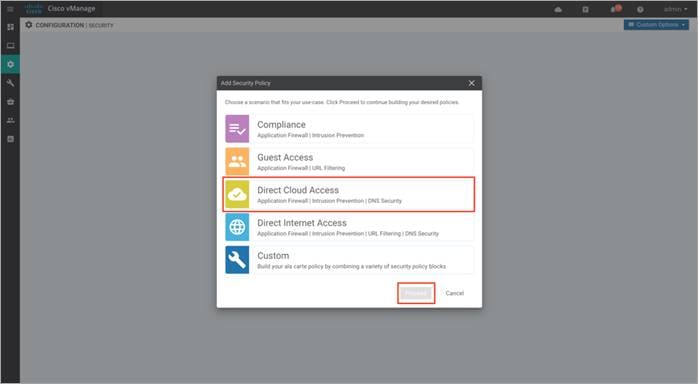
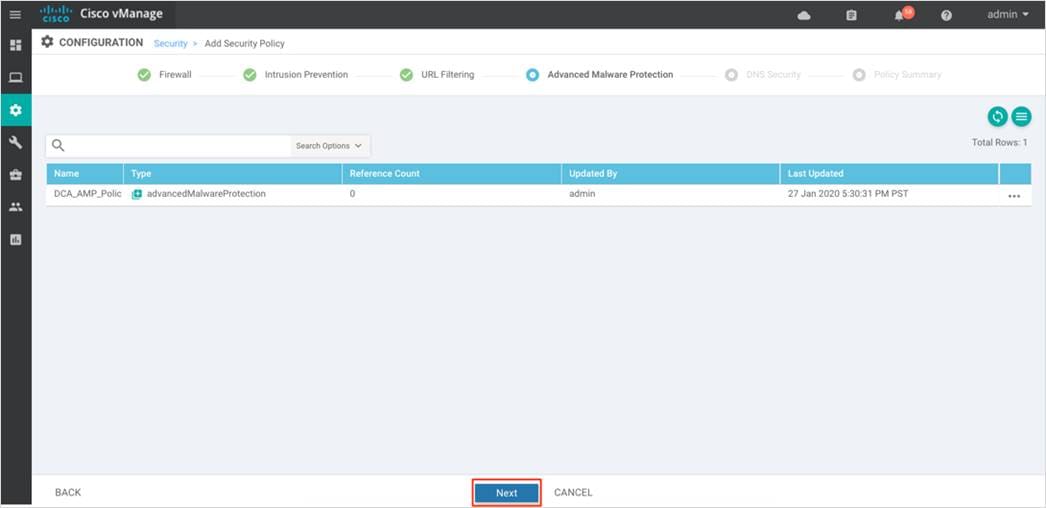
Step 3. The security policy wizard displays a list of intent-based use cases. From the given list, choose Direct Cloud Access and click Proceed.
Procedure 1. Configure Enterprise Firewall with Application Awareness
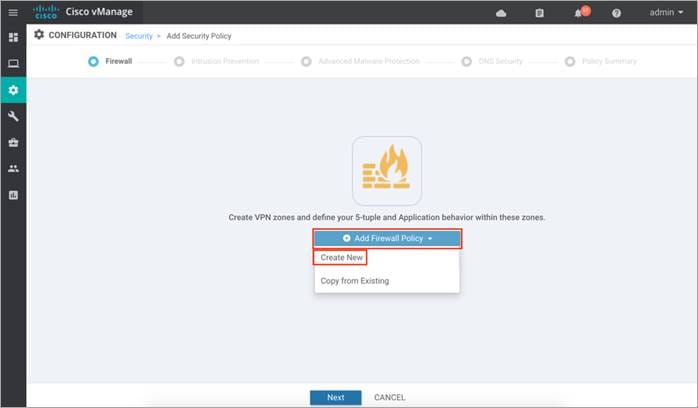
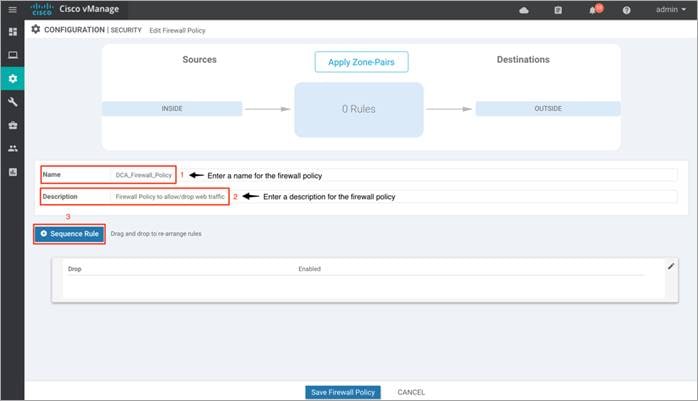
Step 1. Click Add Firewall Policy, create a new firewall policy by selecting Create New and click Next. However, if you have preconfigured a firewall policy, simply click on Copy from Existing.
Step 2. Click on Apply Zone-Pairs to create your zone-pairs.
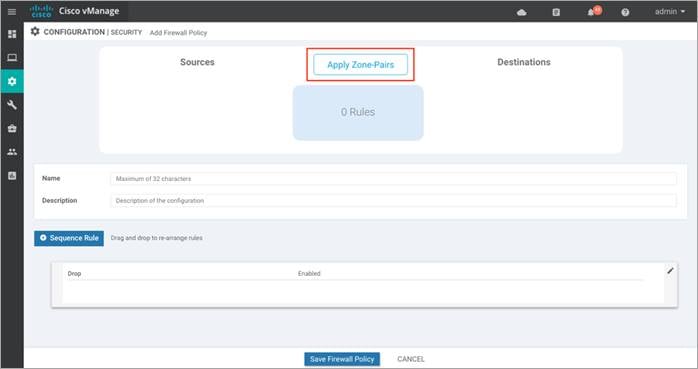
Step 3. Add the created zones to Source Zone and Destination Zone, and click Save.
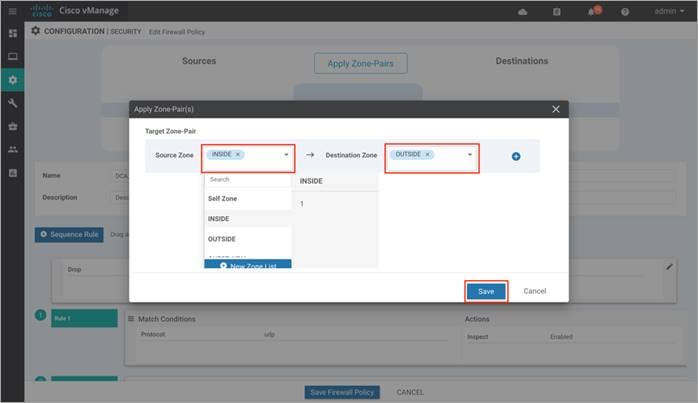
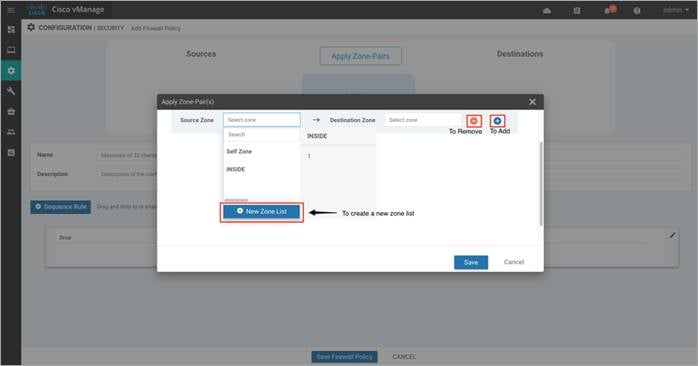
Note: If you wish to create a new zone, click on the New Zone List, and to add additional zone-pair click on the (+) sign. To remove a zone pair, click on (–) sign. See the following example:
| Technical Tip |
| Starting from Cisco SD-WAN Release 19.2 and IOS XE Release 16.12, the Self Zone option is added in the Source Zone field. Self zone is a self-defined zone that protects the packet going to or coming from the device. A zone pair that includes the self zone, along with the associated policy, applies to traffic directed to the device or traffic generated by the device. |
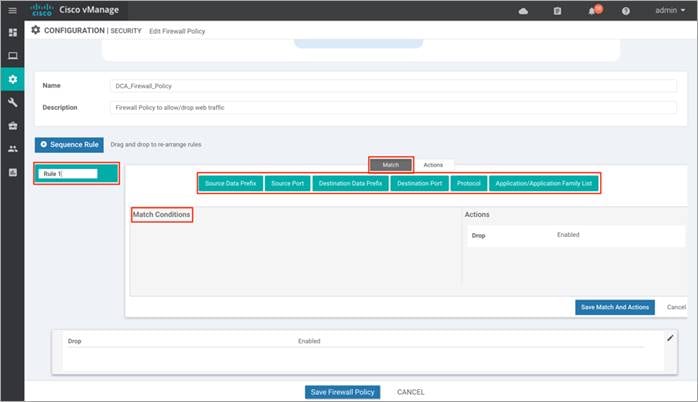
Step 4. Enter a Name and Description in the field for the firewall policy, next click on Sequence Rule to add policy rules.
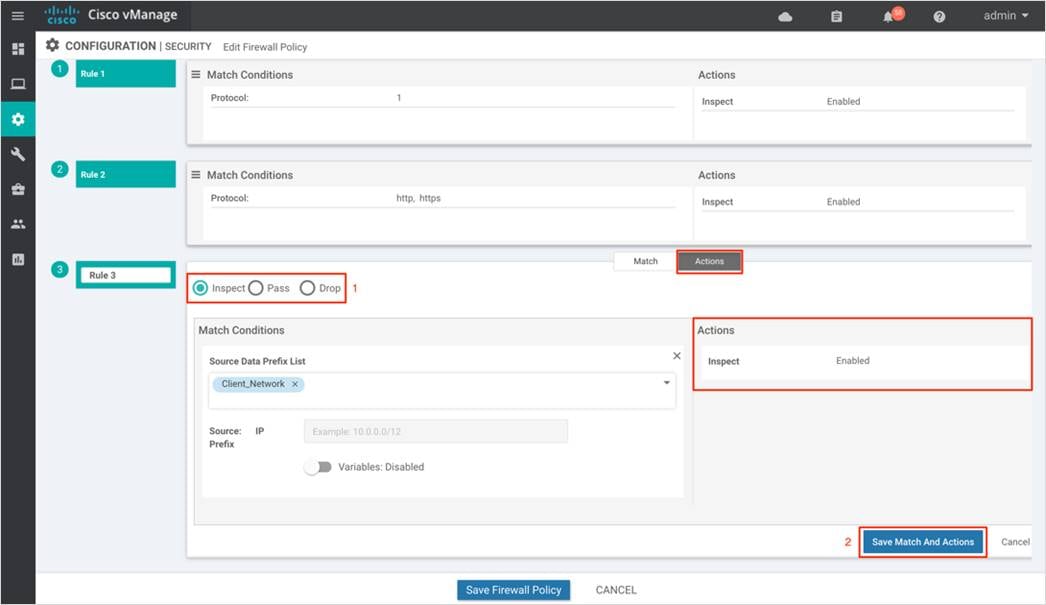
Step 5. The Match tab is selected by default. Click a match condition: Source Data Prefix, Source Port, Destination Data Prefix, Destination Port, Protocol, Application/Application Family List. You can select and configure more than one match condition in a sequence.
Here’s an example of sequence rule within the Enterprise Firewall with Application Awareness policy deployed.
In this firewall policy, we inspect both TCP flows and traffic originating from the Client_Network. Any application traffic matching the applications listed in the "Application list to drop" will be dropped regardless of the action condition.
Firewall CLI:
class-map match-any SAAS_Application-cm0_
match protocol dropbox
match protocol gmail
match protocol ms-office-365
!
policy-map type inspect avc SAAS_Application-pm_
class SAAS_Application-cm0_
deny
!
policy-map type inspect DCA_Firewall_Policy_1
class DCA_Firewall_Policy_1-seq-1-cm_
inspect
!
class DCA_Firewall_Policy_1-seq-11-cm_
inspect
service-policy avc SAAS_Application-pm_
!
class class-default drop
!
!
The firewall policy inspects traffic that matches the "DCA_Firewall_Policy_1-seq-11-cm_" class based on L3/L4 information and the traffic is permitted, unless it matches the defined "Application list to drop”.
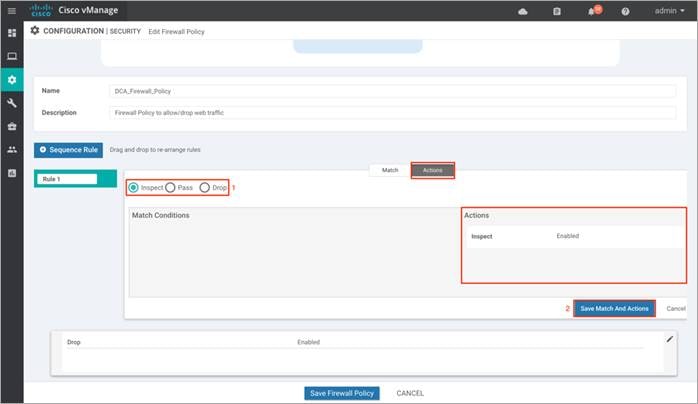
Step 6. Next, Click on Actions tab and enter the actions to take if the traffic matches. We have enabled Inspect.
Note, in this deployment, the following sequence rules were added.
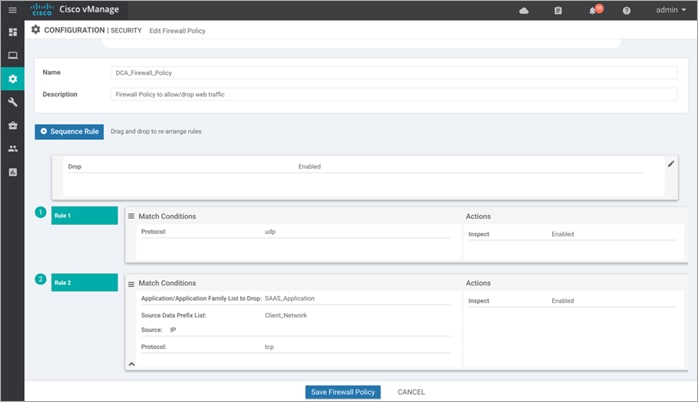
Within SAAS_Application, we have matched one SAAS application that is to be dropped.
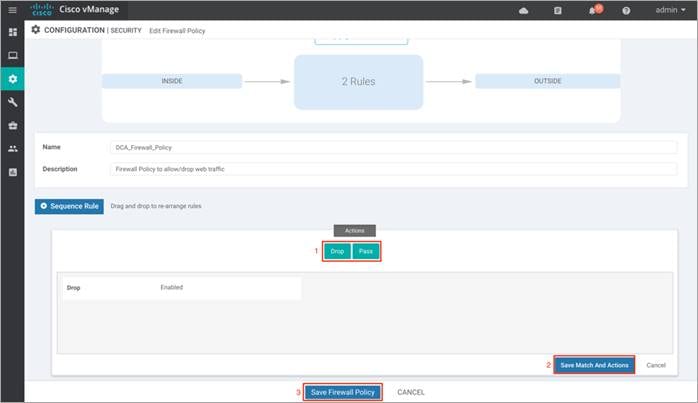
Step 7. (Optional) If a packet matches none of the parameters in any of the policy sequences, you define a default action to be taken on the packet. So, once you have the sequence rules configured, continue to edit the default action to either Drop or Pass and click Save Match And Actions to save the changes made. Finally, save the configured firewall policy.
In this deployment, the default action is set to Drop.
Step 8. Click Next, to configure the Intrusion Prevention Policy.
Procedure 2. Configure Intrusion Prevention Policy
Step 1. Click on Add Intrusion Prevention Policy to enable Snort IPS, select Create New to create a new IPS policy and click Next.
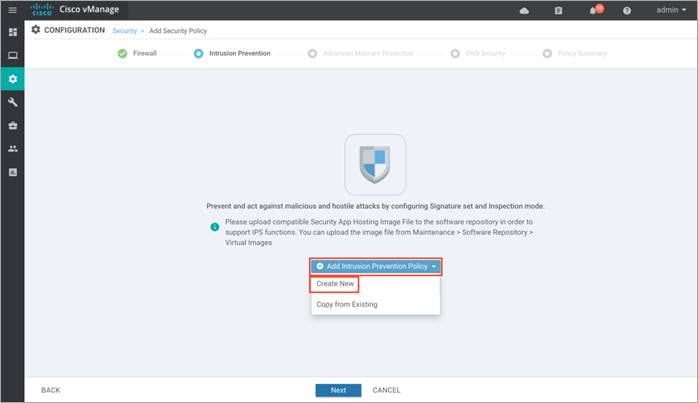
Note: If you wish to export an existing policy, simply click on Copy from Existing, fill in the policy details and then Next.
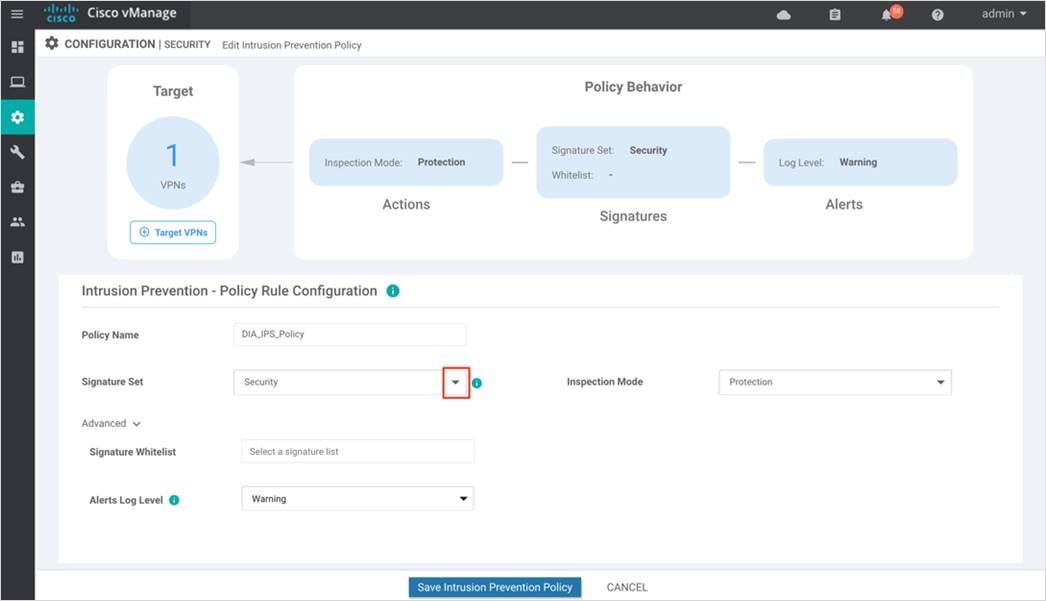
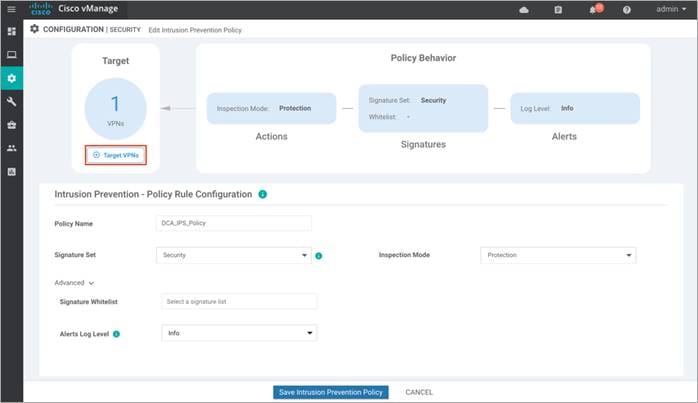
Step 2. Enter a policy name in the Policy Name field.
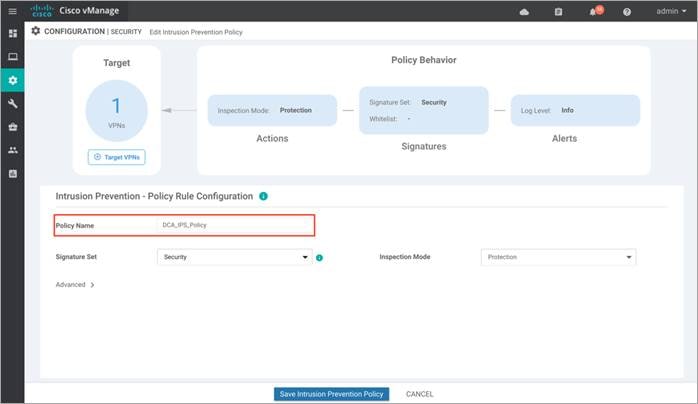
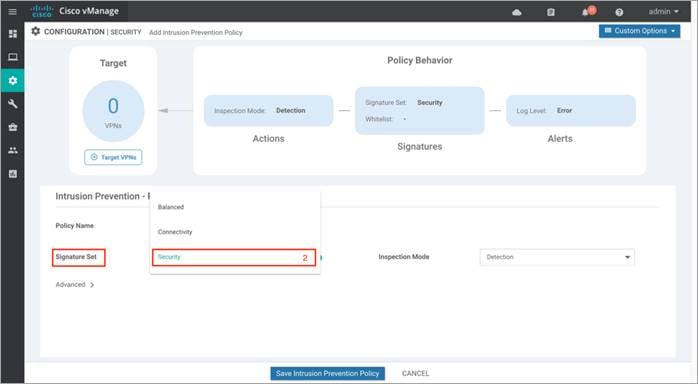
Step 3. Select a Signature Set that defines the rules for evaluating traffic from the Signature Set drop-down.
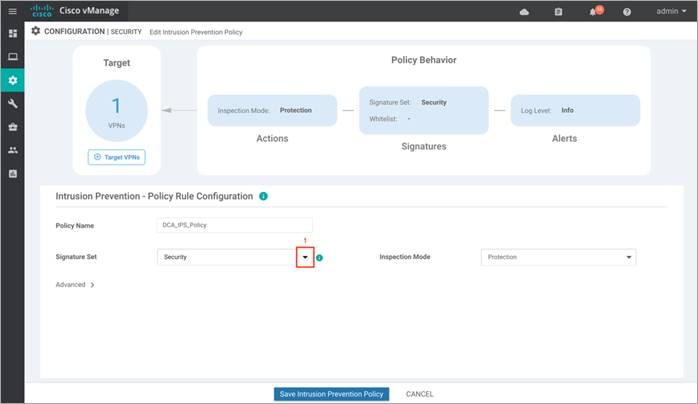
Step 4. In the Signature Set field, choose the desired signature set:
Connectivity: Less restrictive with better performance as there are fewer rules attached to this signature level.
Balanced: Designed to provide protection without a significant effect on system performance.
Security: With more added rules, this signature level offers the most protection.
Signature set refer to rules/signatures that have been developed, tested and approved by the Talos Security Intelligence and Research Team (Talos). Connectivity has the least number of signatures, Security has the most number of signatures and Balanced striking a ‘balance’. For more information on Signature Set refer to the Security Policy for Cisco IOS-XE SD-WAN Devices Design Guide.
| Technical Tip |
| To understand the CVSS score of a signature set, hover over the (!) found on the right side of the tab.
|

Step 5. Select the mode of operation from the Inspection Mode drop-down. By default, the mode of operation is set to Detection.
Step 6. The following options will populate:
Detection: Choose this option for intrusion detection mode. (Default)
Protection: Choose this option for intrusion protection mode.
In Detection mode (IDS), Snort inspects the traffic and reports alerts, but does not take any action to prevent attacks. In Protection mode (IPS), in addition to Intrusion detection, actions are taken to prevent attacks.
In this deployment guide, the Inspection Mode is set to Protection.
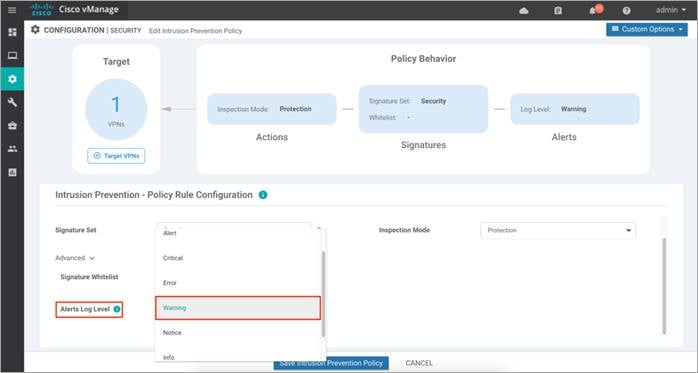
Step 7. Click on Advanced tab, to whitelist signatures within Signature Whitelist and set the Alerts Log Level.
Signatures are whitelisted to reduce the number of false positives i.e. to reduce the chance of a non-harmful file being detected as a malware.
The signature whitelist format on vManage is Generator Identifiers (GID): Signature Identifiers (SID). For additional information on whitelisting signatures refer to the Security Policy for Cisco IOS-XE SD-WAN Devices Design Guide.
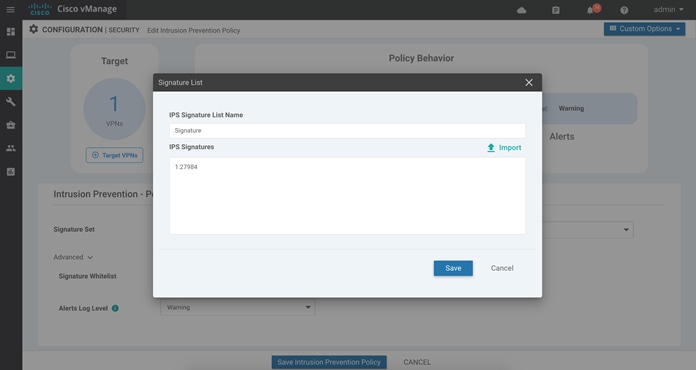
Step 8. To create a new signature list, click on Signature Whitelist and within the drop-down, click on New Signature List.
Step 9. In this IPS Signature List Name field, enter a name consisting of up to 32 characters (letters, numbers, hyphens and underscores only).
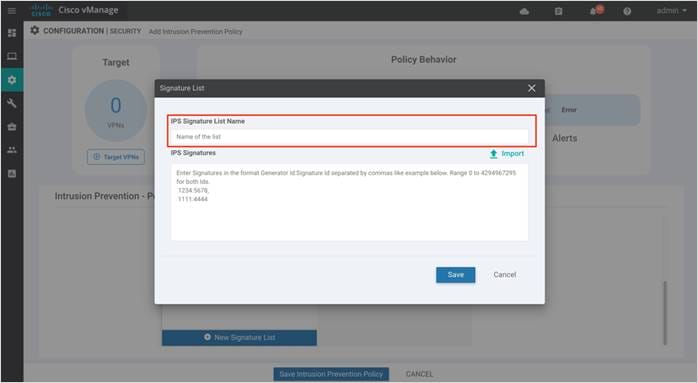
Step 10. Within the IPS Signature field, enter signatures in the format Generator ID:Signature ID, separated with commas and click Save to save the configured Signature List.
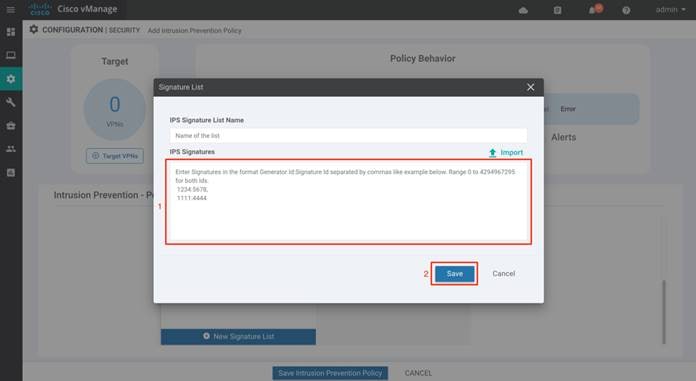
For example, APP-DETECT signature is whitelisted as GID:SID - 1:27984.
| Technical Tip |
| One of the methods to find the GID and SID associated with a given signature rule in a signature set prior to deploying IPS functionality on the remote-site WAN Edge router, is to download the signature package from Cisco Software Central and then rename the downloaded file format from .pkg to .tar. Next, extract the renamed TAR file twice and click on the Rules folder contained in the unzipped file to view the signature rules associated with the signature sets. Within each signature rule, you can look for Signature ID (SID) and Generator ID (GID) associated with the Signatures to be whitelisted. The other is to copy SID’s and GID’s from the generated alert logs or to download the .pkg file into the edge devices flash drive, then enter command utd threat-inspection signature active-list write-to bootflash:<filename.txt> threat-inspection profile <ips profile>. |
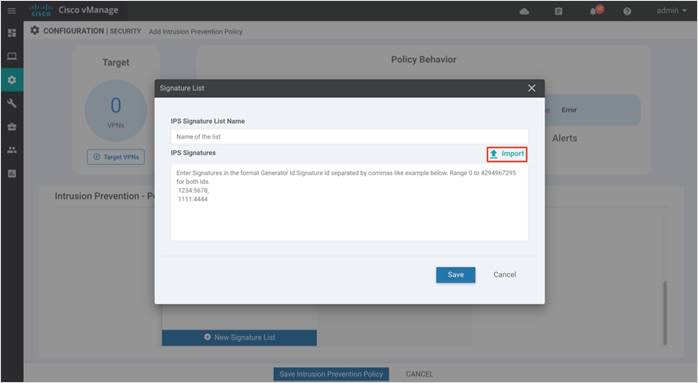
Note: You can also choose to import whitelisted signatures, by clicking on the Import button to retrieve file a from an accessible storage.
| Technical Tip |
| You can also create and manage the IPS Signature Whitelist by navigating to Lists from Custom options available in the security policy GUI. |
Step 11. Select an alert level for syslog’s from the Alert Log Level drop-down. Within the drop-down you will find the following options - Emergency (Severity = 0), Alert (Severity = 1), Critical (Severity = 2), Error (Severity = 3), Warning (Severity = 4), Notice (Severity = 5), Info (Severity = 6), Debug (Severity = 7) (Severity/Priority). The alerts are exported as syslog messages.
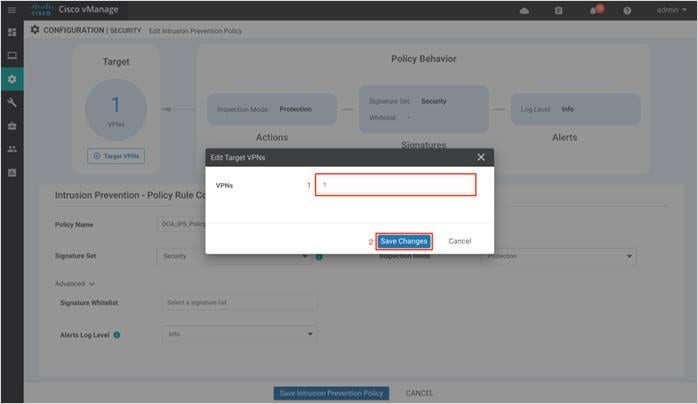
Step 12. Next, set the Target VPNs. Click on Target VPNs to add VPNs in the Target VPNs wizard.
Step 13. Within the tab on the right, enter the VPN number next to VPNs. You can enter a single, or multiple service-side VPN or VPN 0. If you wish to add more VPNs, separate each VPN with commas. Finally, click on Save Changes.
In this example, VPN label added within the tab is VPN 1.
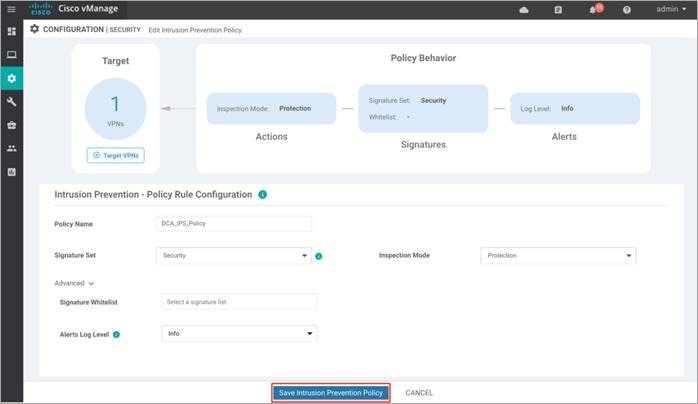
Step 14. Click on Save Intrusion Prevention Policy to add the configured Intrusion Prevention security policy.
Step 15. Click Next as needed to select the Advanced Malware Protection tab.
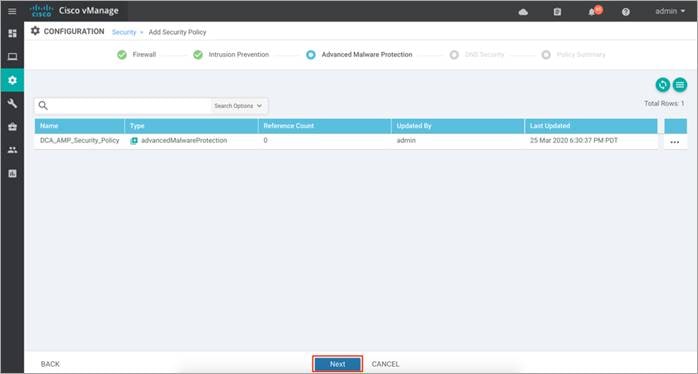
Procedure 3. Advanced Malware Protection Policy
Step 1. In the Advanced Malware Protection tab, click the Add Advanced Malware Protection Policy drop-down and select Create New. Finally, click Next.
Note: You can also export the policy by clicking on Copy from Existing and click Next.
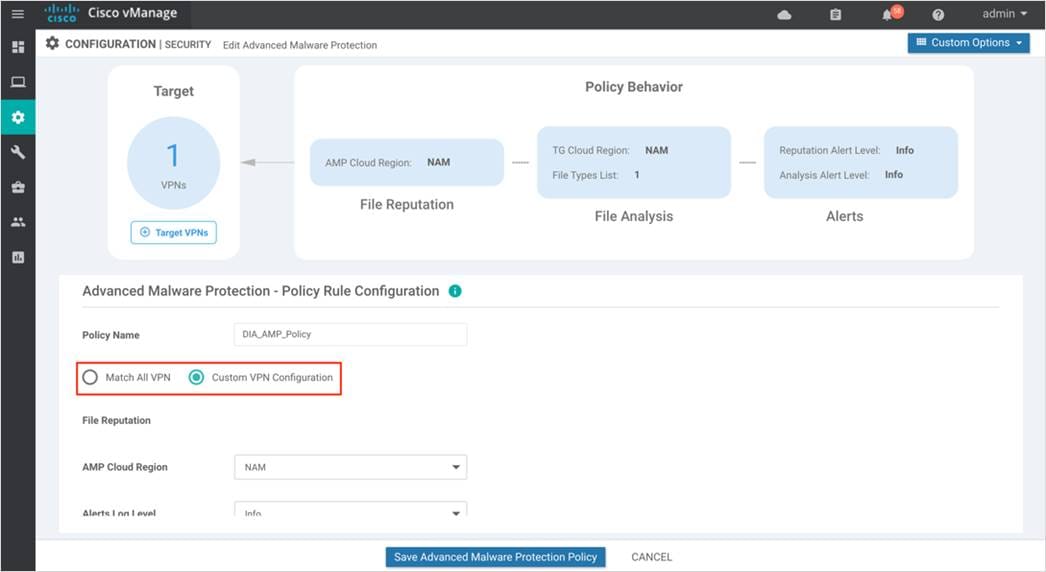
Step 2. In the Policy Name field, enter a name for the AMP policy. The name can be up to 128 characters and can contain only alphanumeric characters.
Step 3. Select either Match All VPN to apply the policy to all VPNs or choose Custom VPN Configuration to input the specific VPNs.
If you choose Custom VPN Configuration, you are redirected to the page below.
Step 4. Click on Target VPNs, and enter the VPN ID against VPNs. Finally, click on Save Changes.
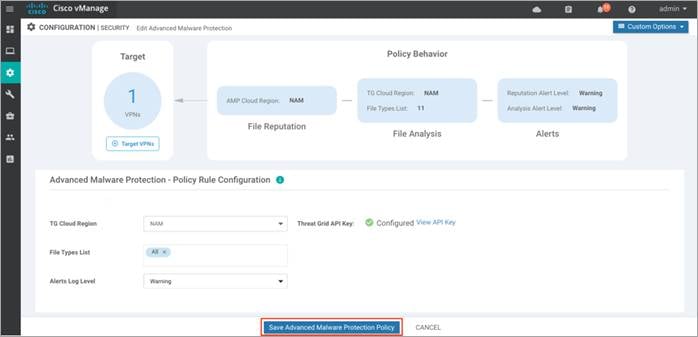
Step 5. Within File Reputation, select a global region from the AMP Cloud Region drop down.
Step 6. Within the Alerts Log Level drop down, select one among the three severity levels – Critical, Warning or Info. It is ideal to stick to the Warning severity level for balance of load and information at production site. The Info severity level generates multiple notifications and can affect system performance and hence may not be ideal for real-time traffic.
Step 7. Click on File Analysis and slide the tab.
Note: To enable Threat Grid, please make sure you have the procured appropriate DNA subscription license.
Step 8. From the TG Cloud Region dropdown, select a global region.
Step 9. If the Thread Grid API key was not previously added, click on Manage API Key.

Step 10. Within File Types List, select the file types to be analyzed.
Step 11. From the Alerts Log Level drop down, select a severity level. (Critical, Warning or Info) Just as explained for File Reputation, It is ideal to stick to Warning severity level for balance of load and information at production site.
Step 12. Click on Save Advanced Malware Protection Policy.
Step 13. Click Next to configure DNS/ Web-Layer security policy.
Procedure 4. DNS/ Web-layer Security Policy
The following steps enable DNS Security policy with Umbrella Integration.
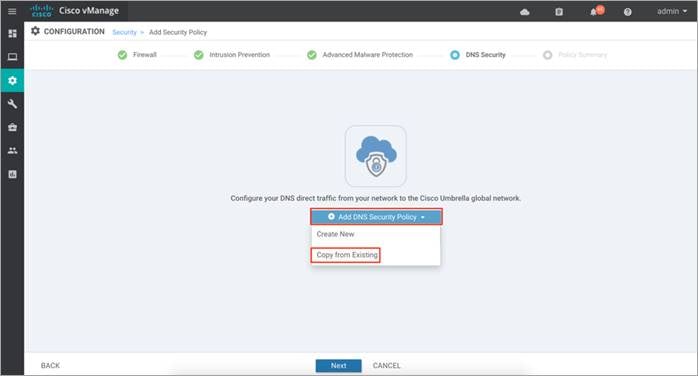
Step 1. In the Security Policy wizard, click on Add DNS Security Policy and select Create New to add a new DNS/Web-Layer security policy. Finally, click Next.
Note: Alternatively, click on Copy from Existing to export an existing DNS Security Policy and click Next.
Step 2. Enter a policy name in the Policy Name field.
Step 3. The Umbrella Registration Status displays the status about the API Token configuration.
Note: If the Umbrella Registration Status displays as Not Configured, then click on Manage Umbrella Registration and add Registration Token.
Step 4. Select either Match All VPN to keep the same configuration for all the available VPNs or select Custom VPN Configuration to add Target VPNs to your policy.

Step 5. Within the Target VPNs wizard, add target VPNs within the VPNs tab. Select the DNS Server IP to redirect DNS traffic to Umbrella DNS Server resolvers or Customer DNS Server IP address and enable/disable Local Domain Bypass. Finally, click on Save Changes.
Step 6. (Optional) Select the domain bypass from the Local Domain Bypass List drop-down as shown. Some of the possible regex patterns/formats to enter domain lists on vManage include, .*cisco.com, .*.cisco.com
Note: You can also create new regex patterns by clicking on New Domain List. Note, in this guide, Local Domain Bypass List is not enabled.
Step 7. Click on the Advanced tab to enable or disable the DNSCrypt. By default, the DNSCrypt is enabled. Note, DNSCypt encrypts DNS packets with EDNS (Device ID and Client IP) data and is supported only for Umbrella. Finally, click on Save DNS Security Policy.
Step 8. Click Next to configure the Policy Summary.
Procedure 5. Configure Policy Summary
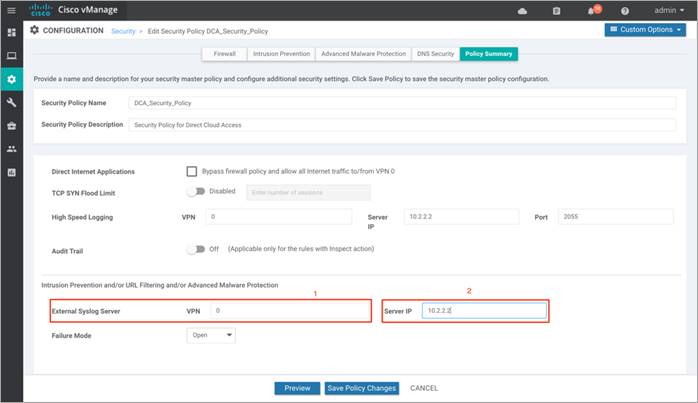
Step 1. Within Policy Summary, provide a name and description for your security master policy.
Step 2. To log firewall packets that flow through routing devices (similar to the NetFlow Version 9 records) to an external collector enable High Speed Logging and enable Audit Trail to record the start, stop, and duration of a connection or session, and the source and destination IP addresses.
Within High Speed Logging, next to VPN tab enter the VPN label and against Server IP enter the IP Address of your server.
Note, this feature is supported on WAN Edge devices running code 16.12 or a later code.
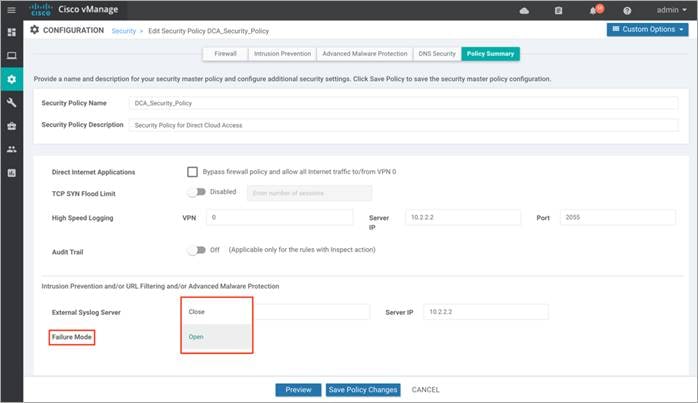
Step 3. Under the Intrusion Prevention/ URL Filtering/ Advanced Malware Protection section, you can fill in details to send logs to your External Syslog Server. Here, the External Syslog Server is set within VPN 0, hence the VPN label in VPN tab is 0, followed by Server IP address next to Server IP.
Step 4. Set the Failure Mode to either Open or Close.
Note: If the Snort engine fails for any reason, and the device is set in fail-open mode, then the traffic bypasses all security features. In fail-close mode, traffic is dropped when an engine failure is detected.
Enable fail-close if security is the concern and select the option fail-open only if connectivity is the concern. Select one among the two based on the design. For more details, refer to the Security Policy Design Guide for Cisco IOS-XE SD-WAN Devices.
Step 5. Click on Preview to view the CLI equivalent for the policy to be deployed.
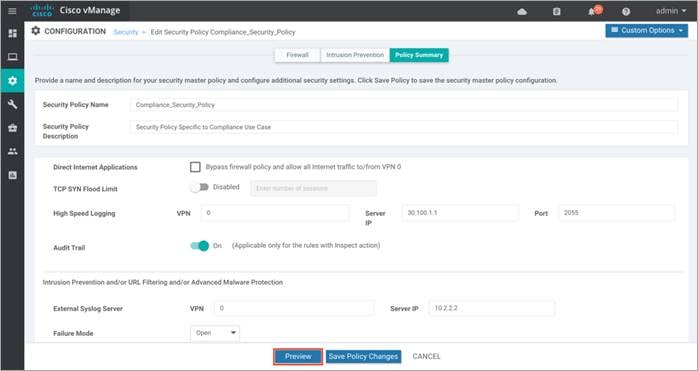
Step 6. Finally, click Save Policy Changes.
Process 3: Attach the Security Policy to the Device Template.
To apply the configured security policy to a remote-site WAN Edge device, follow the steps listed below.
Step 1. Navigate to Configuration > Templates.

Step 2. To attach the security policy to a Device Template, click on the three dots found on the right side of the template and select Edit from the drop-down options.
Step 3. Within the Device Template, navigate to Additional Templates and attach the Security Policy (DCA_Security_Policy), along with the Container Profile* (Security_App_Hosting). Finally, click Update.
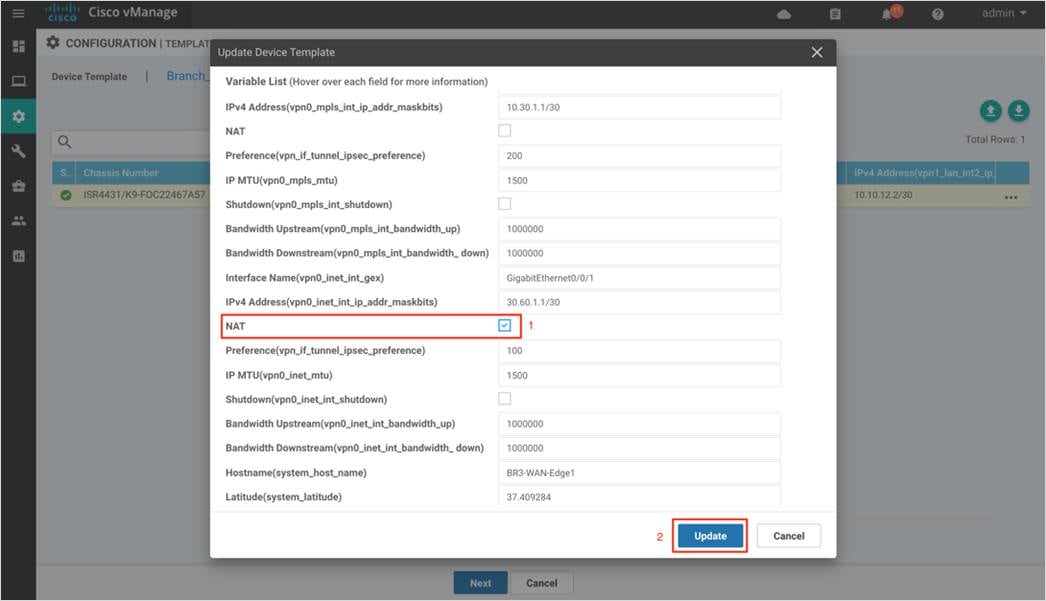
Step 4. Make sure NAT is already configured on the WAN Internet transport Interface. To do so click on the three dots and select Edit.

Note: If NAT feature is not currently configured as a variable in your interface feature template, you will need to modify the WAN Interface Feature Template to enable NAT. You can do this before or after deploying the security policy.
Step 5. Once, the changes are made click Next.
Step 6. Finally, select the WAN Edge device from the Device list on the right panel to preview the configuration and then click, Configure Devices to configure the device with the security policy along with the container profile.
Step 7. The Task View screen will display the results. Look for the status of the template to verify if the template was successfully attached to the device.
Operate: Cisco SD-WAN Secure Direct Cloud Access
Using the vManage GUI, you can monitor, troubleshoot and manage the Cisco SD-WAN security features deployed. The 3 main ways to troubleshoot the security features is via,
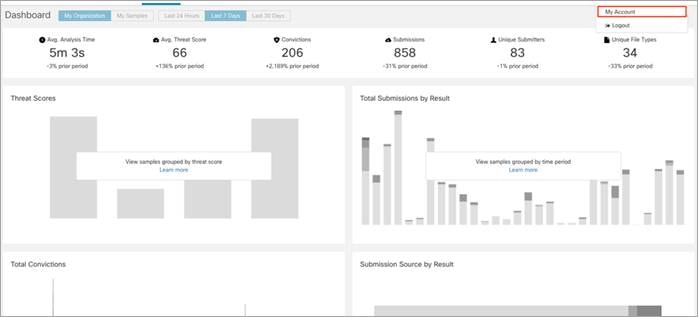
vManage Main Dashboard: The vManage main dashboard displays the graphical view of all the packets inspected, dropped by the firewall, signature violations for IPS, files transferred along with its disposition for AMP.
vManage Monitor Dashboard: The vManage monitor dashboard displays the graphical and real time statistics of the traffic inspected by the security features configured.
vManage SSH Server Dashboard: The vManage SSH server dashboard provides the option to manage the WAN Edge device via CLI.
Note: You can also configure a syslog server and scan through the logs gathered within the server to monitor your WAN Edge device.
Process 1: Monitor the Enterprise Firewall with Application Awareness Feature via vManage NMS
Monitor, manage and troubleshoot the Enterprise Firewall with Application Awareness feature via vManage NMS.
Procedure 1. Monitor the Firewall Feature via vManage Main Dashboard
Using the vManage NMS dashboard, you can view the firewall statistics via dashboard.
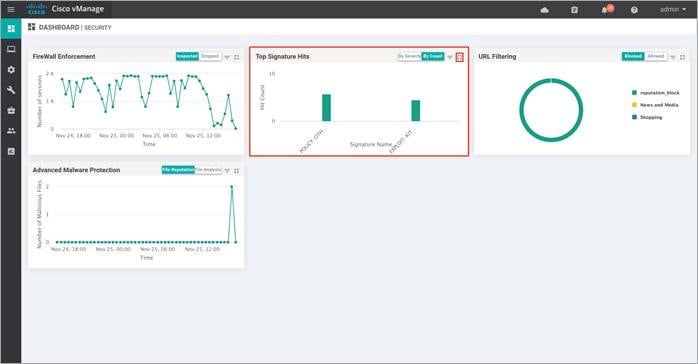
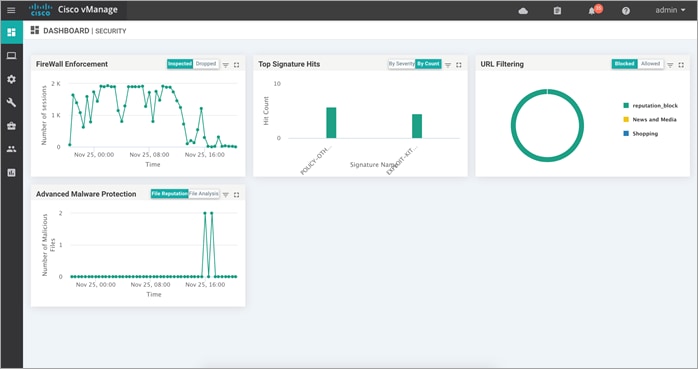
Step 1. Navigate to Dashboard > Security.
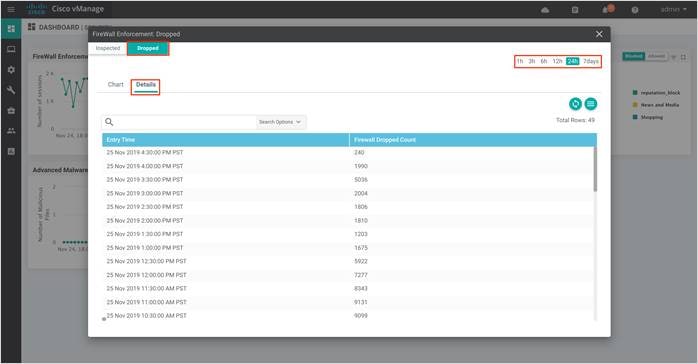
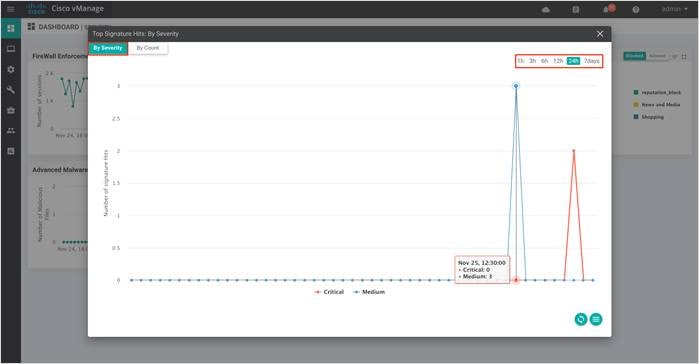
Step 2. The following screenshot of the security dashboard shows Firewall Enforcement activity and Top Signature Hits data.
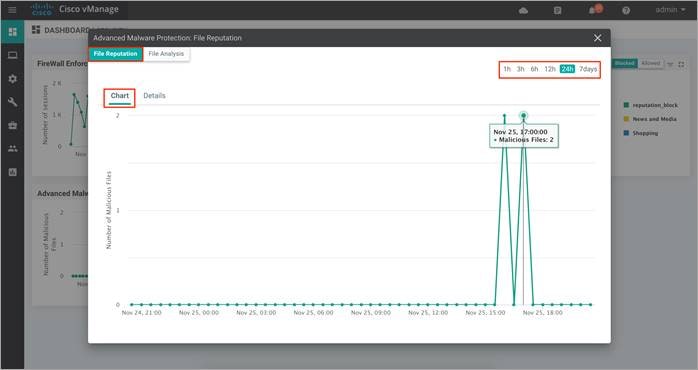
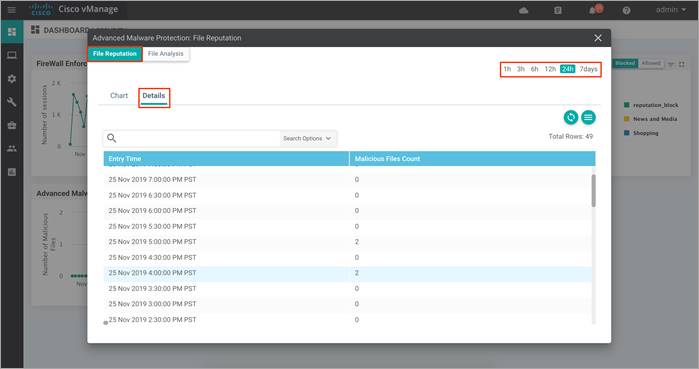
Step 3. To take a closer look into the Firewall Enforcement graph, click on the square box [] on the top right.
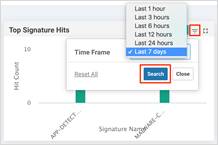
Step 4. Drilling down into the graph provides more information. Toggle between inspected and dropped packets and click on 1h, 3h, 6h, 12h, 24h (default) or 7 days to view the hourly, daily or weekly firewall statistics.
Chart displays the graphical representation of the firewall statistics for both traffic inspected and traffic dropped.
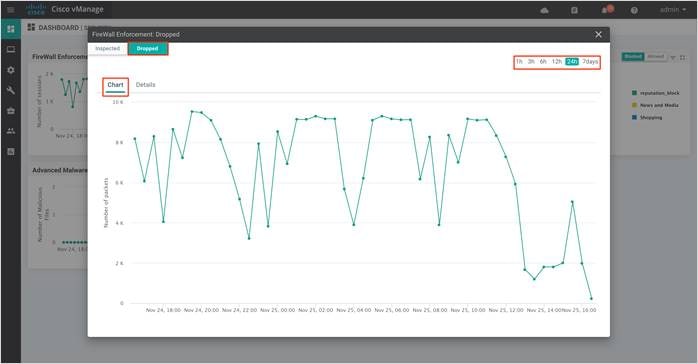
Details displays the Firewall Inspected/Dropped Count.

| Technical Tip |
| To view the details such as IP address of the packet inspected or dropped, click on the peaks of the graphical representation. |
Procedure 2. Monitor the Firewall Feature via vManage Monitor Dashboard
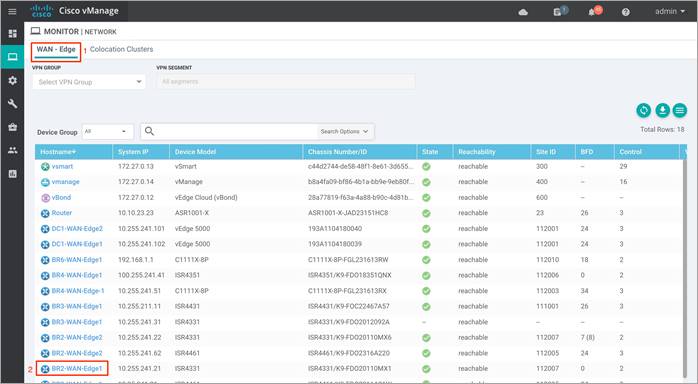
Step 1. Navigate to Network within Monitor available on the left pane and click on the WAN Edge device you wish to monitor.

Step 2. Click on a specific WAN Edge device to monitor the firewall policy.
Step 3. Click on Firewall Policy tab under Security Monitoring from the left pane. Within the dashboard, you can view statistics for all the firewall policies created.
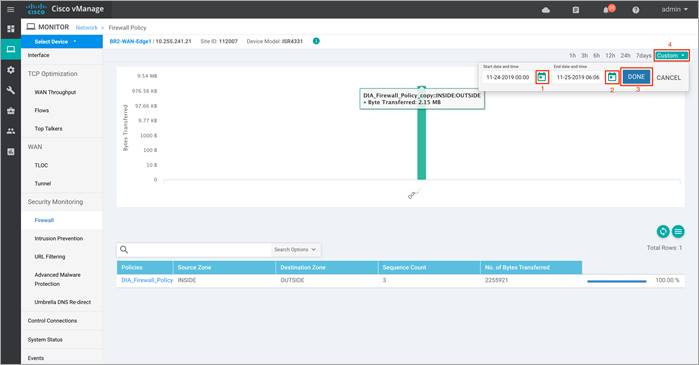
Step 4. As explained previously, the statistics within the Network > Firewall dashboard can be viewed either hourly, daily, weekly or for a customized period. To customize the time period, select Custom and then the click on the calendar icon, to input the Start date and time followed by the End Date and time. Finally, click Done.
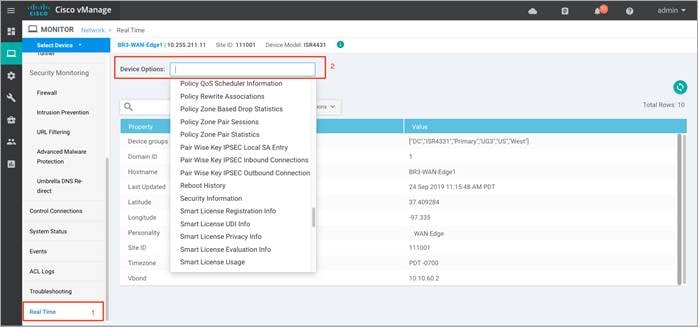
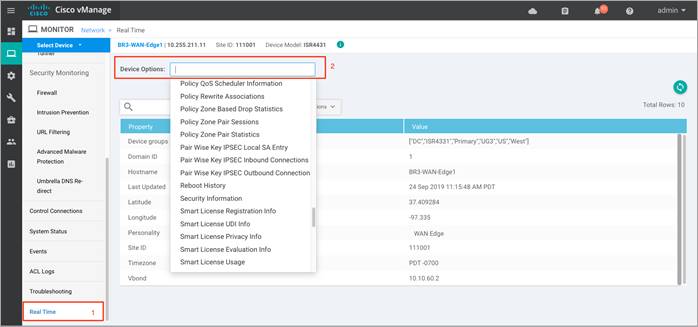
Step 5. Click on Real Time from the left pane of the monitor dashboard. Within Network > Real time, a pop-up screen will appear with Device Options. Click on the search tab to populate a list of options that can be chosen to monitor, troubleshoot and manage your device.
Step 6. To view the drop statistics, click on Policy Zone Based Drop Statistics. This output displays counters that explains reasons for packet drops. In the figure, notice drops due to the action set within the policy.
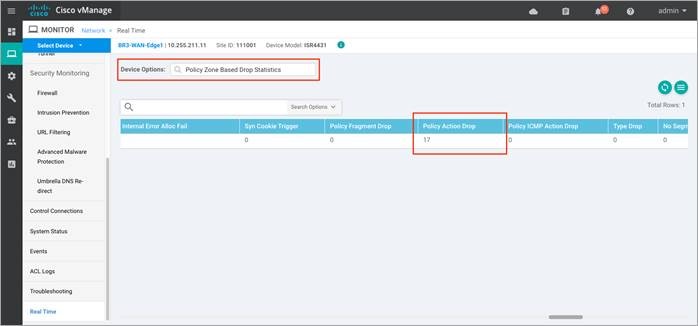
Some of the other examples of packet drops include, TCP Invalid TCP initiator when the first packet from a TCP initiator is not a SYN (Non-initial TCP segment is received without a valid session). For instance, the initial SYN packet has the ACK flag set or Syn flood due to a TCP SYN flood attack.
Refer to the ZBFW troubleshoot Guide to get an understanding on firewall drop reasons and explanations. Although the document caters to IOS-XE WAN Edge devices, the explanation for packet drops may be useful.
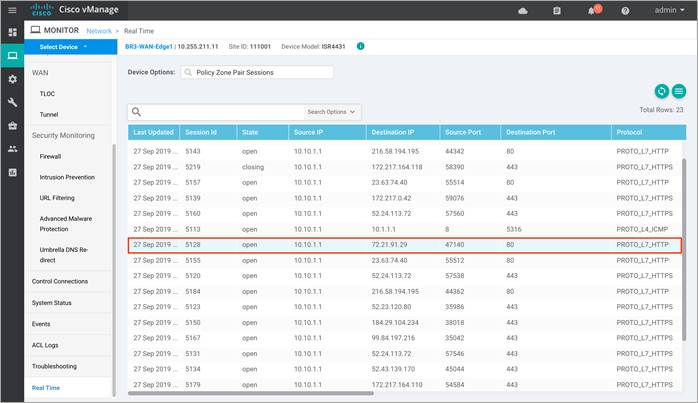
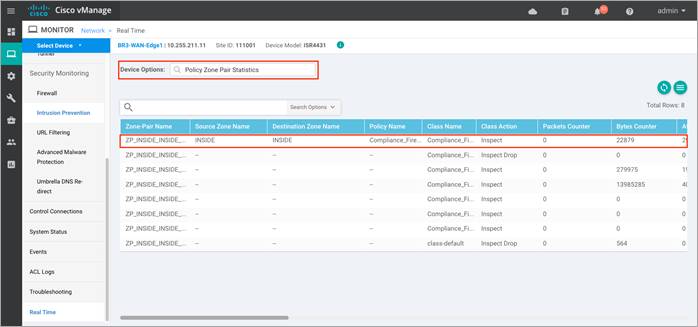
Step 7. To view the zone pair session details, click on Policy Zone Pair Sessions.
The output displays the state of the session. It can be open, opening, closing or closed. For each individual session you can also find the session update timestamp, along with the source/ destination IP, source/ destination port and source/ destination VPN for the flow. Scroll further to the right, to find the title of the zone pair for the session, the title of the class-map which will be the same as the title of the main firewall policy, followed by TCP flag, total initiator bytes and responder bytes.
Step 8. To view the zone pair statistics, click on Policy Zone Pair Statistics. Within this output, you can view the byte counters, attempted/ active/ half-open/ terminating sessions per zone-pair along with the policy title, protocol of the packet and the action applied to the packet.
In the figure, notice the action applied for two out of eight is inspect and drop.
Procedure 3. Monitor the Firewall Feature and Statistics via vManage SSH Server Dashboard
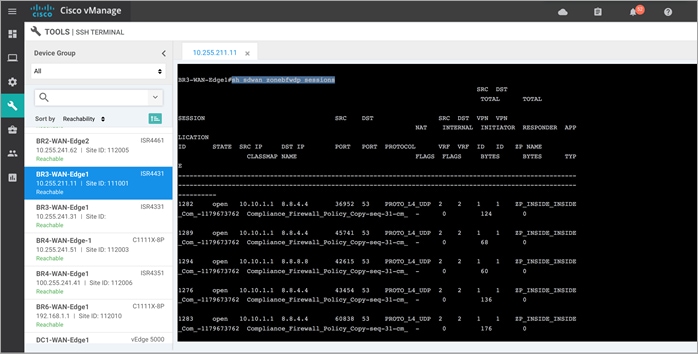
Using the vManage NMS dashboard, you can monitor the traffic flow through the policy via CLI commands.
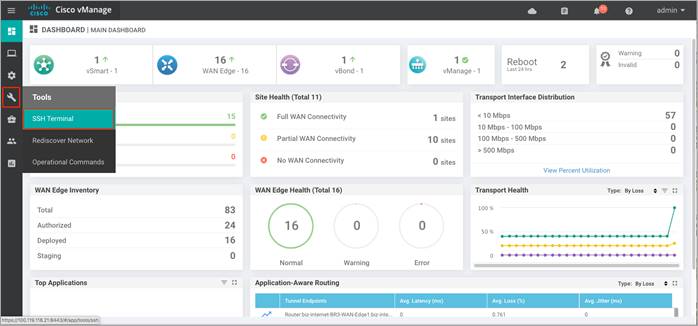
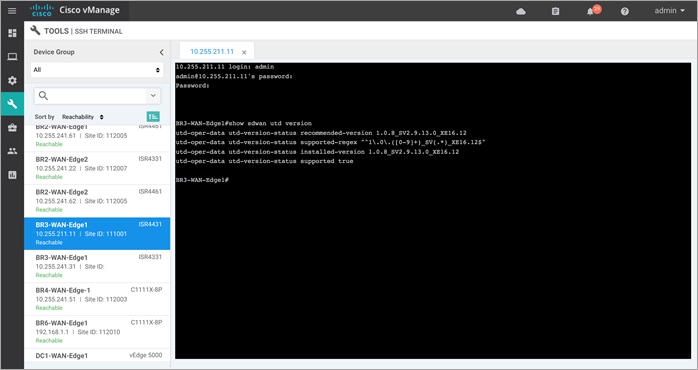
Step 9. Navigate to Tools > SSH Terminal available on the left pane.
Step 10. Select the device from the list devices, and login.

Step 11. To view the existing firewall sessions, enter the CLI command – Show sdwan zonebfwdp sessions.
Step 12. To view the firewall drop counters, enter the CLI command - Show platform hardware qfp active feature firewall drop.
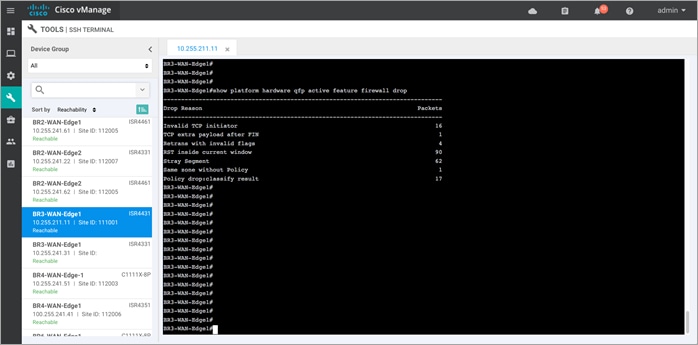
| Technical Tip |
| Clear the drop counters before troubleshooting firewall packet drop. To do so, use the command Show platform hardware qfp active feature firewall drop clear. |
Step 13. To view the overall firewall, drop statistics, enter the CLI command - Show sdwan zbfw drop-statistics.

Step 14. To view the zone-pair statistics, enter the CLI command - Show sdwan zbfw zonepair-statistics.

Outside the listed CLI commands, some of the other useful CLI commands include show log and show zone security to view error logs and zone pairs.
Process 2: Monitor IPS Feature via vManage NMS
Using the vManage NMS dashboard, you can monitor the IPS feature via vManage NMS.
Procedure 1. Monitor IPS Signature Violations via vManage Main Dashboard
Step 1. Navigate to Dashboard > Security.

Step 2. The following screenshot displays the overall security dashboard.
| Technical Tip |
| Within the IPS graphical display, drill down for hourly, daily and weekly graphical representation.
|
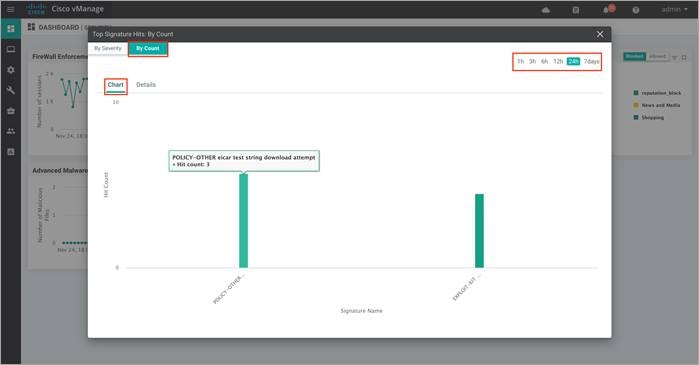
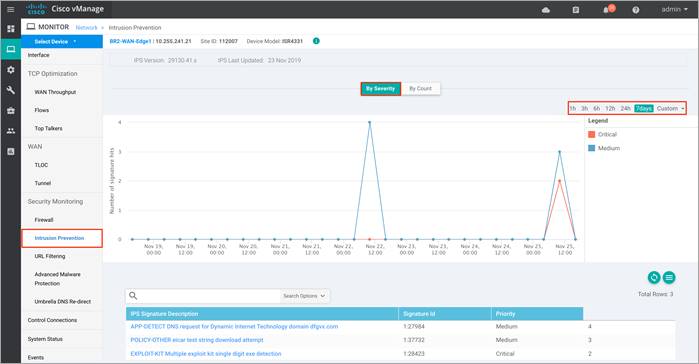
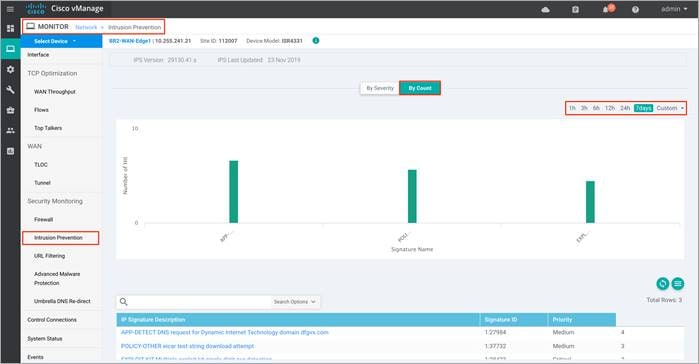
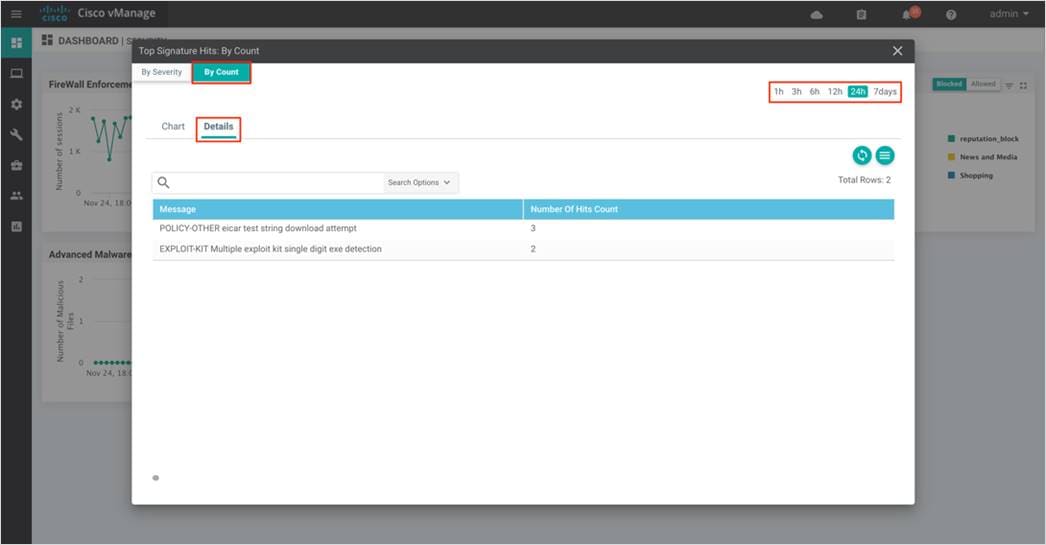
Step 3. To take a closer look into the Top Signature Hits graph, click on the square box [] on the top right.
Drilling down into firewall graph provides more information. View top signature hits By Severity or By Count for 1h, 3h, 6h, 12h, 24h (default) or 7days.
Within By Count, the Chart tab displays the graphical representation of the Top Signature Hits.
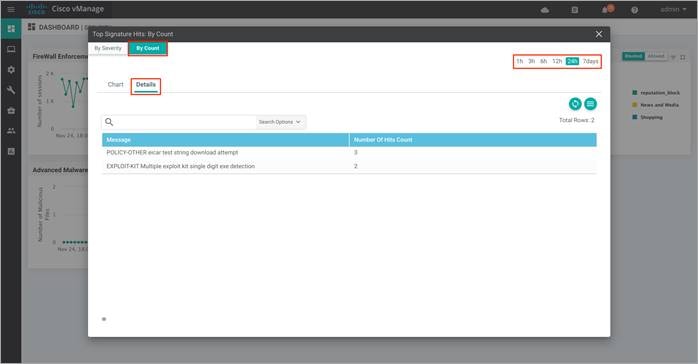
Within By Count, the Details tab displays the hit count per signature.
Within By Severity, view the number of major and minor signature hits.
Procedure 2. Monitor IPS Feature via vManage Monitor Dashboard
Step 1. Navigate to Network within Monitor available on the left pane and click on the WAN Edge device you wish to monitor.

Step 2. Click on a specific WAN Edge device to monitor the IPS policy.

Step 3. Click on Intrusion Prevention tab under Security Monitoring from the left pane. Within the dashboard, you can view top signature hits.
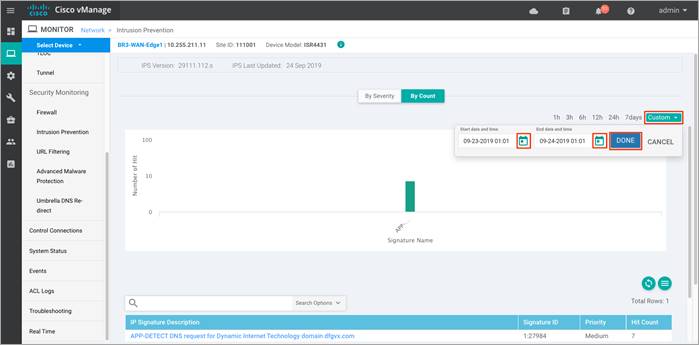
Step 4. The statistics within Network > Intrusion Prevention dashboard can be viewed either hourly, daily, weekly or for a customized period.
Step 5. To customize the time period, select Custom and click on the calendar icon to enter the Start date and time followed by End Date and time. Finally, click Done.
Step 6. Next, click on Real Time from the left pane. Within Network > Real time and pop-up screen will appear with Device Options. Click on the search tab to populate a list of options that can be chosen to monitor, troubleshoot and manage your device.
Step 7. To view the details regarding the App hosting such as the state, package name, application installed version, memory and CPU reservation, click on App Hosting Details.
Step 8. To view the status (Down / Green / Red) of the UTD engine, click Security App Engine Status. Within the output, make sure the health of the service node is green.
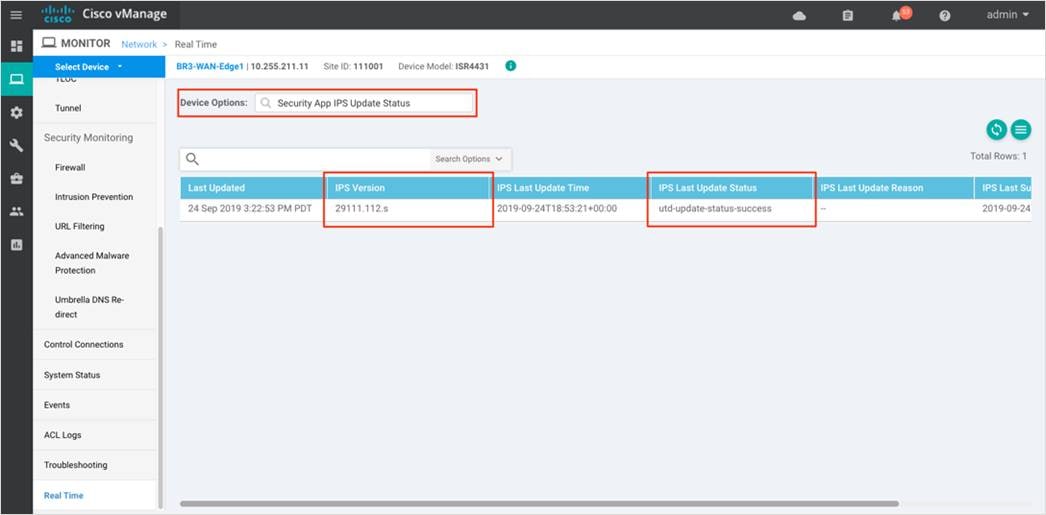
Step 9. To view the IPS signature update status, click Security App IPS Update Status. Ensure the IPS version ends with a .s (subscriber signature set) and not a .c (community signature set). A valid signature package version is in .s format.
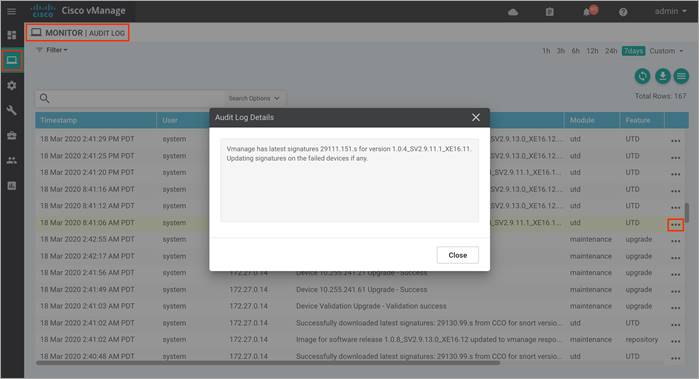
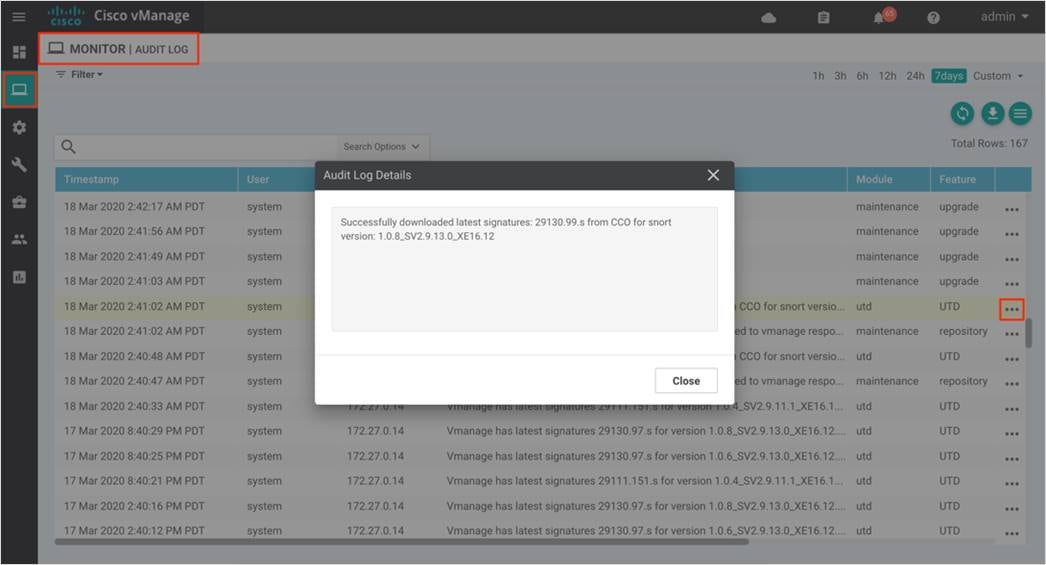
Step 10. To make sure signature download from vManage to WAN Edge device was successful, navigate to Monitor and click on Audit Log. Within the logs, click on the three dot (…) that is located on the right end of each log statement. The pop-up screen will display either of these messages,
● Successfully downloaded latest signatures: <signature.s> from CCO for snort version: <UTD version>
This indicates the download of the signature set was successful.
● vManage has latest signatures <signature.s> for version <UTD version>. Updating signatures on the failed devices if any
This indicates the WAN Edge device is already running the latest signature set and hence the signature set need no further update.
● Snort signature download failed for version:<UTD version>. Please verify the CCO credentials and vManage internet connectivity
This indicates that the automatic signature download from vManage has failed.
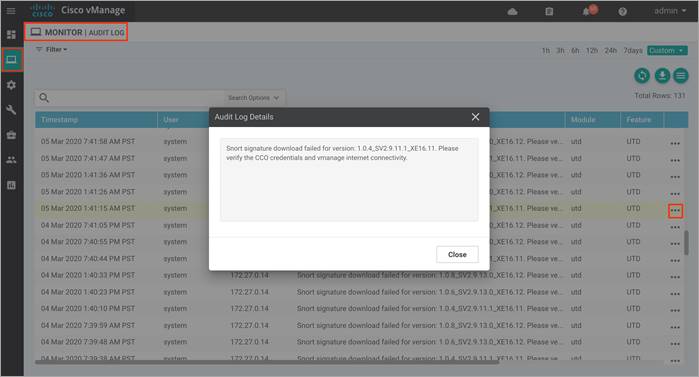
If you see this error message,
● Recheck your CCO credentials under Settings > IPS Signature Update.
● Make sure you have reachability to cloudsso2.cisco.com from both the vManage and the WAN Edge device.
● Finally, try to update the signature set manually from WAN Edge by entering UTD signature utd signature update server cisco username <CCO username> password <CCO password>.
If you do not have Internet access from your WAN Edge device, you can also manually update the signature set by downloading the signature package from https://software.cisco.com/download/home and copy the file into a FAT32 formatted USB drive. Insert the USB drive into the WAN Edge device and copy the file into flash/ bootflash. Finally, enter command utd threat-inspection signature update file flash:<signature_set.pkg>
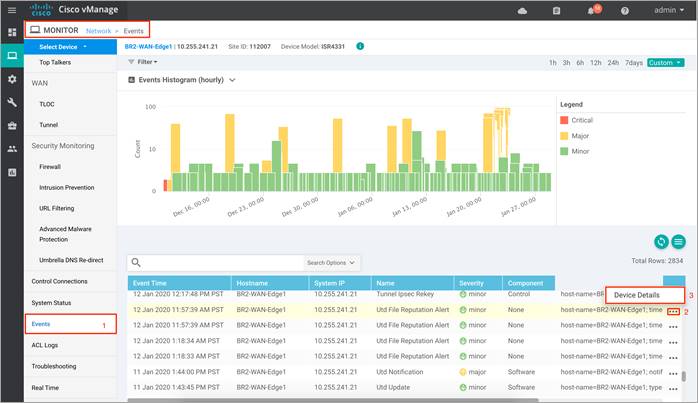
Step 11. To view the IPS signature statistics, click on Events from the left pane. Within Network > Events, click on the three dots (…) and then, click on the Device Details a pop-up window will appear.
Note: The output lists the Signature ID (SID) and Generator ID (GID) associated with the signature. If you wish to whitelist this signature, enter the signature in format within the signature whitelist tab in the format - GID: SID, for e.g. 1:37732.
Procedure 3. Monitor IPS Feature and Statistics via vManage SSH Server Dashboard
Using the vManage NMS dashboard, you can monitor the IPS feature via CLI commands.
Step 1. Navigate to Tools > SSH Terminal available on the left pane.

Step 2. Select the device from the list devices, and login.

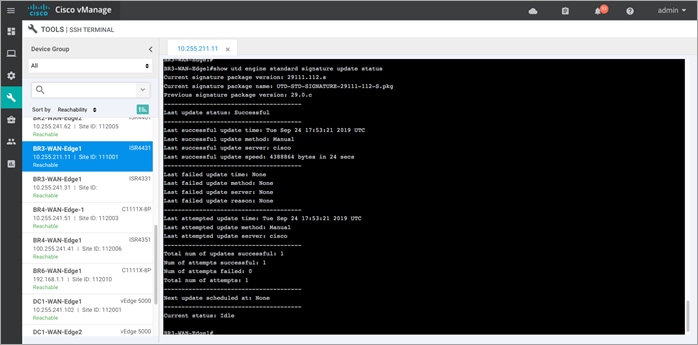
Step 3. To view the current UTD version and to test if its supported, enter the CLI command - Show sdwan utd version.
Step 4. To view the current signature package, enter the CLI command - Show utd engine standard signature update status. The command displays the number of failed/ successful signature update attempts, along with the reason for the last update.
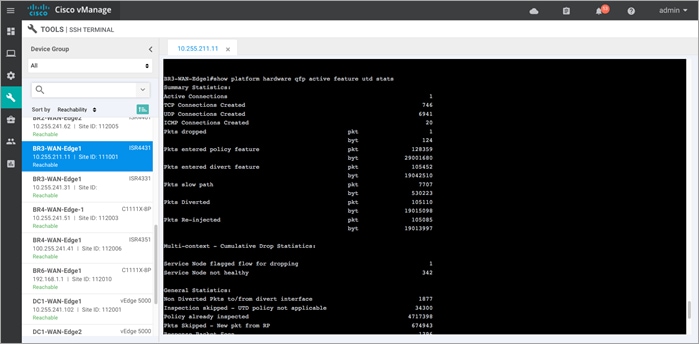
Step 5. To view the utd packet statistics, enter the following CLI command - Show platform hardware qfp active feature utd stats. The output displays the summary of all statistics that includes General Statistics, Diversion Statistics and Service Node Statistics (health).
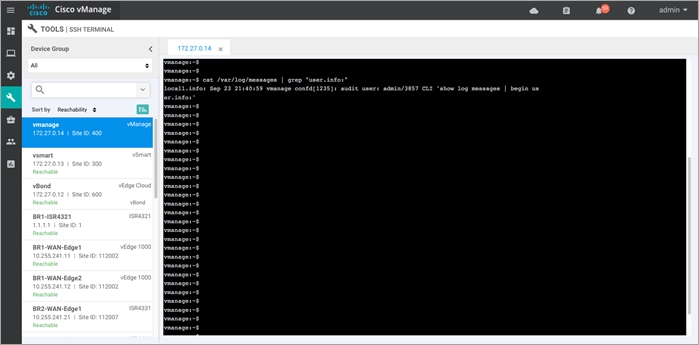
Step 6. To check for automatic signature updates on vManage, enter the following commands.
vshell /*To enter shell mode*/
cat /var/log/messages /*And followed by grep command to print a subset of the output*/
exit /*To exit shell mode*/
For example,
Outside the listed CLI commands, some of the other commands that are useful include show utd engine, show sdwan utd data plane <config/global/stats>, show sdwan utd update IPS and show log.
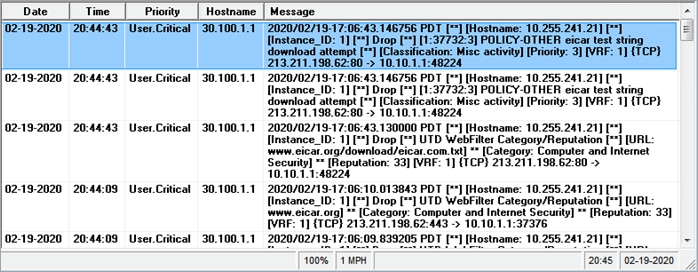
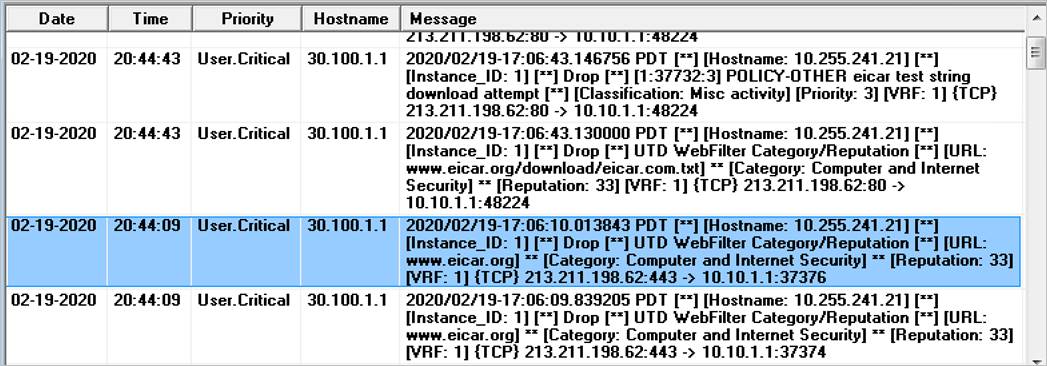
Process 3: Monitor IPS Signature Violations via Syslog Server
Step 1. Log into the syslog server and view the error logs. In the logs, you can view the device IP, VRF ID, destination IP, along with details to the signature.
Process 4: Monitor Advanced Malware Protection Feature via vManage NMS
Using the vManage NMS dashboard, you can monitor the Advanced Malware Protection (AMP) feature via vManage NMS.
Procedure 1. Monitor Advanced Malware Protection via vManage Main Dashboard
Using vManage NMS, you can monitor for clean, malicious or unknown files and information about files that are uploaded for analysis.
Step 1. Navigate to Dashboard > Security.
Step 2. The following screenshot displays the overall security dashboard.
Step 3. To drill down and view the files inspected, click on the square box [] on the top right.
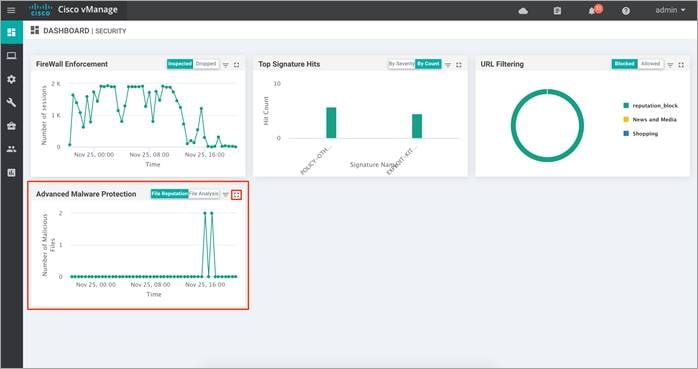
Drill down into the graph by choosing 1h, 3h, 6h, 12h, 24h (default) or 7days.
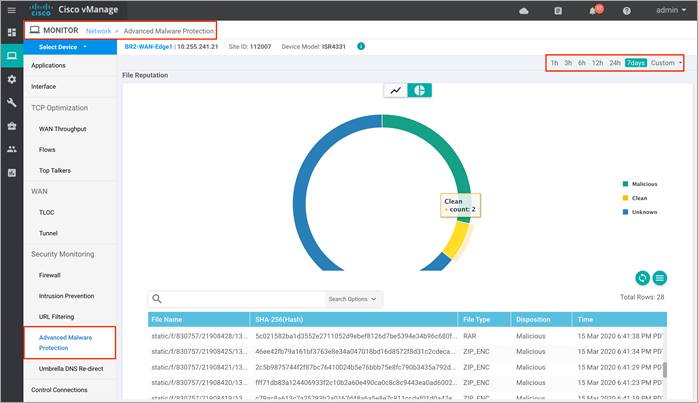
Step 4. To view the overall file reputation graph that displays the total number of files transferred and how many are malicious, clean, or unknown. This tab area also includes a table with detailed information about each file that was inspected.
Similarly, view the graph for File Analysis that displays the number of files that were uploaded to Threat Grid, and a table with detailed information about each file that was uploaded for analysis.
Procedure 2. Monitor Advanced Malware Protection Feature via vManage Monitor Dashboard
Using the vManage NMS dashboard, you can view the Advanced Malware Protection feature via the monitor dashboard contained within vManage.
Step 1. Navigate to Network within Monitor available on the left pane and click on the WAN Edge device you wish to monitor.
Step 2. Click on a specific WAN Edge device to monitor the AMP policy.
Step 3. Click on Advanced Malware Protection tab under Security Monitoring from the left pane.
The graph shows the total number of files transferred and those that are malicious, clean, or unknown.
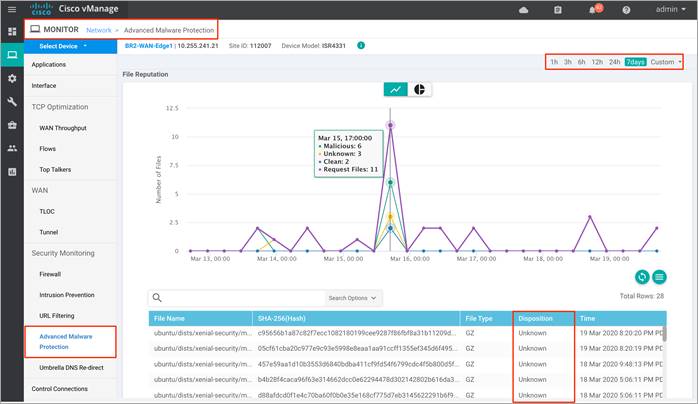
Step 4. Next, click on Real Time from the left pane. Within Network > Real time, a screen will appear with Device Options. Click on the search tab to populate a list of options that can be chosen to monitor, troubleshoot and manage your device.
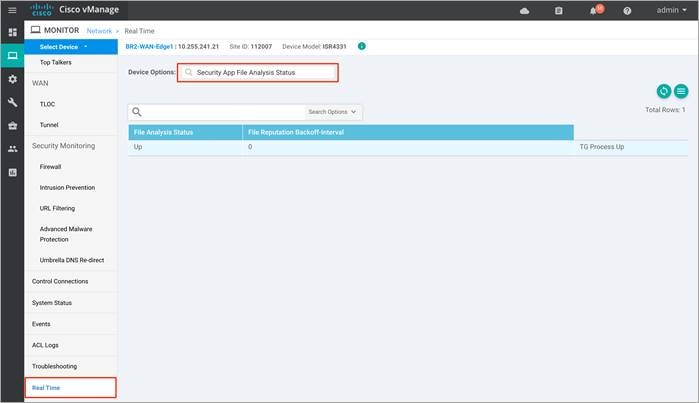
Step 5. To view the status (TG Progress Up) of the File Analysis, click on Security App File Analysis Status.
Step 6. To view the status (Connected/Connected to AMP Cloud) of File Reputation, click on Security App File Reputation Status.
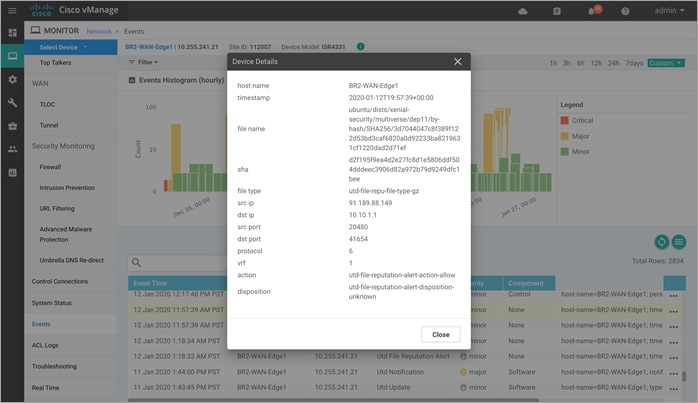
Step 7. Next, click on Events from the left pane. Within Network > Events, click on the three dots (…) and then, click on the Device Details a pop-up window will appear.
In the pop-up window, you can find the device details that include file name, timestamp, and more.
Note, you can also navigate to Events page from the Monitor tab.
Procedure 3. Monitor Advanced Malware Protection Feature and Statistics via vManage SSH Server Dashboard
Using the vManage NMS dashboard, you can monitor the AMP feature via CLI commands.
Step 1. Navigate to Tools > SSH Terminal available on the left pane.
Step 2. Select the device from the list of devices, and login.
Step 3. To view the File Reputation statistics, enter the CLI command - show utd engine standard statistics file-reputation. The output displays the number of clean, malicious and unknown files.
Step 4. To view the file reputation status, enter the CLI command - show utd engine standard status file-reputation.

Step 5. To view the UTD engine standard configuration, enter the CLI command - show utd engine standard config file-reputation.
Step 6. To display the total number of cached entries, enter the CLI command - show utd engine standard cache file-inspection.
Outside the listed CLI commands, some of the other commands that are useful include show platform hardware qfp active feature utd config and show log.
Process 5: Monitor DNS/ Web-layer Security via vManage NMS
Monitor DNS/Web-layer security using the vManage dashboard.
Procedure 1. Monitor DNS/ Web-layer Security Feature via vManage Monitor Dashboard
Using the vManage NMS dashboard, you can view the DNS/ Web-layer security feature via the monitor dashboard contained within vManage.
Step 1. Navigate to Network within Monitor available on the left pane and click on the WAN Edge device you wish to monitor.
Step 2. Click on a specific WAN Edge device to monitor the DNS Security policy.
Step 3. Click on the Umbrella DNS Re-direct tab under Security Monitoring from the left pane for the number of packets redirected to umbrella.
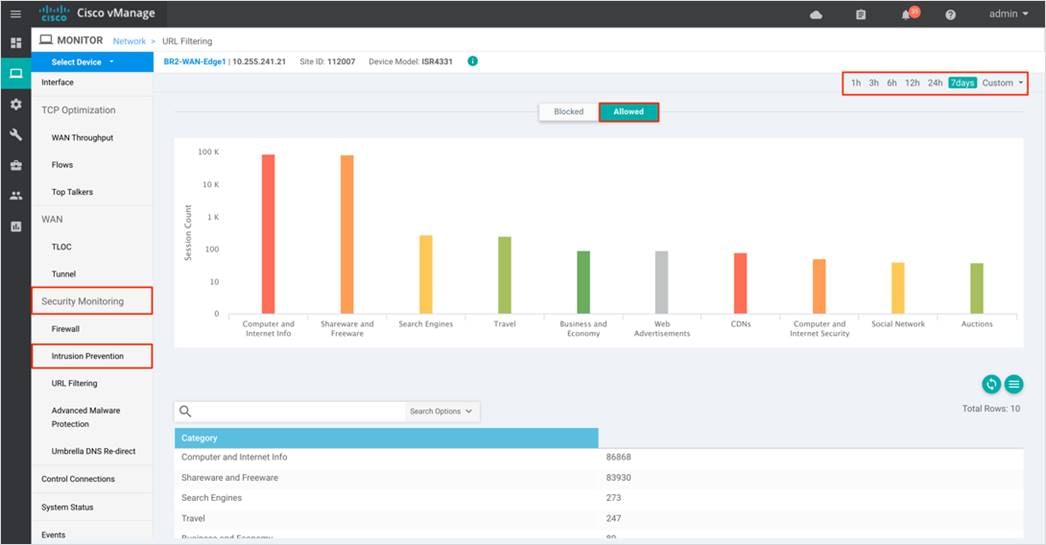
Click on Local Domain Bypass to view packets that bypassed umbrella or the configured remote DNS server.
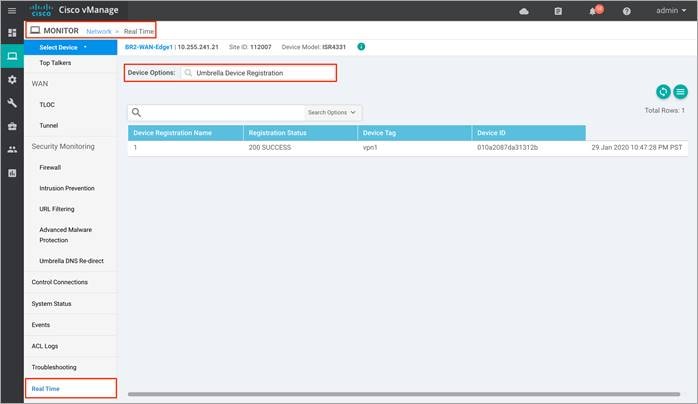
Step 4. Next, click on Real Time from the left pane. Within Network > Real time and pop-up screen will appear with Device Options. Click on the search tab to populate a list of options that can be chosen to monitor, troubleshoot and manage your device.

Step 5. For the Cisco Umbrella Connector overview, click on Umbrella overview / Umbrella Device Registration.
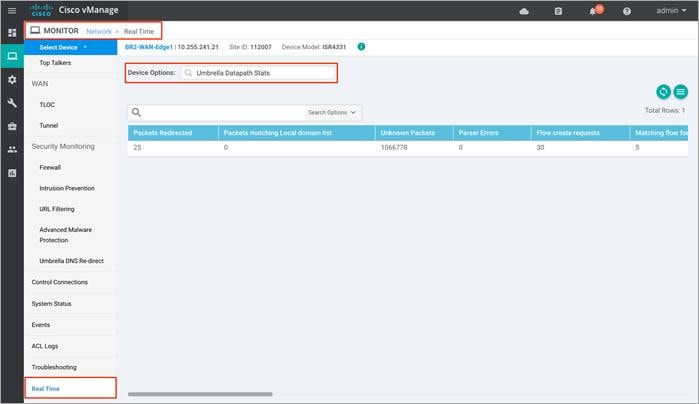
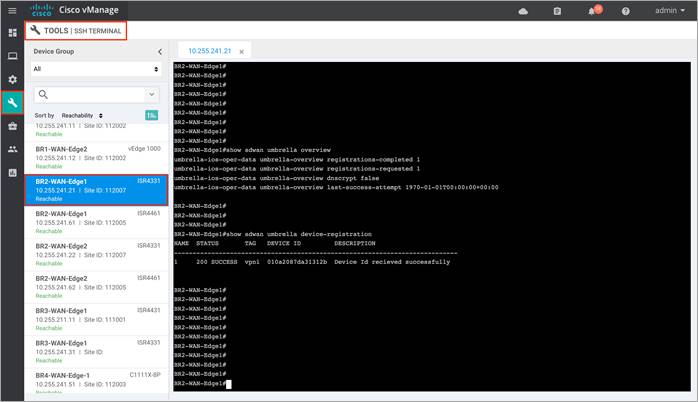
Step 6. To view the packet statistics, click Umbrella Datapath Statistics.
Procedure 2. Monitor DNS/ Web-layer Security Feature and Statistics via vManage SSH Server Dashboard
Using the vManage NMS dashboard, you can monitor the DNS/ Web-layer Security feature via CLI commands.
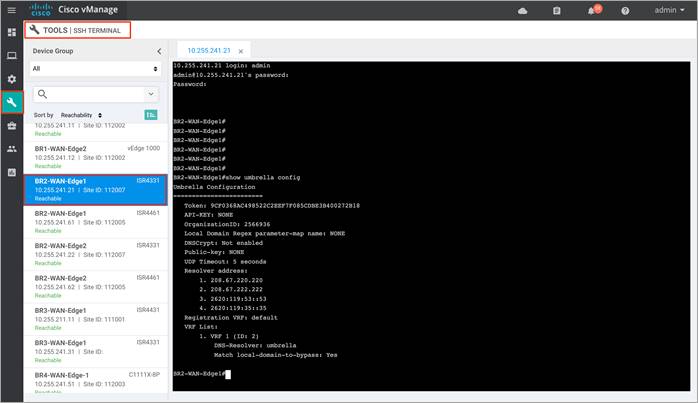
Step 1. Navigate to Tools > SSH Terminal available on the left pane.
Step 2. Select the device from the list devices, and log in.
Step 3. Enter the following CLI command to verify the Cisco Umbrella Connector configuration.
● show umbrella <config/deviceid/ dnscypt>
● show umbrella <device-registration/ dp-stats/ overview>
Output of show umbrella config:

Output of show umbrella deviceid <detailed>:
| Technical Tip |
| Note, communication for device registration to the Cisco Umbrella server is via HTTPS. This requires a DigiCert root certificate which is auto installed on the router by default. |
Output of show sdwan umbrella overview/ show sdwan umbrella device-registration:
Output of show sdwan umbrella dp-stats:

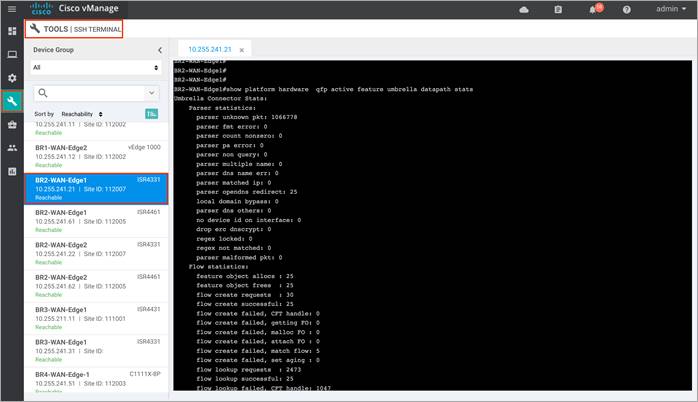
Step 4. For Umbrella connector statistics, enter the CLI command - show platform hardware qfp active feature umbrella datapath stats.
This guide is new and is not updated from a previous version.
Appendix B: Hardware and Software Used for Validation
This guide was validated using the following hardware and software.
Table 4. System feature template settings
| Functional Area |
Product |
Software version |
| Cloud |
Cisco vManage NMS |
19.2.099 |
| Cloud |
Cisco vBond Controller |
19.2.099 |
| Cloud |
Cisco vSmart Controller |
19.2.099 |
| Data center |
Cisco vEdge 5000 Series Routers |
19.2.099 |
| Branch office |
Cisco ISR 4431 |
16.12.1e |
| Branch office |
Cisco ISR 4331 |
16.12.1e |
| Branch office |
Cisco ISR c1111x-8P |
16.12.1e |
Appendix C: Cisco WAN Edge Configuration Summary (Templates)
This section includes the security policy feature template, along with an example device template and CLI configuration specific to the Cisco WAN Edge router ISR4331, deployed within this deployment guide. To deploy other feature/device templates to establish SD-WAN overlay network, please refer to the SD-WAN End-to-End Deployment Guide.
Within this section, the configured lists, the main security policy template and its container template is listed.
Security Policy feature template
Devices: All devices except vManage and vSmart
Template: Basic Information/Security
Template Name: DCA_Security_Policy
Description: Security Policy Template
The following lists are configured for the security policy,
Table 5. Zone Settings
| Section |
List Type |
Value |
| List |
Zones |
INSIDE = VPN 1 OUTSIDE = VPN 0 |
|
|
Data Prefix |
Client_Network = 10.10.0.0/16 |
The configured lists are used in the security policy,
Table 6. Security Policy Template Settings
| Policy sub-section |
Section |
Condition/Parameter |
Type |
Value |
| Enterprise Firewall with Application Awareness
|
Target Zone-Pair |
Source Zone |
Drop-down |
INSIDE |
|
|
Destination Zone |
Drop-down |
OUTSIDE |
|
| Name |
|
Entry tab |
DCA_Firewall_Policy |
|
| Description |
|
Entry tab |
Enterprise Firewall with App Aware for DCA Use Case |
|
| Match (Rule 1) |
Source Data Prefix List |
Variable |
Client_Network |
|
| Application/ Application - Family |
Variable |
SAAS_Application |
||
| Protocol |
Drop-down |
TCP |
||
| Actions (Rule 1) |
Inspect |
Radio Button |
Enable |
|
| Match (Rule 2) |
Protocol |
Drop-down |
UDP |
|
| Actions (Rule 2) |
Inspect |
Radio Button |
Enabled |
|
| Intrusion Prevention System |
Target |
VPNs |
Entry tab |
1 |
| Policy Name |
|
Entry tab |
DCA_IPS_Policy |
|
| Policy Description |
|
Entry tab |
IPS policy to protect the network from malware. |
|
| Signature Set |
|
Drop down |
Balanced |
|
| Inspection Mode |
|
Drop down |
Protection |
|
| Advanced |
Alerts Log Level |
Drop down |
Error |
|
| AMP |
Policy Name |
|
Entry tab |
DCA_AMP_Policy |
| Custom VPN Configuration |
Target VPN |
Entry tab |
1 |
|
| File Reputation |
AMP Cloud Region |
Drop-down |
NAM |
|
| Alert Log Level |
Drop-down |
Warning |
||
| File Analysis |
TG Cloud Region |
Drop down |
NAM |
|
| Security Policy Name |
Threat Grid API Key (NAM) |
Entry tab |
xxxxxxxxxxxxxxxx |
|
| Security Policy Description |
File Types List |
Drop-down |
All |
|
| DNS/ Web-layer Security |
Policy Name |
|
Entry tab |
DCA_DNS_Policy |
| Umbrella Registration Status |
Configured |
Entry tab |
Registration Token |
|
| Custom VPN Configuration |
||||
|
|
VPNs |
Entry tab |
1 |
|
| File Analysis |
DNs Server IP |
Radio Button |
Umbrella Default |
|
| Security Policy Name |
Local Domain Bypass |
Slide |
disabled |
|
| Policy Summary |
Security Policy Name |
|
Entry tab |
DCA_Security_Policy |
| Security Policy Description |
|
Entry tab |
Security Policy Specific to DCA Use Case |
|
| Additional Policy Settings (Firewall) |
High Speed Logging – VPN |
Entry tab |
0 |
|
| High Speed Logging – Server IP |
Entry tab |
10.2.2.2 |
||
| High Speed Logging – Port |
Default |
2055 |
||
| Additional Policy Settings (IPS/ AMP/ URL)
|
Audit Trail |
slide |
On |
|
| External Syslog Server – VPN |
Entry tab |
0 |
||
| External syslog Server – Server IP |
|
10.2.2.2 |
||
| Failure Mode |
Drop-down |
Open |
||
Container Profile feature template
Devices: All devices except vManage and vSmart
Template: Basic Information/Security
Template Name: Security_App_Hosting
Description: Security Template
| Section |
Value |
| NAT |
On |
| Resource Profile |
Default/ High |
This section lists the device template deployed, along with CLI configuration on ISR4331 router.
Device Model: ISR4331
Template Name: Branch_B_Hybrid_Transport_Single_LAN_Int
Description: Branch B with OSPF on the LAN side single port with MPLS and Internet transport
Table 7. Branch 112002 Device Template: Branch_A_INET_TLOC_SubInt_OSPF
| Template Type |
Template Sub-Type |
Template Name |
| System |
|
System_Template |
| Logging |
Logging_Template |
|
| NTP |
NTP_Template |
|
| BFD |
|
BFD_Template |
| OMP |
|
OMP_Template |
| Security |
|
Security_Template |
| VPN0 |
|
BR_VPN0_Single_Transport |
| BGP |
BR_VPN0_BGP |
|
| VPN Interface |
BR_INET_INT |
|
| BR_MPLS_INT |
||
| VPN512 |
|
VPN512_Template |
| VPN Interface |
VPN512_Interface |
|
| VPN1 |
|
BR_VPN1_BASE |
| OSPF |
BR_VPN1_OSPF |
|
| VPN Interface |
BR_LAN_VPN1_INT1 |
|
| Security Policy |
|
DCA_Security_Policy |
| Container Profile |
Security_App_Hosting |
The following section lists out an example branch configuration.
Security Policy for DCA
policy
intrusion-prevention DCA_IPS_Policy
security-level security
inspection-mode protection
logging host 10.2.2.2 vpn 0
log-level warning
target-vpns 1
!
advanced-malware-protection DCA_AMP_Policy
file-reputation-cloud-server cloud-isr-asn.amp.cisco.com
file-reputation-est-server cloud-isr-est.amp.cisco.com
file-reputation-alert warning
file-analysis-cloud-server isr.api.threatgrid.com
file-analysis-file-types pdf ms-exe new-office rtf mdb mscab msole2 wri xlw flv swf
file-analysis-alert warning
logging host 10.2.2.2 vpn 0
target-vpns 1
!
zone-based-policy DCA_Firewall_Policy_1
sequence 1
match
protocol 17
protocol-name udp
!
action inspect
!
!
sequence 11
match
app-list SAAS_Application
source-data-prefix-list Client_Network
protocol 6
protocol-name tcp
!
action inspect
!
!
default-action drop
!
zone INSIDE
vpn 1
!
zone OUTSIDE
vpn 0
!
zone-pair ZP_INSIDE_OUTSIDE_DCA_-240664430
source-zone INSIDE
destination-zone OUTSIDE
zone-policy DCA_Firewall_Policy_1
!
high-speed-logging
server-ip 10.2.2.2
port 2055
vrf 0
!
lists
data-prefix-list Client_Network
ip-prefix 10.10.0.0/16
!
local-app-list SAAS_Application
app gmail
app dropbox
app ms-office-365
!
!
zone-to-nozone-internet deny
failure-mode open
!
exit
!
security
umbrella
no dnscrypt
!
exit
!
vpn 1
dns-redirect umbrella match-local-domain-to-bypass
Branch 122003: BR2-WAN-Edge1: Branch_B_Hybrid_Transport_Single_LAN_Int
viptela-system:system
device-model vedge-ISR-4331
host-name BR2-WAN-Edge1
gps-location latitude 33.4484
gps-location longitude -112.074
device-groups BRANCH Primary UG5 US West v1000
system-ip 10.255.241.21
overlay-id 1
site-id 112007
port-offset 1
control-session-pps 300
admin-tech-on-failure
sp-organization-name "ENB-Solutions - 21615"
organization-name "ENB-Solutions - 21615"
port-hop
track-transport
track-default-gateway
console-baud-rate 115200
vbond 10.10.60.2 port 12346
logging
disk
enable
!
!
!
bfd color mpls
hello-interval 1000
no pmtu-discovery
multiplier 7
!
bfd color biz-internet
hello-interval 1000
no pmtu-discovery
multiplier 7
!
bfd app-route multiplier 6
bfd app-route poll-interval 120000
omp
no shutdown
graceful-restart
!
security
ipsec
rekey 86400
replay-window 4096
authentication-type sha1-hmac ah-sha1-hmac
!
!
no service pad
no service tcp-small-servers
no service udp-small-servers
hostname BR2-WAN-Edge1
username admin privilege 15 secret 9 $9$3VEF3VAI3lMM3E$awMmxogwHvRdxoHA5u1utUOAmKPBUvUbkD4PnwNWmWk
vrf definition 1
description Service VPN
rd 1:1
address-family ipv4
exit-address-family
!
address-family ipv6
exit-address-family
!
!
vrf definition 65529
rd 65529:1
address-family ipv4
exit-address-family
!
!
vrf definition Mgmt-intf
description Management VPN
rd 1:512
address-family ipv4
exit-address-family
!
address-family ipv6
exit-address-family
!
!
no ip finger
no ip rcmd rcp-enable
no ip rcmd rsh-enable
no ip dhcp use class
ip name-server 8.8.4.4 8.8.8.8
ip route 0.0.0.0 0.0.0.0 30.100.1.2 1
ip access-list extended DCA_Firewall_Policy_1-seq-11-acl_
11 permit object-group DCA_Firewall_Policy_1-seq-11-service-og_ object-group Client_Network any
!
ip access-list extended utd-nat-acl
10 permit ip any any
!
no ip http ctc authentication
no ip igmp ssm-map query dns
ip nat inside source list nat-dia-vpn-hop-access-list interface GigabitEthernet0/0/1 overload
ip nat inside source list utd-nat-acl interface GigabitEthernet0/0/1 overload
ip nat translation tcp-timeout 3600
ip nat translation udp-timeout 60
ip nat route vrf 65529 0.0.0.0 0.0.0.0 global
class-map type inspect match-any DCA_Firewall_Policy_1-s1-l4-cm_
match protocol udp
!
class-map type inspect match-any DCA_Firewall_Policy_1-s11-l4-cm_
match protocol tcp
!
class-map type inspect match-all DCA_Firewall_Policy_1-seq-1-cm_
match class-map DCA_Firewall_Policy_1-s1-l4-cm_
!
class-map type inspect match-all DCA_Firewall_Policy_1-seq-11-cm_
match access-group name DCA_Firewall_Policy_1-seq-11-acl_
match class-map DCA_Firewall_Policy_1-s11-l4-cm_
!
class-map match-any SAAS_Application-cm0_
match protocol dropbox
match protocol gmail
match protocol ms-office-365
!
policy-map type inspect DCA_Firewall_Policy_1
class DCA_Firewall_Policy_1-seq-1-cm_
inspect
!
class DCA_Firewall_Policy_1-seq-11-cm_
inspect
service-policy avc SAAS_Application-pm_
!
class class-default
drop
!
!
policy-map type inspect avc SAAS_Application-pm_
class SAAS_Application-cm0_
deny
!
!
interface GigabitEthernet0
description Management Interface
no shutdown
arp timeout 1200
vrf forwarding Mgmt-intf
ip address 100.119.118.8 255.255.255.0
ip redirects
ip mtu 1500
mtu 1500
negotiation auto
exit
interface GigabitEthernet0/0/0
description Service side Interface
no shutdown
arp timeout 1200
vrf forwarding 1
ip address 10.20.16.2 255.255.255.0
ip redirects
ip mtu 1500
ip ospf 1 area 0
ip ospf authentication message-digest
ip ospf network point-to-point
ip ospf cost 1
ip ospf dead-interval 40
ip ospf hello-interval 10
ip ospf message-digest-key 22 md5 0 c1sco123
ip ospf priority 1
ip ospf retransmit-interval 5
mtu 1500
negotiation auto
exit
interface GigabitEthernet0/0/1
description INET Interface
no shutdown
arp timeout 1200
ip address 30.100.1.1 255.255.255.252
ip redirects
ip tcp adjust-mss 1350
ip mtu 1496
ip nat outside
mtu 1500
negotiation auto
exit
interface GigabitEthernet0/0/2
description MPLS Interface
no shutdown
arp timeout 1200
ip address 20.20.1.1 255.255.255.252
ip redirects
ip tcp adjust-mss 1350
ip mtu 1500
mtu 1500
negotiation auto
exit
interface Tunnel1
no shutdown
ip unnumbered GigabitEthernet0/0/1
no ip redirects
ipv6 unnumbered GigabitEthernet0/0/1
no ipv6 redirects
tunnel source GigabitEthernet0/0/1
tunnel mode sdwan
exit
interface Tunnel2
no shutdown
ip unnumbered GigabitEthernet0/0/2
no ip redirects
ipv6 unnumbered GigabitEthernet0/0/2
no ipv6 redirects
tunnel source GigabitEthernet0/0/2
tunnel mode sdwan
exit
interface VirtualPortGroup0
no shutdown
vrf forwarding 65529
ip address 192.168.1.1 255.255.255.252
exit
interface VirtualPortGroup1
no shutdown
ip address 192.0.2.1 255.255.255.252
exit
object-group network Client_Network
10.10.0.0 255.255.0.0
!
object-group service DCA_Firewall_Policy_1-seq-11-service-og_
ip
!
clock summer-time PDT recurring
clock timezone PDT -8 0
logging persistent size 104857600 filesize 10485760
logging buffered 512000
no logging rate-limit
logging persistent
aaa authentication login default local
aaa authorization exec default local
aaa session-id common
parameter-map type inspect-global
alert on
log dropped-packets
log flow-export v9 udp destination 10.2.2.2 2055 vrf 0
multi-tenancy
vpn zone security
!
parameter-map type umbrella global
token 9CF0368AC498522C2EEF7F085CDBE3B400272B18
no dnscrypt
vrf 1
dns-resolver umbrella
match-local-domain-to-bypass
!
!
zone security INSIDE
vpn 1
!
zone security OUTSIDE
vpn 0
!
zone-pair security ZP_INSIDE_OUTSIDE_DCA_-240664430 source INSIDE destination OUTSIDE
service-policy type inspect DCA_Firewall_Policy_1
!
no crypto ikev2 diagnose error
no crypto isakmp diagnose error
router bgp 65201
bgp log-neighbor-changes
distance bgp 20 200 20
maximum-paths eibgp 2
neighbor 20.20.1.2 remote-as 70
neighbor 20.20.1.2 description MPLS Service Provider
neighbor 20.20.1.2 ebgp-multihop 1
neighbor 20.20.1.2 maximum-prefix 2147483647 100
neighbor 20.20.1.2 password 0 c1sco123
neighbor 20.20.1.2 send-community both
neighbor 20.20.1.2 timers 3 9
address-family ipv4 unicast
network 20.20.1.0 mask 255.255.255.252
exit-address-family
!
timers bgp 60 180
!
router ospf 1 vrf 1
area 0 range 10.20.16.0 255.255.255.0 advertise
auto-cost reference-bandwidth 100000
timers throttle spf 200 1000 10000
router-id 10.20.16.16
compatible rfc1583
default-information originate
distance ospf external 110
distance ospf inter-area 110
distance ospf intra-area 110
redistribute omp subnets
!
line con 0
login authentication default
speed 115200
stopbits 1
!
iox
app-hosting appid utd
app-resource package-profile cloud-medium
app-vnic gateway0 virtualportgroup 0 guest-interface 0
guest-ipaddress 192.168.1.2 netmask 255.255.255.252
!
app-vnic gateway1 virtualportgroup 1 guest-interface 1
guest-ipaddress 192.0.2.2 netmask 255.255.255.252
!
start
!
utd multi-tenancy
utd engine standard multi-tenancy
threat-inspection profile DCA_IPS_Policy
threat protection
policy security
logging level warning
!
utd global
logging host 10.2.2.2
file-reputation
cloud-server cloud-isr-asn.amp.cisco.com
est-server cloud-isr-est.amp.cisco.com
!
file-analysis
cloud-server isr.api.threatgrid.com
apikey 0 rhl68q1udvb5mamp3dhde3tlov
!
!
file-analysis profile DCA_AMP_Policy-fa-profile
file-types
ms-exe
new-office
rtf
mdb
mscab
msole2
wri
xlw
flv
swf
!
alert level warning
!
file-reputation profile DCA_AMP_Policy-fr-profile
alert level warning
!
file-inspection profile DCA_AMP_Policy-fi-profile
analysis profile DCA_AMP_Policy-fa-profile
reputation profile DCA_AMP_Policy-fr-profile
!
policy utd-policy-vrf-1
all-interfaces
file-inspection profile DCA_AMP_Policy-fi-profile
vrf 1
threat-inspection profile DCA_IPS_Policy
exit
!
sdwan
interface GigabitEthernet0/0/1
tunnel-interface
encapsulation ipsec preference 100 weight 1
no border
color biz-internet
no last-resort-circuit
no low-bandwidth-link
control-connections
no vbond-as-stun-server
vmanage-connection-preference 5
port-hop
carrier default
nat-refresh-interval 5
hello-interval 1000
hello-tolerance 12
allow-service all
allow-service bgp
no allow-service dhcp
allow-service dns
allow-service icmp
no allow-service sshd
no allow-service netconf
allow-service ntp
no allow-service ospf
no allow-service stun
no allow-service snmp
exit
exit
interface GigabitEthernet0/0/2
tunnel-interface
encapsulation ipsec preference 0 weight 1
no border
color mpls restrict
no last-resort-circuit
no low-bandwidth-link
control-connections
no vbond-as-stun-server
vmanage-connection-preference 5
port-hop
carrier default
nat-refresh-interval 5
hello-interval 1000
hello-tolerance 12
allow-service all
allow-service bgp
no allow-service dhcp
allow-service dns
allow-service icmp
no allow-service sshd
no allow-service netconf
allow-service ntp
no allow-service ospf
no allow-service stun
no allow-service snmp
exit
exit
interface VirtualPortGroup0
access-list vpg-log-server-acl in
exit
omp
no shutdown
send-path-limit 16
ecmp-limit 16
graceful-restart
no as-dot-notation
timers
holdtime 60
advertisement-interval 1
graceful-restart-timer 43200
eor-timer 300
exit
address-family ipv4 vrf 1
advertise ospf external
advertise connected
advertise static
!
!
!
policy
no app-visibility
no flow-visibility
no implicit-acl-logging
log-frequency 1000
lists
data-prefix-list Client_Network
ip-prefix 10.10.0.0/16
!
!
access-list vpg-log-server-acl
sequence 5
match
destination-ip 10.2.2.2/32
protocol 17
!
action accept
count cipslog-vpn-0
set
local-vpn 0
!
!
!
default-action accept
!
!
!
!
Appendix D: Glossary
IPS Intrusion Prevention System
VPN Virtual Private Network
NAT Network Address Translation
LAN Local Area Network
WAN Wide Area Network
IDS Intrusion Detection System
AMP Advanced Malware Protection
DNS Domain Name Server
Feedback
For comments and suggestions about this guide and related guides, join the discussion on Cisco Community at https://cs.co/en-cvds.