- Overview
- Getting Started
- Monitoring and Analyzing Traffic
- Capturing and Decoding Packets
- Performing User and System Administration
- Understanding NAM Deployment
- Customizing Cisco Prime NAM
- Understanding Prime NAM Traffic Sources
- Configuring NAM Security
- Understanding Prime NAM Behavior Reference
- GUI Field Descriptions
- Troubleshooting Network and NAM Issues
Cisco Prime Network Analysis Module User Guide, 6.4(1)
Bias-Free Language
The documentation set for this product strives to use bias-free language. For the purposes of this documentation set, bias-free is defined as language that does not imply discrimination based on age, disability, gender, racial identity, ethnic identity, sexual orientation, socioeconomic status, and intersectionality. Exceptions may be present in the documentation due to language that is hardcoded in the user interfaces of the product software, language used based on RFP documentation, or language that is used by a referenced third-party product. Learn more about how Cisco is using Inclusive Language.
- Updated:
- February 2, 2015
Chapter: Customizing Cisco Prime NAM
- Advanced Configuration Overview
- Setting Up Traffic Configurations
- Setting Up Alarms and Alarm Thresholds
- Configuring Alarm Actions
- Viewing Alarm Actions
- Defining Thresholds
- Setting Host Thresholds
- Setting Conversation Thresholds
- Setting Application Thresholds
- Setting Response Time Thresholds
- Setting DSCP Thresholds
- Setting RTP Stream Thresholds
- Setting Voice Signaling Thresholds
- Setting NetFlow Interface Thresholds
- Setting Video Stream Thresholds
- Setting MDI Stream Thresholds
- Setting Transaction Analysis Thresholds
- Editing or Deleting an Alarm Threshold
Customizing Cisco Prime NAM
This chapter provides set up details for advanced tools and customization. You can use these tools to take your network monitoring to another level. It provides information about functions that will begin automatically, optional tasks, and other setup tasks you will need to perform for advanced feature configuration.
This chapter contains the following sections:
- Advanced Configuration Overview
- Setting Up Traffic Configurations
- Setting Up Alarms and Alarm Thresholds
- Setting Up Data Export
- Accessing Device Interface and Health Details
- Configuring Network Parameters
- Configuring Application Classification
- Setting Up Prime NAM Monitoring
For information about how to install the product, configure it, and log in, see the installation guide for your specific Cisco NAM platform.
Advanced Configuration Overview
Table 7-1 leads you through the advanced configuration steps you can follow for Prime NAM. See the description to understand why or when to perform these tasks.
If you want to monitor an extended level of your managed device’s data (health and interface information), you can set up your managed device using Cisco NAM. If you do not set up this feature, your data collection is limited. Depending on your NAM platform, managed device health and interface information will display in Analyze > Managed Device GUI. For service module NAM blades such as NAM-3 and NAM-NX1, the NAM managed device is the switch or router where NAM is located. Managed device SNMP credentials are automatically synchronized to the NAM upon NAM boot up. For other NAM platforms, the NAM managed device IP address, SNMP, and/or NetConf interface credential must be provided for NAM to get managed device health and interface information. |
|||
A site is a collection of hosts (network endpoints) partitioned into views that help you monitor traffic and troubleshoot problems. If you want to limit the view of your network data to a specific city, a specific building, or even a specific floor of a building, you can use the sites function. We recommend that sites are configured using prefix-based subnets instead of based on data source. |
See Configuring Sites. |
||
Alarms are predefined conditions based on a rising data threshold, a falling data threshold, or both. You can choose for what types of events you want the software to notify you, and how you want to be notified. Create alarms that will be used for thresholds, then create the thresholds. |
See Defining Thresholds. |
||
Capture allows you to configure up to ten sessions for capturing, filtering, and decoding packet data, manage the data in local or remote storage, and display the contents of the packets. Per file location, you can have only one capture session. We support up to ten capture sessions. |
|||
You can set up scheduled jobs that generate daily reports at a specified time, in a specified interval, and then e-mail it to a specified e-mail address or addresses. |
In the Interactive Report (left side of the dashboard), click Export . Scheduled Export can only be done from a Monitor or Analyze window. |
||
TACACS+ is a Cisco Systems enhancement that provides additional support for authentication and authorization. When a user logs into Prime NAM, TACACS+ determines if the username and password are valid and what the access privileges are. For TACACS+ to work, both NAM and the TACACS+ server has to be configured. |
See Configuring a TACACS+ Server to Support NAM Authentication and Authorization. |
||
You can change many preferences, such as refresh interval, Top N Entries, Data Displayed, and enabling Audit Trail, as needed. |
Setting Up Traffic Configurations
To set up Prime NAM traffic, you should perform the following:
- Configuring Traffic to Monitor
- (Optional) Setting Up Prime NAM Data Sources
- (Optional) Configuring Hardware Deduplication (For specific NAM appliances only)
To view which traffic sources are supported on specific NAM platforms, see the NAM Compatibility Matrix.
Configuring Traffic to Monitor
Prime NAM can monitor your network traffic to perform many tasks including helping you to optimize your network resources and troubleshoot performance issues. Before you can monitor data, you must direct specific traffic flowing through a switch or router to the Prime NAM software for monitoring purposes.
A switched port analyzer (SPAN) session is an association of a destination port with a set of source ports, configured with parameters that specify the monitored network traffic.
NAM allows you to create LOCAL SPAN session only. There are limitations of total number of SPAN sessions per managed device platform. See the managed device document for SPAN limitations.
There are three different ways to configure LOCAL SPAN session on the SUP:
- By using SNMP—NAM supports SNMPv1, SNMPv2c, and SNMPv3. NAM-3 platform will automatically sync SNMP credential with SUP. For the SPAN feature to work under this condition, the managed device must support entity MIB.
- By using NetConf interface—This option is available for NAM appliances. You must provide the SSH credential for NetConf interface. The SUP must have SSH enabled and support NetConf. Cisco Nexus OS devices support this NetConf interface.
- By using RISE—This option is available for NAM appliance with Nexus 7000 devices only. RISE service must be configured on the Nexus device. After RISE is configured, NAM and switch device will sync up automatically.
The following sections describe SPAN sessions on devices running Prime NAM:
Creating a SPAN Session for RISE Appliance
To create a SPAN session for the VDCs of a managed device in RISE environment:
Step 1 Choose Setup > Traffic > SPAN Sessions .
The SPAN Session window appears.
Step 2 Select the managed device from the Managed Device Address drop-down list.
You can view the VDCs of the managed device, and the SPAN sessions created for each VDC.
Step 4 Select a VDC from the Managed Device drop-down list.
Step 5 Fill in the appropriate information on the Create SPAN Session window.
Depending on your platform, the System Information may display some or all of the fields shown in Table D-1 .
Step 6 Click Create to create the SPAN session for the selected managed device.
Creating a SPAN Session for Appliances and other Virtual Platforms
To create a SPAN session on a switch:
Step 1 Choose Setup > Traffic > SPAN Sessions . The SPAN window displays.
The Create SPAN Session Dialog displays. DataPort is the default for the SPAN Type. Contents of this window may be different depending on your NAM platform.
Step 3 Fill in the appropriate information on the Create SPAN Session window. See Table D-1 .
Step 4 To create the SPAN session, click Submit . The Active Sessions window displays.
Step 5 To save the current active SPAN session in the running-configuration to the startup-configuration for switches running Cisco IOS software only, click Save in the active SPAN session window.

Note For switches running Cisco IOS software, all pending running-configuration changes will be saved to the startup-configuration.
Step 6 To verify the SPAN session was created and to view the data, go to the Top N charts on the Traffic Analysis dashboard ( Monitor > Overview > Traffic Summary ).
Editing a SPAN Session for RISE Appliance
To edit a SPAN session for the VDCs of a managed device in RISE environment:
Step 1 Choose Setup > Traffic > SPAN Sessions .
The Active SPAN Sessions dialog box displays.
Step 2 Select a device IP address from the Managed Device Address drop-down list.
Step 4 Select the SPAN session to edit, then click Edit .
The Edit SPAN Session Dialog Box displays. The fields are described in Table D-3 . Depending on your NAM platform, there may be different fields that display.
Step 5 Make the appropriate changes on the Edit SPAN Session window.
Editing a SPAN Session for Appliances and other Virtual Platforms
You can only edit SPAN sessions that have been directed to the NAM. You can only delete certain SPAN sessions using the user interface. NAM allows you to edit and delete SPAN sessions that are destined to one of its DATAPORT. ERSPAN sessions on the main screen are for information only. You cannot edit or delete ERSPAN sessions even if the ERSPAN sessions are for NAM management interface.
Note Editing an existing SPAN session that has multiple SPAN destinations will affect all destinations.
Step 1 Choose Setup > Traffic > SPAN Sessions .
The Active SPAN Sessions dialog box displays.
Step 2 Select the SPAN session to edit, then click Edit .
The Edit SPAN Session Dialog Box displays. The fields are described in Table D-3 . Depending on your NAM platform, there may be different fields that display.
Step 3 Make the appropriate changes on the Edit SPAN Session window.
Setting Up Prime NAM Data Sources
Data sources are where the traffic sent to Prime NAM originates. Some examples of the data sources are:
- Physical dataports of the Prime NAM where you get SPAN data
- A specific router or switch that sends NetFlow to the NAM
- ERSPAN and which goes to NAM management port.
NAM allows you to combine or aggregate two or more data sources to generate a consolidated report for analyzing the traffic. Data sources or ports are part of a flow key, which is used to group network packets into the same flow or conversation. With Link Aggregation / Ether-channeling, asymmetric routing and network taps, packets in the same conversation may be fed to different dataports, so without aggregating dataports, bidirectional flows may not be grouped into the same conversation.

Caution If you have configured sites (see Configuring Sites), you can assign data sources to that particular site. If you do this, and you also configure data sources, the two could overlap since sites can also be a primary “view” into data sources. If there is a mismatch between the two, you will not see any data.
Note We recommend that you configure a site using subnets instead of selecting a data source. For examples on how to specify a site using subnets, see Configuring Sites Using Subnets.
The following sections contains setup steps and specific information about the types of data sources available:
Forwarding SPAN Traffic
A switched port analyzer (SPAN) session is an association of a destination port with a set of source ports, configured with parameters that specify the monitored network traffic. Depending on your platform, you can configure multiple SPAN sessions. For details on what platforms support SPAN, see the NAM Compatibility Matrix.
For more information about SPAN sessions, see Configuring Traffic to Monitor or your platform operating system documentation.
Forwarding ERSPAN Traffic
This section describes how to configure Encapsulated Remote Switched Port Analyzer (ERSPAN) on your remote device as a Prime NAM data source. You configure ERSPAN as a Prime NAM data source from the remote device command line interface, not the Prime NAM GUI.
For details on which NAM platforms support ERSPAN, see the NAM Compatibility Matrix .
As an ERSPAN consumer, Prime NAM can receive ERSPAN packets on its management port from devices such as Cisco routers and switches. Those packets are analyzed as if that traffic had appeared on one of the Prime NAM dataports. Prime NAM supports ERSPAN versions 1 and 3. Incoming ERSPAN data is parsed by Prime NAM, stored in its internal database, and presented in the GUI in the same way as traffic from other data sources.
For the Prime NAM to receive ERSPAN from an external switch or router, that device must be configured to send ERSPAN packets to the IP address of the Cisco NAM.
To enable ERSPAN as a data source:
- Enabling Autocreation of ERSPAN Data Sources Using the Web GUI
- Enabling Autocreation of ERSPAN Data Sources Using the CLI
- Aggregating Data Ports Using the Web GUI
- Disabling Autocreation of ERSPAN Data Sources Using the Web GUI
- Disabling Autocreation of ERSPAN Data Sources Using the CLI
- Creating ERSPAN Data Sources Using the Web GUI
- Creating ERSPAN Data Sources Using the CLI
- Deleting ERSPAN Data Sources Using the Web GUI
- Deleting ERSPAN Data Sources Using the CLI
- Configuring ERSPAN on Devices
Note Depending on the Cisco IOS/Nexus OS version on the managed device, the CLI format for configuring an ERSPAN session may be different than what appears in this document. For details on using ERSPAN as a data source, see your specific OS product documentation.
Enabling Autocreation of ERSPAN Data Sources Using the Web GUI
There is a convenient autocreate feature for data sources, which is enabled by default. With the autocreate feature, a new data source will automatically be created for each device that sends ERSPAN traffic to the NAM, after the first packet is received. Manual creation of ERSPAN data sources using the NAM GUI or the CLI is typically not necessary. When manually creating a data source, you may specify any name you want for the data source. A data source entry must exist on the Prime NAM in order for it to accept ERSPAN packets from an external device.
Autocreated ERSPAN data sources will be assigned a name in the format ERSPAN-<IP Address>-ID-<Integer> , where IP Address is the IP address of the sending device, and Integer is the Session-ID of the ERSPAN session on that device. For example, device 192.168.0.1 sending ERSPAN packets with the Session ID field set to 12 would be named ERSPAN-192.168.0.1-ID-12 . You can edit these autocreated data sources and change the name if desired.
One device can be configured to send multiple separate ERSPAN sessions to the same NAM. Each session will have a unique Session ID. Prime NAM can either group all sessions from the same device into one data source, or have a different data source for each Session ID. When data sources are autocreated, they will be associated with one particular Session ID. When manually created, you can instruct Prime NAM to group all traffic from the same device into one data source. If you check the Session check box, and enter a Session ID in the Value field, the data source will only apply to that specific session. If you leave the check box unchecked, all ERSPAN traffic from the device will be grouped together into this data source, regardless of Session ID.
To configure Prime NAM to automatically create data sources when it receives ERSPAN packets from an external device, use the following steps. Remember however, that the autocreate feature is turned on by default, so these steps are typically not necessary.
Step 1 Choose Setup > Traffic > NAM Data Sources .
Step 2 Click Auto Create on the bottom left of the window.
Step 3 Check the ERSPAN check box to toggle autocreation of ERSPAN data sources to “on”.
Enabling Autocreation of ERSPAN Data Sources Using the CLI
You can also configure the autocreate feature using the Prime NAM CLI. The autocreate feature is turned on by default, in most cases these steps are not necessary.
To configure Prime NAM to automatically create data sources when it receives ERSPAN packets from an external device, use the autocreate-data-source command as follows:
Prime NAM will now automatically create a ERSPAN data source for each device that sends ERSPAN packets to it. The data source will have the specific Session ID that is populated by the device in the ERSPAN packets sent to the NAM. If the same device happens to send ERSPAN packets to the Prime NAM with different Session ID values, a separate data source will be created for each unique Session ID sent from the device.
Aggregating Data Ports Using the Web GUI
Step 1 Choose Setup > Traffic > NAM Data Sources .
Step 3 Click Submit to combine two or more datasources for generating a consolidated report to analyze the traffic.
Disabling Autocreation of ERSPAN Data Sources Using the Web GUI
Step 1 Choose Setup > Traffic > NAM Data Sources .
Step 2 Click Auto Create on the bottom left of the window.
Step 3 Uncheck the ERSPAN check box to toggle autocreation of ERSPAN data sources to “off”.
Disabling Autocreation of ERSPAN Data Sources Using the CLI
To disable autocreation of ERSPAN data sources, use the no autocreate-data-source command as follows:
Creating ERSPAN Data Sources Using the Web GUI
To manually configure a ERSPAN data source on the GUI, for example if the autocreation feature is turned off, use the following steps:
Step 1 Choose Setup > Traffic > NAM Data Sources .
Step 2 Click Create along the bottom of the window.
Step 3 From the Type drop-down list, choose ERSPAN .
Step 4 Enter the IP address of the device that will export ERSPAN to the NAM.
Step 5 Give the Data Source a name. This name will appear anywhere there is a Data Source drop-down list.
Step 6 (Optional) Check the Session check box and enter an Session ID into the Value field if the data source should only apply to that specific session. If you leave the check box unchecked, all ERSPAN traffic from the device will be grouped together into this data source, regardless of Session ID.
Devices can be configured with multiple ERSPAN Sessions. The packets exported may have the same source IP address, but the Session ID exported will be a different for each session. If you want to include only one Session in the data source, you must check the “Session” box and provide the value of that Session ID.
Creating ERSPAN Data Sources Using the CLI
To manually configure a ERSPAN data source on the Prime NAM using the CLI (for example if the autocreation feature is turned off), use the following steps. Note that when using the CLI, there are two separate phases involved: First, you must create a “device” entry on the Prime NAM and remember the device ID, and then you must create a data source entry using this device ID. In the Prime NAM GUI, these two phases for creating ERSPAN data sources are combined together.
Step 1 Enter the command device erspan . You will now be in erspan device subcommand mode as shown here:
Step 2 Enter ? to see all the command options available, as in the example below:
Step 3 Enter the IP address of the device as shown in this example (required):
Step 4 Type show to look at the device configuration that will be applied and verify that it is correct:
Step 5 Type exit to come out of the subcommand mode and create the device. Remember the ID value that was assigned to the new device (you will need it to create the data source).
Step 6 Enter the command data-source erspan . You will now be in erspan data source subcommand mode as shown here:
Step 7 Enter ? to see all the command options available, as in the example below:
Step 8 Enter the device ID from Step 4.
Step 9 Enter the name you would like for the data source (required):
Step 10 If desired, supply the specific Session ID for this ERSPAN data source (optional):
Step 11 Enter show to look at the data source configuration that will be applied and verify that it is correct:
Step 12 Enter exit to come out of the subcommand mode and create the data source:
The data source is now created, and ERSPAN records from the device will be received and accepted by Prime NAM as they arrive.
Deleting ERSPAN Data Sources Using the Web GUI
To delete an existing ERSPAN data source, use the following steps. Note that if the autocreation feature is turned on, and the device continues to send ERSPAN packets to the NAM, the data source will be recreated again automatically as soon as the next ERSPAN packet arrives. Therefore, if you wish to delete an existing ERSPAN data source, it is usually advisable to first turn the ERSPAN autocreate feature off, as described earlier.
Step 1 Choose Setup > Traffic > NAM Data Sources.
Step 2 Choose the data source you would like to delete.
Step 3 Click Delete along the bottom of the window.
Deleting ERSPAN Data Sources Using the CLI
To delete a ERSPAN data source using the CLI, use the following steps. Note that when using the CLI, there are generally two separate phases involved. First you should delete the data source, then delete the device if you have no other data sources using the same device (for example with a different Engine ID value). As a shortcut, if you simply delete the device, then all data sources using that device will also be deleted.
Step 1 Show all data sources so you can find the ID of the one you want to delete:
Step 2 Use the no data-source command to delete the data source:
Step 3 Show all devices so you can find the ID of the one you want to delete:
Step 4 Use the no device command to delete the device:
Note that if the autocreation mode is on, and the device continues to send ERSPAN packets to the NAM, the data source (and device entry) will be recreated again automatically as soon as the next ERSPAN packet arrives. Therefore, if you wish to delete an existing ERSPAN data source, it is usually advisable to first turn the ERSPAN autocreate feature off, as described earlier.
Configuring ERSPAN on Devices
There are two ways to configure ERSPAN so that the Prime NAM receives the data:
- Sending ERSPAN Data to Layer 3 Interface
- Sending ERSPAN Data Directly to the Cisco NAM Management Interface
Note Depending on the Cisco IOS or NX-OS version on your managed device, the CLI format for configuring an ERSPAN session may be different than what appears in this document. For details on using ERSPAN as a data source, see your specific OS product documentation.
Sending ERSPAN Data to Layer 3 Interface
To send the data to a layer 3 interface on the Switch housing the NAM, configure the ERSPAN source session. The ERSPAN destination session then sends the traffic to a Prime NAM data-port. After performing this configuration, you can select the DATA PORT X data source to analyze the ERSPAN traffic.
Note This method causes the ERSPAN traffic to arrive on one of the NAM dataports, which is the most efficient method and will not have any adverse effect on the NAM’s IP connectivity. Therefore, we recommend this method. The configuration below may be different depending on your platform and OS version. See your OS product documentation for additional help.
Sample Configuration of ERSPAN Source
In the examples below, the following symbols are used:
Besides the command above, you can also specify an IP address for a data-port as in the example below:
Note The difference between these two commands is that, the NAM will not replay ARP requests or send GARP packets when using the ip-erspan command, so the user needs to configure static-ARP of this IP address on the switch housing NAM.
Configuring the Data-Port ERSPAN mode using the CLI
The NAM supports three data-port ERSPAN modes, which are encapsulation, data-source and strip mode.
– In encapsulation mode, NAM monitors ERSPAN traffic stats on the DATA PORT’s data source, with ERSPAN’s encapsulation layer.
– In data-source mode, NAM monitors ERSPAN traffic stats on the ERSPAN data source, stripping off ERSPAN’s encapsulation header. Note that capture should still occur on the DATA PORT data source.
– In strip mode, NAM monitors ERSPAN traffic stats on the DATA PORT’s data source, stripping off ERSPAN’s encapsulation header.
Note NAM-3, NAM-NX1 and appliances with 1G data-port don’t support ERSPAN mode. Only vNAM supports ERSPAN data-source mode.
Sample Configuration of ERSPAN mode
root@appliance-2420-90.cisco.com# data-port erspan-mode strip
root@appliance-2420-90.cisco.com# show data-port erspan-mode
- N matches the ERSPAN ID at the source switch
- aa.bb.cc.dd is the IP address defined at the destination
- aa.bb.cc.ii is the IP address of the NAM data port
- ee.ff.gg.hh is the IP address of the NAM management port
Sending ERSPAN Data Directly to the Cisco NAM Management Interface
To send the data directly to the Cisco NAM management IP address (management-port), configure the ERSPAN source session. No ERSPAN destination session configuration is required. After performing this configuration on the Catalyst 6500 switch, when ERSPAN packets are sent to the NAM, it will automatically create a data source for that packet stream. If the autocreate feature is not enabled, you will have to manually create the data source for this ERSPAN stream of traffic (see Creating ERSPAN Data Sources Using the Web GUI).
Note This method causes the ERSPAN traffic to arrive on the Cisco NAM management port. If the traffic level is high, this could have negative impact on the NAM’s performance and IP connectivity.
Forwarding VACL Traffic
You can use VLAN access control (VACL) lists to filter packet data and expand your device’s capability beyond the two SPAN session limitation. For details on which devices support VACL, see the NAM Compatibility Matrix .
VACL can forward traffic from either a WAN interface or VLANs to a dataport on some of the NAM platforms. A VACL provides an alternative to using SPAN; a VACL can provide access control based on Layer 3 addresses for IP and IPX protocols. The unsupported protocols are access controlled through the MAC addresses. A MAC VACL cannot be used to access control IP or IPX addresses.
Configuring VACL on a WAN Interface
Because WAN interfaces do not support the SPAN function, you must use the switch CLI to manually configure a VACL in order to monitor WAN traffic with the NAM. This feature only works for IP traffic over the WAN interface.
VACL can also be used if there is no available SPAN session to direct traffic to the NAM. In this case, a VACL can be set up in place of a SPAN for monitoring VLAN traffic.
The following example shows how to configure a VACL on an ATM WAN interface and forward both ingress and egress traffic to the NAM. These commands are for switches running Cisco IOS version 12.1(13)E1 or higher. For more information on using these features, see your accompanying switch documentation.
To monitor egress traffic only, get the VLAN ID that is associated with the WAN interface by using the following command:
After you have the VLAN ID, configure the Cisco NAM dataport using the following command:
To monitor ingress traffic only, replace the VLAN number in the capture configuration with the native VLAN ID that carries the ingress traffic. For example, if VLAN 1 carries the ingress traffic, you would use the following command:
Configuring VACL on a LAN VLAN
For VLAN Traffic monitoring on a LAN, traffic can be sent to Cisco NAM by using the SPAN feature of the switch. However, in some instances when the traffic being spanned exceeds the monitoring capability of the NAM, you might want to pre-filter the LAN traffic before it is forwarded. This can be done by using VACL.
The following example shows how to configure VACL for LAN VLAN interfaces. In this example, all traffic directed to the server 172.20.10.221 on VLAN 1 is captured and forwarded to the Cisco NAM located in slot 3.
See Configuring ACL Capture on Nexus 7000 Series for details on how to configure VACL capture on Nexus 7000.
Forwarding NetFlow Traffic
NAM functions as a NetFlow consumer. You can configure NetFlow on the device side so that Prime NAM can receive NetFlow packets from devices such as Cisco routers and switches. Those records are stored in its collection database as if that traffic had appeared on one of the Cisco NAM dataports. Prime NAM understands NetFlow version 5 and version 9. Incoming NetFlow data is parsed by Prime NAM, stored in its internal database, and presented in the user interface in the same way as traffic from other data sources.
For Prime NAM to receive NetFlow packets from an external switch or router, you must configure that device to forward export flow records to the NAM’s IP address and the correct UDP port number. The default port number on which Prime NAM listens for NetFlow packets is port 3000. This port can be modified using the Prime NAM CLI, but it is critical that the same port be configured on the Cisco NAM and the exporting device or devices. Depending on the external device, you may need to enable the NetFlow feature on a per-interface basis.
Configuring NetFlow on Devices
The configuration commands for NetFlow devices to export NetFlow packets to Prime NAM are platform and device specific. The example configuration commands provided here are the ones most commonly found for devices running Cisco IOS. For more detailed NetFlow configuration information, see your device documentation.
Enabling Autocreation of NetFlow Data Sources Using the Web GUI
To configure Prime NAM to automatically create data sources when it receives NetFlow packets from an external device, use the following steps. Remember however, that the autocreate feature is turned on by default, so these steps are typically not necessary.
Step 1 Choose Setup > Traffic > NAM Data Sources .
Step 2 Click Auto Create on the bottom left of the window.
Step 3 Check the Netflow check box to toggle autocreation of NetFlow data sources on.
Enabling Autocreation of NetFlow Data Sources Using the CLI
Configuration of the autocreate feature is also possible using the Prime NAM CLI. Remember that the autocreate feature is turned ON by default, so in most cases these steps are not necessary.
To configure the Prime NAM to automatically create data sources when it receives NetFlow packets from an external device, use the following steps:
Use the autocreate-data-source command as follows:
Prime NAM will now automatically create a NetFlow data source for each device that sends NetFlow packets to it. The data source will have the specific Engine ID that is populated by the device in the NetFlow packets sent to the NAM. If the same device happens to send NetFlow packets to the NAM with different Engine ID values, a separate data source will be created for each unique Engine ID sent from the device.
Disabling Autocreation of NetFlow Data Sources Using the Web GUI
Step 1 Choose Setup > Traffic > NAM Data Sources .
Step 2 Click Auto Create on the bottom left of the window.
Step 3 Uncheck the Netflow check box to toggle autocreation of NetFlow data sources off.
Disabling Autocreation of NetFlow Data Sources Using the CLI
To disable autocreation of NetFlow data sources, use the no autocreate-data-source command as follows:
Creating NetFlow Data Sources Using the Web GUI
To manually configure a NetFlow data source using the Prime NAM GUI, for example if the autocreation feature is turned OFF, use the following steps:
Step 1 Choose Setup > Traffic > NAM Data Sources .
Step 2 Click Create along the bottom of the window.
Step 3 Give the Data Source a name. This name will appear anywhere there is a Data Source drop-down list.
Step 4 From the Type drop-down list, choose NetFlow .
Step 5 Enter the IP address of the device that will export NetFlow to Prime NAM (required).
Step 6 (Optional) If you know the specific value of the Engine ID on the device you would like to monitor, check the Engine check box, and enter the value of the Engine ID. If the Engine check box is left unchecked, then all NetFlow records exported by the device will be grouped into the same data source, regardless of the Engine ID populated in the NetFlow packets (in most cases the Engine check box can be left blank and you don't have to worry about the Engine ID value).
Some devices have multiple Engines which independently export NetFlow records. For example, on some Cisco routers, NetFlow records can be exported by the Supervisor module as well as individual line cards. The packets exported may have the same source IP address, but the Engine ID exported by the Supervisor will be a different value than the Engine ID(s) exported by the line card(s). If you want to include only one Engine in the data source, you must check the “Engine” box and provide the value of that Engine ID.
Step 7 (Optional) SNMP v1/v2c RO Community String: If SNMP v1 or v2c will be used to communicate with the device, enter the community string that is configured on the device that is going to export NetFlow packets to the NAM.
Step 8 (Optional) “Enable SNMP v3”: If SNMP v3 will be used to communicate with the device, fill in the fields within the v3-specific dialog.
Step 9 (Optional) If desired, fill in the SNMP credentials for the device. If valid SNMP credentials are provided, Prime NAM can upload readable text strings from the device to describe the interfaces on that device rather than just displaying the interfaces as numbers. You may specify either SNMPv2c or SNMPv3 credentials. See Table D-4 .
Step 10 Click Test Connectivity to see if the information you provided is accurate.
Creating NetFlow Data Sources Using the CLI
To manually configure a NetFlow data source on the Prime NAM using the CLI, for example if the autocreation feature is turned off, use the following steps. Note that when using the CLI, there are two separate phases involved. First you must create a “device” entry on the Prime NAM and remember the device ID. Then you must create a data source entry using this device ID. For convenience, these two phases are combined together when using the GUI to create NetFlow data sources.
Step 1 Enter the command device netflow . You will now be in netflow device subcommand mode as shown here:
Step 2 Enter ? to see all the command options available, as in the example below:
Step 3 Enter the IP address of the device as shown in this example (required):
Step 4 If desired, enter the SNMP credentials for the device, as in the example below. If you specify snmp-version v2c, then you should enter the community string for the device. If you specify snmp-version v3, then you should enter the security level, username, authentication protocol, authentication passphrase, privacy protocol, and privacy passphrase.
Step 5 Enter show to look at the device configuration that will be applied and verify that it is correct:
Step 6 Enter exit to come out of the subcommand mode and create the device. Remember the ID value that was assigned to the new device, you will need it to create the data source!
Step 7 Enter the command data-source netflow . You will now be in netflow data source subcommand mode as shown here:
Step 8 Enter ? to see all the command options available, as in the example below:
Step 9 Enter the device ID from Step 4 (required):
Step 10 Enter the name you would like for the data source (required):
Step 11 If desired, supply the specific Engine ID for this NetFlow data source (optional):
Step 12 Enter show to look at the data source configuration that will be applied and verify that it is correct:
Step 13 Enter exit to come out of the subcommand mode and create the data source:
The data source is now created, and NetFlow records from the device will be received and accepted by the Prime NAM as they arrive.
Deleting NetFlow Data Sources Using the Web GUI
To delete an existing NetFlow data source, use the following steps. If the autocreation feature is turned on, and the device continues to send NetFlow packets to the NAM, the data source will be recreated again automatically as soon as the next NetFlow packet arrives. Therefore, if you wish to delete an existing NetFlow data source, it is usually advisable to first turn the NetFlow autocreate feature off, as described earlier.
Step 1 Choose Setup > Traffic > NAM Data Sources .
Step 2 Click on the data source you would like to delete.
Deleting NetFlow Data Sources Using the CLI
To delete a NetFlow data source using the CLI, use the following steps. Note that when using the CLI, there are generally two separate phases involved. First you should delete the data source, then delete the device if you have no other data sources using the same device (for example with a different Engine ID value). As a shortcut, if you simply delete the device, then all data sources using that device will also be deleted.
Step 1 Show all data sources so you can find the ID of the one you want to delete:
Step 2 Use the no data-source command to delete the data source:
Step 3 Show all devices so you can find the ID of the one you want to delete:
Step 4 Use the no device command to delete the device:
Note that if the autocreation mode is on, and the device continues to send NetFlow packets to the NAM, the data source (and device entry) will be re-created again automatically as soon as the next NetFlow packet arrives. Therefore, if you wish to delete an existing NetFlow data source, it is usually advisable to first turn the NetFlow autocreate feature off, as described earlier.
Testing NetFlow Devices
You can test the SNMP community strings for the devices in the Devices table. To test a device, select it from the Devices table, then click Test . The Device System Information Dialog Box displays. See Table D-5 for a description of the fields.
If the device is sending NetFlow Version 9 (V9) and the Prime NAM has received the NetFlow templates, then a V9 Templates button appears below the Device System Information window.
Note NetFlow v9 templates do not appear in all NetFlow packets. When there are no templates, the V9 Templates button does not appear.
Forwarding CEF Traffic
Cisco Express Forwarding (CEF) is an advanced, layer 3 IP switching technology. CEF optimizes network performance and scalability for networks with large and dynamic traffic patterns, such as Internet, on networks characterized by intensive Web-based applications, or interactive sessions. For more information about CEF and configuring CEF, see the Cisco IOS Switching Services Configuration Guide .
You can configure CEF traffic copy and forward it to NAM session as a Prime NAM data source from the remote device command line interface and not from the Prime NAM GUI.
For details on which NAM platforms support CEF traffic, see the NAM Compatibility Matrix .
As a CEF consumer, Prime NAM can receive CEF packets on its data port from Cisco monitoring interface. Prime NAM supports monitoring and analysis of incoming CEF data to be parsed by Prime NAM, stored in its internal database, and presented in the GUI in the same way as traffic from other data sources.
For the Prime NAM to receive CEF traffic from router, the device must be configured to copy and forward the CEF packets to Cisco Prime NAM.
To enable CEF as a data source:
- Configure CEF and CEF monitoring on devices
- CEF data port will be auto created on physical port receiving CEF traffic on devices
See the Cisco IOS Switching Services Configuration Guide, Release 12.2 for CEF configuration examples.
Note Depending on the Cisco IOS/Nexus OS version on the managed device, the CLI format for configuring a CEF copy and forward session may be different from what appears in this document. Ensure that your IOS/Nexus OS version supports UCSE platform. Before you create CEF traffic monitoring session on a router, enable NAM feature through UCSE CIMC. For list of router platforms and IOS releases support UCSE, see Getting Started Guide for Cisco UCS E-Series Servers and the Cisco UCS E-Series Network Compute Engine, Release 2.x.
See Understanding How the Prime NAM uses CEF for details of how to configure CEF monitoring.
Configuring Hardware Deduplication
Note This section applies only to Cisco NAM 2320, 2420, 2440 appliance.
Prime NAM supports hardware-based detection of duplicate packets and allows you to configure a single deduplication filter that reduces the amount of duplicate traffic across all adapter ports.
You can use deduplication to eliminate redundant data. This can help to significantly shrink storage requirements and improve bandwidth efficiency on tasks like backup and recovery.
After you enable deduplication, the NAM appliance detects and filters the duplicated packets. The packet is identified as duplicated if all inspected segments match another packet within the specific time window.
In addition to the duration-based timeout, there is also a fixed packet-count timeout. There cannot be more than 7 packets between the duplicate packets. If packets 0 and 8 are identical, packet 8 will be dropped. If packets 0 and 9 are identical, packet 9 will not be dropped.
To configure packet deduplication:
Step 1 Choose Setup > Traffic > Hardware Deduplication .
Step 2 Check the Enabled check box to enable packet deduplication.
Enter a value in the Time Window (1-127 in millisecond (ms)) for the search or buffer period.
The value you set in the Time Window indicates the length of time (ms) in which two packets can be considered duplicates. If the Time Window is 100 ms but two identical packets arrive 120 ms apart, the second packet would not be dropped. If the identical packets arrive 80 ms apart, the second packet would be dropped.
Step 3 Click to choose a segment of the packet to inspect for deduplication.
The default inspects the entire packet. The second option inspects all segments except the ISL portion of the packet. The third option inspects all segments except the ISL, MAC, and VLAN portions of the packet. The fourth option inspects all segments except the ISL, MAC, and VLAN portions of the packet. The final (bottom) option inspects only the UDP/TCP and payload segments of the packet.
Note Regardless of the option you choose, the packet checksum is ignored.
Step 4 Click Submit to enable the settings you have entered, or click Reset to cancel any change.
Setting Up Alarms and Alarm Thresholds
Alarms are predefined conditions based on a rising data threshold, a falling data threshold, or both. You can choose what types of events for which you want Prime NAM to notify you, and how you want to be notified. Monitoring alarms enables you to watch problem areas and collect data on areas such as increased utilization, severe application response delays, and voice quality degradation.
This is the order that you typically follow for setting up alarms and alarm thresholds:
Step 1 Define the way you would like to be notified when an alarm occurs (by e-mail, trap, trigger capture, or syslog).
Step 2 Define the Alarm Action at Setup > Alarms > Actions .
Step 3 Define the Threshold for this alarm at Setup > Alarms > Thresholds .
The tasks for setting up alarms are:
Configuring Alarm Actions
Alarms are predefined conditions based on a rising data threshold, a falling data threshold, or both.
When a threshold’s rising water mark is crossed, the alarm condition is met. This triggers the alarm action to take effect.
Step 1 Choose Setup > Alarms > Actions .
The Alarm Action page displays any configured actions. If none of the four actions (e-mail, trap, capture, or syslog) are configured, you will see
No data available
.
Step 3 Enter a Name for the action (up to 63 characters).
Step 4 Choose the type of alarm action. Prime NAM supports any combination of these four actions in one alarm condition:
An alarm action that e-mails the syslog content of the alarm condition. To avoid e-mail flooding the network, Prime NAM does not send more than five e-mails in any given hour. |
Configure the e-mail address in Administration > System > E-Mail Setting . Prime NAM alarm mail is sent as a result of Prime NAM alarms, not router or switch alarms. Prime NAM sends up to five e-mails per hour per function (traffic and NetFlow, voice signaling, RTP, and application response time). Also, in each e-mail, there could be up to five alarm messages. These limits are in place to avoid e-mail overload. If you have configured e-mail alarms and do not receive e-mail, then your Prime NAM does not have any alarms. If Prime NAM sends you many alarm messages, the e-mail may state, for example, “5 of 2,345 alarm messages.” |
|
An alarm action that sends Prime NAM trap messages to one or more trap servers. Any trap server that has the same community string will receive the trap message. Prime NAM uses Cisco Syslog MIB in the trap message. To avoid trap flooding, the limit is ten trap messages per interval. |
Choose the SNMP community where you would like traps to be sent. Configure the community string in Administration > System > SNMP Trap Setting . After the “Community field appears, choose the community string from the drop-down list. |
|
An alarm action to start or stop a pre-defined capture session or stop a capture to save it to a file. |
From the Session drop-down, choose the session (the list will be empty if there is no capture session configured in Capture > Packet Capture/Decode > Sessions ). Click the Start Capture , Stop Capture , or Stop Capture and Save to File radio button. For more details, see Understanding Trigger Capture. |
|
An alarm action that sends syslog messages to remote syslog servers. The limit is ten syslog messages per interval to avoid flooding the network. |
This will log syslog messages. The default setting is to log syslog messages locally to Prime NAM. If you want to log syslog messages to remote servers, set up the destination information at Administration > System > Syslog Setting . |
Step 5 To edit or delete alarm actions, select the alarm and use the appropriate button.
The Alarm Action table displays the newly configured action in its list.
Viewing Alarm Actions
Alarms are predefined conditions based on a rising data threshold, a falling data threshold, or both. You can set thresholds and alarms on various network parameters such as increased utilization, severe application response delays, and voice quality degradation and be alerted to potential problems.
Prime NAM supports IPv6 for all alarm functionality.
Note You could see two alarms for the same occurrence if both the source and the destination are in the same site.
To see events that have been created, choose Setup > Alarms > Actions . See Table D-5 for descriptions of the fields on the Alarm Configuration window.
To configure alarm actions, see Configuring Alarm Actions.
Understanding Trigger Capture
This section describes how to use a trigger capture to start a capture session based on the alarm parameters you set. For example, you can set alarm parameters on various thresholds to start a capture session which can be used to investigate some kind of questionable network activity.
You must set your alarm threshold parameters so that Prime NAM has defined rising or falling numbers that will cause an action, or trigger, to start a capture session. You can also use the stop-and-save and Scheduled Capture option. The actions are defined below:
- Trigger Capture Start —An alarm condition occurs based on threshold parameters you have set; the capture session starts automatically.
- Trigger Capture Stop : An alarm condition occurs based on the threshold parameters you have set; the capture session stops automatically.
- Trigger Capture Stop Capture and Save to File —An alarm condition occurs, stopping the capture session. If the captured packet data is in memory, it is saved to a file. The buffer memory is then clear to wait for next alarm event.
- Trigger Capture Scheduled Capture —An alarm condition occurs, starting the capture session on specific date time for certain duration (in minutes).
When an event occurs that you have defined as an alarm threshold, NAM stops any existing capture session and saves the captured packets from memory into a file. The capture session then restarts. NAM can save up to five files, depending on your local hard disk storage.
NAM monitors for threshold parameters every minute. For real-time data, the default is 5 minutes.
Defining Thresholds
Prime NAM can inspect incoming performance records and apply a configured set of thresholds to the most recent interval of data. Using thresholds allows you to target specific network traffic issues and set up notifications that are triggered when certain thresholds are crossed. For example:
- if a server's CPU load exceeds 90%
- if a device or the whole network uses more bandwidth than usual, or
- if the remaining file size on a disk drive is less than 15% or 100 MB.
In general, you should set thresholds so that only severe traffic problems that impact quality of service generate events. These critical events are intended to provide actionable notification of problems to network operators. When setting thresholds try to identify a traffic level that will have a noticeable effect on network service levels. Set a duration that corresponds to an unacceptable period of poor service. The goal is to generate very few, significant events indicating severe problems that require immediate attention. Thresholds are not intended as a reporting tool to generate statistical information about network traffic.
To set up alarm thresholds for variables with values that trigger alarms, see Viewing Alarm Actions.
Note You could receive two alarms for the same occurrence if both the source and the destination are in the same site.
You can also decide whether you want to be notified if the threshold is being crossed just once, or whether you only want an alarm to be triggered if this state persists for a certain time. This helps you to ensure an effective network monitoring system, which will not bombard you with unnecessary notifications.
Prime NAM Threshold Alarms window ( Setup > Alarms > Thresholds ) displays thresholds you have configured. If you hover over the arrow next to the threshold Name a detailed view of the selected threshold displays.
For descriptions of the fields on the Threshold window, see Table D-6 .
You can set up alarm thresholds by defining threshold conditions for monitored variables on the NAM.
You can configure the following thresholds:
- Setting Host Thresholds
- Setting Conversation Thresholds
- Setting Application Thresholds
- Setting Response Time Thresholds
- Setting DSCP Thresholds
- Setting RTP Stream Thresholds
- Setting Voice Signaling Thresholds
- Setting NetFlow Interface Thresholds
- Setting Video Stream Thresholds
- Setting MDI Stream Thresholds
- Setting Transaction Analysis Thresholds
- Editing or Deleting an Alarm Threshold
Note that many of the threshold types contain a Host field, which is an editable drop down list. The drop down list will contain a list of the ten most recently specified hosts, but is also editable to allow a host to be specified that is not yet in the drop down list. The host field can also be left blank or specified as Any. The three cases are described below, and an example follows.
– Case 1: A specific host is added to the Host field: In this case, the threshold will apply to that specific host, and will result in a single alarm being raised when that host is matched.
– Case 2: The Host field is left blank: In this case, the host field is not considered for matching. This results in a single threshold that will apply to any hosts, and will result in a single alarm being raised when all other threshold fields are matched.
– Case 3: Any is specified for the Host field: In this case, each host will have a threshold applied to it, and will result in an alarm being raised for each matched host when all the other threshold fields are matched. Note that in this case, multiple alarms, can be raised.
Example of creating a Transaction Analysis alarm threshold for:
– Case 1: Client Host is 10.2.0.2: The average session time for 10.2.0.2 is 250,000 ((100000 + 400000) / 2), which is greater than the rising value of 200,000, so one alarm is raised.
– Case 2: Client Host is left blank: The average session time for all client and server 10.1.2.3 is 400,000 ((100000 + 400000 + 500000 + 600000) / 4), which is greater than the rising value of 200,000, so one alarm will be raised.
– Case 3: Client Host is specified as Any: We aggregate the client entries for server 10.1.2.3, and get the three entries below, each of which is greater than the rising value of 200,000.So three alarms are raised.
Setting Host Thresholds
Step 1 Choose Setup > Alarms > Thresholds .
Step 2 Click Create and choose the Host tab.
Step 3 The Host Alarm Threshold Configuration window displays. Fill in the fields as appropriate.
Table D-8 describes the fields available on this window.
Note If you leave a selection blank, it means that the parameter will not be considered. If you select Any, it will use any of the selections for that parameter, if encountered. (see example in the Defining Thresholds page).
Step 4 Click Submit to set the thresholds, click Reset to reset the thresholds to their default value, or click Cancel to remove any changes you might have made.
Step 5 When finished, click Submit.
Setting Conversation Thresholds
Step 1 Choose Setup > Alarms > Thresholds .
Step 2 Click Create and choose the Conversation tab.
Step 3 The Conversation Alarm Threshold Configuration window displays. Fill in the fields as appropriate.
Table D-9 describes the fields available in this window.
Note If you leave a selection blank, it means that parameter will not be considered. If you select Any, it will use any of the selections for that parameter, if encountered. (see example in the Defining Thresholds page).
Step 4 Click Submit to set the thresholds, click Reset to reset the thresholds to their default value, or click Cancel to remove any changes you might have made.
Step 5 When finished, click Submit.
Setting Application Thresholds
Step 1 Choose Setup > Alarms > Thresholds .
Step 2 Click Create and choose the Application tab.
Step 3 The Application Alarm Threshold Configuration window displays. Fill in the fields as appropriate.
Table D-10 describes the fields available in this window.
Note If you leave a selection blank, it means that parameter will not be considered. If you select Any, it will use any of the selections for that parameter, if encountered. (see example in the Defining Thresholds page).
Step 4 Click Submit to set the thresholds, click Reset to reset the thresholds to their default value, or click Cancel to remove any changes you might have made.
Step 5 When finished, click Submit.
Setting Response Time Thresholds
Step 1 Choose Setup > Alarms > Thresholds .
Step 2 Click Create and choose the Response Time tab.
Step 3 The Response Time Alarm Threshold Configuration window displays. Fill in the fields as appropriate.
Table D-11 describes the fields available in this window.
Note If you leave a selection blank, it means that parameter will not be considered. If you select Any, it will use any of the selections for that parameter, if encountered. (see example in the Defining Thresholds page).
Step 4 Click Submit to set the thresholds, click Reset to reset the thresholds to their default value, or click Cancel to remove any changes you might have made.
Step 5 When finished, click Submit.
Setting DSCP Thresholds
Step 1 Choose Setup > Alarms > Thresholds .
Step 2 Click Create and choose the DSCP tab.
Step 3 The DSCP Alarm Threshold Configuration window displays. Fill in the fields as appropriate.
Table D-12 describes the fields available in this window.
Note If you leave a selection blank, it means that parameter will not be considered. If you select Any, it will use any of the selections for that parameter, if encountered. (see example in the Defining Thresholds page).
Step 4 Click Submit to set the thresholds, click Reset to reset the thresholds to their default value, or click Cancel to remove any changes you might have made.
Step 5 When finished, click Submit.
Setting RTP Stream Thresholds
Prime NAM sends syslog, trap, e-mail, and trigger captures for RTP streams that violate stream statistics thresholds on the following metrics:
– Number of Consecutive Packet Loss
Each RTP packet has an RTP header that contains a sequence number. The sequence number increments by one for each RTP packet received in the same RTP stream. A gap in the sequence numbers identifies a packet loss. If the gap in sequence numbers jump is more than the threshold, the software raises an alarm condition.
There are two types of percent packet loss percent: Adjusted Packet Loss and Actual Packet Loss. Actual Packet Loss indicates expected packets that never appear in Prime NAM. Adjusted Packet Loss includes actual packets lost and packets that arrive with large delay beyond the expected buffer capacity of the endpoint.
– Jitter: Packets delay compare to the expected receiving time
– Concealment Seconds: Seconds in which there is one or more packets lost
– Severe Concealment Seconds: Seconds in which there is more than 5% of packet lost
To set thresholds for RTP streams:
Step 1 Choose Setup > Alarms > Thresholds .
Step 2 Click Create and choose the RTP Streams tab.
Step 3 The RTP Stream Alarm Threshold Configuration window displays. Fill in the fields as appropriate.
Table D-13 describes the fields available in this window.
Note If you leave a selection blank, it means that parameter will not be considered. If you select Any, it will use any of the selections for that parameter, if encountered. (see example in the Defining Thresholds page).
Step 4 Click Submit to set the thresholds, click Reset to reset the thresholds to their default value, or click Cancel to remove any changes you might have made.
Step 5 When finished, click Submit.
Setting Voice Signaling Thresholds
You can set up software to monitor voice call quality. When Cisco Unified Communication Manager’s call detail records option is enabled, Cisco IP phones, both SCCP and SIP, will report the call’s jitter and packet loss at the end of the call. Prime NAM intercepts this information and raises an alarm when the alarm condition crosses the rising threshold.
To set up a voice signaling threshold:
Step 1 Choose Setup > Alarms > Thresholds .
Step 2 Click Create and choose Voice Signaling tab.
Step 3 The Voice Signaling Alarm Threshold Configuration window displays. Fill in the fields as appropriate.
Table D-14 describes the fields available under the Voice Signaling Metrics drop-down menu.
Note If you leave a selection blank, it means that parameter will not be considered. If you select Any, it will use any of the selections for that parameter, if encountered. (see example in the Defining Thresholds page).
Step 4 Click Submit to set the voice signaling thresholds, click Reset to reset the thresholds to their default value, or click Cancel to remove any changes you might have made.
Step 5 When finished, click Submit.
Setting NetFlow Interface Thresholds
Step 1 Choose Setup > Alarms > Thresholds .
Step 2 Click Create and choose the NDE Interface tab.
The NDE Interface Alarm Threshold Configuration window displays. The fields are described in Table D-15 .
Note If you leave a selection blank, it means that parameter will not be considered. If you select Any, it will use any of the selections for that parameter, if encountered. (see example in the Defining Thresholds page).
Step 3 Click Submit to set the thresholds, click Reset to reset the thresholds to their default value, or click Cancel to remove any changes you might have made.
Setting Video Stream Thresholds
Prime NAM can monitor the quality of video streams and trigger alarms for video streams that violates stream statistics thresholds. Each video stream contains a series of video frames. The video frames are of different frame type such as I (Intra), P (Predicted) and B (Bi-predictive). I frames are the most important frames in the video. The metrics are given with regard to only I frames or to all frame types. The metrics are as follows:
- Number of Video Frame Loss Count
- I or All frame loss count in the current interval
- Video Frame Loss Percentage
- All frame loss percentage in the current interval
To set thresholds for Video streams:
Step 1 Choose Setup > Alarms > Thresholds .
Step 2 Click Create and choose the Video Streams tab.
The Video Stream Alarm Threshold Configuration window displays. Fill the fields as appropriate. Table D-16 describes the fields available in this window.
Note If you leave a selection blank, it means that parameter will not be considered. If you select Any, it will use any of the selections for that parameter, if encountered (see example in the Defining Thresholds page).
Step 3 Click Submit to set the thresholds, click Reset to reset the thresholds to their default value, or click Cancel to remove any changes you might have made.
Step 4 Click Submit when finished .
Setting MDI Stream Thresholds
MDI streams are defined as video streams that are carried over MPEG-TS. Prime NAM can monitor the quality of MDI streams and trigger alarms for streams that violates stream statistics thresholds on the following metrics:
To set thresholds for Video streams:
Step 1 Choose Setup > Alarms > Thresholds .
Step 2 Click Create and choose the MDI Streams tab.
The MDI Stream Alarm Threshold Configuration window displays. Fill the fields as appropriate. Table D-17 table describes the fields available in this window.
Note If you leave a selection blank, it means that parameter will not be considered. If you select Any, it will use any of the selections for that parameter, if encountered (see example in the Defining Thresholds page).
Step 3 Click Submit to set the thresholds, click Reset to reset the thresholds to their default value, or click Cancel to remove any changes you might have made.
Step 4 When finished, click Submit .
Setting Transaction Analysis Thresholds
Step 1 Choose Setup > Alarms > Thresholds.
Step 2 Click Create and choose the Transaction Analysis tab.
Step 3 The Transaction Analysis Alarm Threshold Configuration window displays. Fill in the fields as appropriate, using table Table D-18 .
Note If you leave a section blank, it means that the parameter will not be considered. If you select Any, any of the selections for that parameter will be used. (see example in the Defining Thresholds page).
Step 4 Click Submit to set the thresholds, click Reset to reset the thresholds to their default value, or click Cancel to remove any changes you might have made.
Step 5 When finished, Click Submit.
Editing or Deleting an Alarm Threshold
You can edit alarm thresholds on an as-needed basis. You can delete thresholds when you no longer need them. Any changes take effect immediately.
To edit or delete an alarm threshold:
Step 1 Choose Setup > Alarms > Thresholds .
The Thresholds table displays.
Step 2 Select the alarm, then click Edit or Delete .
Step 3 Depending on your selection:
- If you selected to edit, the dialog box displays for the type of alarm; for example, Host Threshold . Make the necessary changes. Then
– click Submit to save your changes
– click Reset to reset the thresholds to the values set before you edited them, or
– click Cancel to cancel the edit and return to the previous page.
- If you selected to delete, click OK to confirm deletion, or click Cancel to leave the configuration unchanged.
Setting Up Data Export
The tasks for setting up data export are:
- Configuring CDB Export
- Configuring NetFlow Export Templates
- Scheduling Data Report Exports
- Sharing Files
Configuring CDB Export
This tool can export the data in the cdb_table to DNA.
The cdb_export tool can export CoreConv.cdb, ArtWireless.cdb and RtpConv.cdb data to other system by protobuf.
Here are the command help lines:
– Show all the collector: show cdb-export all
– Add DNA as the collector to export: cdb-export collector 1 ip-address 172.20.125.69
Note The max number of collector is 5.
– Delete DNA collector: no cdb-export collector 1
Configuring NetFlow Export Templates
Creating NetFlow Export Templates
To create NetFlow Export templates:
Step 1 Choose Setup > Data Export > NetFlow .
The NetFlow Export Template page appears.
The Export Configuration page appears.
Step 3 Fill in the fields as described in Table D-34 .
Step 4 Click Submit to save your changes.
Editing NetFlow Export Templates
To edit NetFlow Export templates:
Step 1 Choose Setup > Data Export > NetFlow .
Step 2 Click the template that you want to edit.
Step 4 Modify the information as desired.
Step 5 Click Submit to submit to save the changes.
Deleting NetFlow Export Templates
To delete NetFlow Export templates:
Step 1 Choose Setup > Data Export > NetFlow .
Step 2 Click the template that you want to delete.
Step 4 Click OK to confirm, or Cancel to return to the previous window without deleting.
Sharing Files
This feature allows you to easily access the NAM data files. You can map the NAM as a network drive and it will appear like any other folder in your machine. You will be able to only read and delete the files for security and stability reasons.
Step 1 Check the Enable check boxes to enable the SMB and SFTP file sharing services.
Step 2 Enter the port details for SMB and SFTP services.
Step 3 Select either Share or Hide to share or hide the capture files and scheduled reports.
The dataset access behavior varies between SMB and SFTP. If SMB is enabled, and if the dataset is hidden, the directory will not be visible. If SFTP is enabled, and dataset is hidden, the directory will be visible but you will not be able to access or view any files within it.
Step 4 Click Submit to access the shared files via SMB or SFTP using web-user's username and password.
Using SMB file sharing on Windows
Click Start button and provide the NAM IP address of the shared object. For example, 172.20.124.164 to access the shared files on Windows operating system.
You can also access the files on Linux and set a customized port too.
Using SFTP file sharing on Windows
Windows does not support SFTP by default, you must install a third part FTP application, such as Filezilla to use the SFTP file sharing on windows.;
Step 1 Launch the FTP application and provide the SFTP IP address. For example, 172.20.124.164.
Step 2 Click Quickconnect to access the shared file.
Note TACACS users cannot use the file sharing feature. You have to use NAM's local web-users to access the shared files.
Scheduling Data Report Exports
You can use Prime NAM to schedule data collection over a period of time for trend analysis and troubleshooting activities and then export the reports to be viewed at your convenience. For example, if you see a spike in application response time on a certain day or time you can set up a scheduled report. The report exports collected data from a specific range of time so that you have a snapshot of what might be causing issues.
You can set up scheduled jobs that will generate a daily report at a specified time, in a specified interval, and e-mail it to a specified e-mail address or addresses.
You can also obtain a report immediately by clicking the Preview button, rather than wait for the scheduled time. This report can also be sent after you preview it.

Tip Prime NAM displays time in the preview report based on the browser that initiated the report. So, if your browser is in San Jose, CA, the time zone displayed in the preview report is the San Jose time zone. The scheduled email report shows PrimeNAM server’s time zone.
Creating a Scheduled Report Export
Scheduled export of data reports is a convenient way to collect traffic of interest in Prime NAM. We strongly recommend that you define your data report time range first and then set your export time right after your report end time. This is the most straight-forward way to use this feature.
To set up a scheduled report and export it to an e-mail address or addresses:
Step 1 From any Monitor or Analyze window, click Export in the Interactive Report pane to select your export preferences. If you want the report to contain filtered data, enter the filters before selecting Export .
Step 2 Enter the Report Name and Description. Report name should be at least four characters long.
Step 3 Enter the e-mail address to which you would like the report to be delivered.
Step 4 Choose either CSV or PDF as the delivery option. Note that PDF files are limited to 1000 records.
Step 5 Choose Save to save the report to your local disk.
Step 6 Choose the Report Time by selecting a time range for the interval of time you want data measured. The time range is limited to a 24 hour period. Note that a time range that crosses midnight will have a from time that is larger than its to time. For example, a time range that starts at 11 PM and ends at 1 AM the following day will have a from time of 23:00 and a to time of 01:00.
Step 7 Choose the Export Time, will include the time and day (or days) to export the report. The report can be exported every day or on a particular day (or days). Below are some examples showing which days a time range applies to, based on the export time.
Step 8 Set your Export Time to occur right after the end of Report Time. This gives you the most recent data and is the easiest way to use this feature.
Step 9 Click Submit to submit the request for the scheduled job,or c lick Preview to generate the report immediately.
Note Remember that previewed report results are based on the local time of the browser that initiated the report while the emailed report results are based on the local time of the Prime NAM that generated the report.
Manually Exporting a Scheduled Job
To immediately run and export a report:
Step 1 Choose Setup > Data Export > Scheduled Exports.
Step 2 Click the job you want to manually run and export.
Disabling / Re-enabling a Scheduled Export Job
Scheduled export jobs can be temporarily disabled and then re-enabled. When a scheduled job is disabled, no report will be run for exporting.
To disable a job whose “Enabled” state is “Yes”:
Step 1 Choose Setup > Data Export > Scheduled Exports.
Step 2 Click the enabled job you want to disable.
Step 3 Click Disable. Note that the “Enabled” state will change to “No”
Note The Enabled state will change to No.
To enable a job whose “Enabled” state is “No”:
Step 1 Choose Setup > Data Export > Scheduled Exports.
Step 2 Click the disabled job you want to enable.
Note The Enabled state will change to Yes.
Editing a Scheduled Export Job
Step 1 Choose Setup > Data Export > Scheduled Exports .
Step 2 Click the job you want to edit.
Step 4 Modify the information as desired.
Step 5 Click Submit to submit the request for the scheduled job.
Deleting a Scheduled Export Job
Step 1 Choose Setup > Data Export > Scheduled Exports .
Step 2 Click the job(s) you want to delete.
Step 3 Click Delete to delete the selected job(s), or click Delete All to delete all the jobs.
Step 4 Click OK to confirm, or click Cancel to return to the previous window without deleting the job(s).
Downloading a Saved Report
Step 1 Choose Setup > Data Export > Scheduled Exports .
Step 2 Click Saved Reports tab.
You will be able to view the saved reports in a tabular format.
Step 3 Select the reports that you want to download.
Renaming a Saved Report
Step 1 Choose Setup > Data Export > Scheduled Exports .
Step 2 Click Saved Reports tab.
You will be able to view the saved reports in a tabular format.
Step 3 Select the reports that you want to rename.
Step 5 Fill in the new filename in the dialog box
Deleting a Saved Report(s)
Step 1 Choose Setup > Data Export > Scheduled Exports .
Step 2 Click Saved Reports tab.
Step 3 Click the report(s) that you want to delete.
Step 4 Click Delete to delete the selected job(s), or click Delete All to delete all the jobs.
Step 5 Click OK to confirm, or click Cancel to return to the previous window without deleting the report file.
Accessing Device Interface and Health Details
You can enable your NAM to access interface and health device details if they are available on the device you identify using the Prime NAM Managed Device feature.
This section contains the following topics:
- Understanding How Platform-Specific NAMs Handle Managed Device Data
- Configuring and Viewing Managed Device Information
Understanding How Platform-Specific NAMs Handle Managed Device Data
A managed device can represent a router or switch being monitored by Prime NAM. Depending on your Cisco NAM platform, the managed device is accessed by the NAM differently and may support different MIBs based on the device support.
The following details list how NAM accesses the managed device:
- For a physical or virtual blade or service module, the managed device is the device in which NAM software or hardware is located. The managed device information is automatically updated without user intervention and cannot be modified on the NAM. One of the benefits of having a blade or service module is that there is no configuration required for this feature.
- For a physical appliance, you identify the managed device as a switch or router that shares its traffic using SPAN or user credentials. You must enter the device address and either the SNMP credentials or NetConf credentials to configure the NAM SPAN session on the managed device. On certain platforms, NetConf is an alternative for NAM to configure a NAM SPAN session on a managed device which does not support configuring NAM SPAN sessions using SNMP. If you choose to use NetConf, you must enable NetConf on the managed device interface and enable SSH to support the SPAN session. This enables you to monitor managed device information such as interface statistics.
- All supported NAM platforms, except NAM-NX1 and vNAM, require if-mib (ifTable) to provide the managed device interface data. NAM-NX1 gets this data by exchanging messaging with the Supervisor card (SUP) on the EOBC channel. SPAN session configuration from a managed device is not allowed on Cisco Prime vNAMs.
- All supported NAM platforms, except for NAM-NX1, vNAM, and NAM appliance platforms, require entity-mib and if-mib to get and configure SPAN sessions. NAM-NX1 uses EOBC and proprietary messages with SUP on EOBC to get and configure SPAN sessions. Appliances have two options to get and configure SPAN sessions: SNMP (which use the MIBs required by the other NAM platforms) or NetConf interface (which require no MIBs). SPAN session configuration from a managed device is not allowed on Cisco Prime vNAMs.
- For RISE, the managed devices are Nexus 7000 series switches. The Nexus switches support RISE feature and are directly or indirectly connected to the NAM appliance in RISE mode and configured accordingly. With supported SUP software version, the setup is plug-n-play, and no additional configuration is required on the NAM side. See the RISE NAM configuration section in Cisco Remote Integrated Services Engine with Cisco Prime NAM and Cisco Nexus 7000 Series Switches Configuration Guide for more details.
To see a list of the available platforms and supported devices, see the NAM Compatibility Matrix . For MIB support, see Table D-76.
Configuring and Viewing Managed Device Information
The managed device information that is required is dependent on your platform device type. For details, see Understanding How Platform-Specific NAMs Handle Managed Device Data.
For details on how to ensure NAM is managing your device interface and other traffic, see:
Configuring Managed Device Information on Blades or Modules
You are not required to configure NAM blades or modules on the NAM side.
Note NAM-3 platform requires SNMP MIBS (SNMPv3 is not required). SNMP requests and responses are communicated over an internal interface within the chassis and SNMPv3 is not used. NAM-NX1 requires some SNMP MIBs.
Ensure you follow the configuration instructions in your platform documentation so that your managed device communicates network traffic to NAM.
Once NAM automatically updates your managed device details, you can view that information using Setup > Managed Device > Device Information . For details, see Viewing Managed Device Information.
For details about how NAM treats managed devices, see Accessing Device Interface and Health Details.
Configuring Managed Device Information on Virtual Platforms
For some virtual NAM platforms, you must set up your managed device using the NAM Setup > Managed Device > Device Information window. Enter your device address and credentials to allow NAM SPAN session configuration. You need to configure SNMP credentials to receive details about managed device interface statistics. You may need to configure NetConf credentials to enable a NAM SPAN session to and from the managed device. To use NetConf, your managed device must support the NetConf interface and have SSH enabled. You can use NetConf as an alternative to configuring a NAM SPAN session on your managed device if your device does not support configuring NAM SPAN sessions via SNMP.
Note This section applies to all Cisco NAM platforms except the NAM-NX1 and NAM-3 blades. SPAN session configuration via managed device is not allowed on vNAMs.
To set your managed device parameters:
Step 1 Choose Setup > Managed Device > Device Information .
Depending on your managed device, the Switch System Information displays as shown in Table D-20 .
Step 2 Click Test Connectivity to perform an SNMP test. Click Close when finished.
Step 3 Click Submit to submit the information and close the window.
Enabling Multi-Managed Device Feature
This feature is available on NAM 2404 appliances. By default, these NAM appliances support a single managed device, which could be either a Cisco Catalyst 6000 or Nexus 7000 switch. When the multi-managed device feature is enabled, the NAM appliance instead supports one Catalyst 6000 switch per data port.
To enable the multi-managed device feature:
Step 2 Enter the command
managed-device multiple
.
To disable this feature, enter the command
no managed-device multiple
.
After you enable this feature, the following NAM GUI pages will have a different layout compared to the default single managed device GUI layout:
- Setup > Managed Device > Device Information
- Setup > Traffic > SPAN Sessions
- Analyze > Managed Device > Interface
Additionally, the Analyze > Managed Device > Health GUI page will no longer be available.
Configuring a Managed Device per NAM Data Port
After you enable the multi-managed device feature, you can use the NAM GUI or CLI to configure a single managed device per NAM data port.
Note The multi-managed device feature supports only Cisco Catalyst 6000 series switches as managed devices. For Nexus 7000 series switches, RISE provides similar functionality.
For details on RISE configuration, see Cisco Remote Integrated Services Engine with Cisco Prime NAM and Cisco Nexus 7000 Series Switches Configuration Guide .
To configure the managed device for a NAM data port using NAM GUI:
Step 1 Choose Setup > Managed Device > Device Information .
The Device Information window shows a list of managed devices that are currently setup in the NAM. A managed device that does not have a DATA PORT associated with an interface on that managed device will have an empty “Data Port” column. When the device is set correctly, the column shows the DATAPORT mapping to the interface of the device.
In the screen shot show below, interface Gi1/7 of device 172.20.124.160 is physically connected to the NAM’s DATAPORT3 data port.
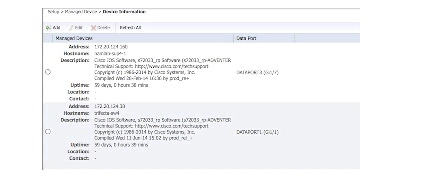
Step 2 Click the Add button to add a managed device for NAM data port.
See Table D-35 for field descriptions.
Step 3 To add a managed device, you can use the Test Connectivity button to test its connectivity.
To edit a managed device using NAM GUI:
Step 1 Choose Setup > Managed Device > Device Information .
Step 2 Select the managed device by clicking the radio button, and then click Edit .
See Table D-35 for field descriptions.
Step 3 To add a managed device, you can use the Test Connectivity button to test its connectivity.
Note For the NAM to configure a SPAN session, it must know the managed device's interface which the NAM’s DATA PORT is physically connected to. The NAM takes if-index values only. Please use the switch CLI command, show snmp mib ifmib ifindex, to find the interface if-index value for the interface connected to the NAM and enter the value in the NAM’s GUI.
The managed device in the screen shot below is 172.20.104.110, and NAM’s DATA PORT1 is physically connected to GigabiEthernet2/3. To find the if-index value, the switch’s CLI command will show the following:
Figure 7-2 Edit Managed Device

Caution If the mapping from NAM data port to NAM managed device interface is not set correctly, network functions on the NAM managed device (e.g. Cisco Catalyst 6000 switch) may be disrupted while configuring a SPAN session for the NAM data port.
Caution If SNMPv3 is desired, both Auth Password, Privacy Password must be at least 12-characters long.
To configure the managed device for a NAM data port using the NAM CLI instead:
- For SNMPv2, use the command managed-device snmp-v2c .
- For SNMPv3, use the command managed-device snmp-v3 . After entering the snmpv3 subcommand mode, enter ? to display a list of subcommands. Use the appropriate subcommands to configure the SNMPv3 parameters as necessary, then use exit to exit from the subcommand mode and apply the settings.
You can configure a SPAN session only from NAM GUI.
To add or configure a SPAN session for a managed device:
Step 1 Choose Setup > Traffic > SPAN Sessions .
The window shows a list of SPAN sessions that are currently configured on the managed device.
Step 2 Select a managed device from the drop-down list.
Step 3 Click the Add to add a SPAN session.
The Create SPAN Session window appears.
Step 4 Fill in the appropriate information in the Create SPAN Session window.
See Table D-1 for field descriptions.
Step 5 Click Create to create the SPAN session for the selected managed device.
Note If the SPAN configuration has been modified from the managed device side, those changes will not be reflected in the NAM GUI automatically. Click the Refresh button before making SPAN configuration changes to ensure that up-to-date SPAN session information is displayed.

Warning Limitations on SPAN sources, destinations, and traffic rates vary by Catalyst 6000 system and IOS image. Refer to the SPAN configuration document of your managed device to avoid network problems due to SPAN oversubscription.
Configuring Managed Device Information on RISE Appliances
For some NAM appliance in RISE mode, you must set up your managed device using the NAM Setup > Managed Device > Device Information window.
To edit your managed device parameters:
Step 1 Choose Setup > Managed Device > Device Information .
The managed devices and the VDC details appear.
Step 2 Select the short term interval from the Managed Device Interface Stats drop-down list and click Submit .
When you modify the interval, the existing data will be removed.
Step 3 Select the managed device and click Edit .
Step 4 Select the VDC which you want to enable/disable and click Enable/Disable . To delete or refresh VDC details, click Delete or Refresh .
Viewing Managed Device Information
To view the system information for each managed device, choose Setup > Managed Device > Device Information .
Depending on your platform, the System Information may display some or all of the fields shown in Table D-19 .
Viewing Managed Device Interface Statistics
NAM allows you to view the interface statistics of one managed device at a time. Once the managed device is configured, NAM will periodically perform SNMP polling and provide a historical view of traffic statistics on the managed device interface. To view the interface statistics of another device, click the Filter button in the Interactive Report window, and select the desired managed device.
To view the interface statistics of a managed device:
Step 1 Choose Analyze > Managed Device > Interface .
Step 2 Select a managed device from the Managed Device drop-down list.
Step 3 Select the desired time range from the Time Range drop-down list.
Step 4 Click the Submit button.
The window shows a graphical representation of interface statistics of the device across the specified time range. The Interface Statistics line chart is updated upon selection of a row in the Interface Statistics table.
Configuring Network Parameters
This section describes how to set up the network parameters including:
Configuring Sites
Cisco Prime Network Analysis Module makes it easier to monitor traffic and identify issues across your network by providing a way to manage large campuses using different views of your network, referred to as sites .
A site is a collection of hosts (network endpoints) partitioned into views. You can limit the view of your network analysis data to a specific city, a specific building, or even a specific floor of a building, and can use sites to focus collection and analysis of data. Sites are optional, but recommended.
Defining a Site
A site can be defined as a set of subnets specified by an address prefix and mask, or using other criteria such as a remote device data source (for example, remote WAE device and segment information).
Configuring Sites Using Subnets gives specific information about various scenarios.
Step 1 Choose Setup > Network > Sites and click Create .
Step 2 The Site Configuration window appears. Enter a Name, Description, Subnet, and Data Source as appropriate.
See Table D-23 for field descriptions.
Step 3 Enter the subnet and data source, then click Detect to tell the software to look for subnets in the traffic. See Detecting Site Subnets.
Note The “Unassigned” site (with a description of “Unclassified hosts”) includes any that do not match any of your site configurations. Sites are classified at the time of packet processing.
Detecting Site Subnets
When you click the Detect button at Setup > Network > Sites > Sites Configuration , Prime NAM looks for subnets detected within in the past hour. See Table D-22 for information about the fields.
When you click Detect , Prime NAM finds those subnets that meet the criteria that you entered.
Viewing Defined Sites
To view already-defined sites:
Step 1 Choose Setup > Network > Sites .
Step 2 The Sites window appears. Defined sites will be listed in the table.
The fields are described in Table D-24 .
Editing a Site
You can edit sites that have been created. The Unassigned site cannot be edited or deleted.
Step 1 Choose Setup > Network > Sites .
Step 2 Highlight the site that you have configured.
Step 3 Click Edit and edit the desired field.
The fields are described in Table D-24 .
Step 4 Click Submit to save the changes, or click Reset and OK to reinstate the site’s previous settings, or click Cancel to cancel any changes and return to the main Sites page.
Configuring Sites Using Subnets
The site definition is very flexible and can accommodate various scenarios. Prime NAM uses the site definition not only for viewing of data, but for data export and data retention as well. The same rule cannot be defined in multiple sites. That is why the preferred way is to define a site using its subnets. See Table 7-2 for examples of site definitions.
Note VLAN option is removed from the Site definition.
For details on how Prime NAM resolves overlapping IP addresses, see Resolving Ambiguity (Overlapping Site Definitions)
Resolving Ambiguity (Overlapping Site Definitions)
Conflicting rules are not allowed in site definitions. Of the following two scenarios, the second one is not allowed.
1.2.3.0/24 from DATASOURCE1 = SiteA
1.2.3.0/24 from DATASOURCE1 = SiteB
Using a prefix is the preferred method. Data source is secondary. In the following two scenarios, the first would receive the higher priority.
The longest prefix has higher priority (same data source). In the following two scenarios, the first would receive the higher priority.
1.2.3.0/24 from DATASOURCE1 = Site A
1.2.0.0/16 from DATASOURCE1 = Site C
The more refined (specific) rule has higher priority. In the following two scenarios, the first would receive the higher priority.
Setting Interface Speed using NetFlow Interface Capacity
After you have set up NetFlow data sources (see Forwarding NetFlow Traffic), you can go to the NDE Interface Capacity window at Setup > Network > NDE Interface Capacity to specify the speed of each interface. This allows the software to calculate interface utilization on the NDE Interface Traffic Analysis window ( Analyze > Traffic > NDE Interface ). Otherwise, the Prime NAM software can only display the throughput of the interface, but cannot show its utilization.
The interface name and speed will be automatically discovered by the Prime NAM if you configure the device SNMP credentials in Setup > > Create > Type: NETFLOW .
To add a new or edit an existing interface, continue to Creating or Editing a NetFlow Interface.
Creating or Editing a NetFlow Interface
To add a new interface if it has not been automatically discovered, at the NetFlow Data Export (NetFlow) Interface Capacity window ( Setup > Network > NDE Interface Capacity ), click Add . Then fill in the fields as described in Table D-25 .
Note It is normally not necessary to manually create NetFlow interfaces. They should be discovered automatically when the device sends NetFlow packets to the NAM.
To edit an existing interface, choose the device, then click Edit . Fill in the fields as described in Table D-25 .
Configuring DSCP Groups
Differentiated services monitoring (DiffServ) is designed to monitor the network traffic usage of Differentiated Services Code Point (DSCP) values. To monitor DSCP, you must configure at least one aggregation profile, and one aggregation groups associated with each profile. This section describes how to set up the DSCP groups.
You can define two or three different groups of traffic, and assign the various DSCP values to each group. Or you can assign one particular value for the first group and give it a name, and then assign all the rest to the other (or default) group and give that a name.
For detailed information about setting DSCP values, see
Implementing Quality of Service Policies with DSCP
:
http://www.cisco.com/en/US/tech/tk543/tk757/technologies_tech_note09186a00800949f2.shtml
The following tasks help you set up and manage the DSCP groups:
Creating a DSCP Group
Step 1 Choose Setup > Network > DSCP Groups .
The DSCP Groups table displays.
The DSCP Group Configuration window displays.
Step 3 Fill in the fields as described in Table D-26 .
Table D-27 shows the available formats and associated values.
Step 4 Click Submit to save your changes.
Configuring Application Classification
Prime NAM provides two ways of enhancing how your traffic is displayed in the dashboard and reports. Prime NAM uses application classification to:
- Expand the number of application’s for which Prime NAM can provide down to Layer 7 application details. See Adding More Detail into Dashboard and Application Reports.
- Create custom applications using a list of rules based on HTTP URL or Server /Port definition. This is referred to as the classic application classification model. See Creating Deeper Visibility Into Application Traffic.
You can use one or both of these methods to ensure Prime NAM provides the level of traffic detail you need.
Adding More Detail into Dashboard and Application Reports
You can add more detail enable deep packet inspection to see Layer 7 application visibility by using application classification. To understand more about application classification and Layer 7 application visibility, see About Deeper Application Classification.
In order to enable application classification for deep packet inspection in Prime NAM:
Step 1 Choose Setup > Classification > Applications Settings . Then select the Deep Packet Inspection check box in order to enable your Prime NAM dashboards to display key critical details, such as hostname and port, in your traffic captures and reports.
Step 2 (Optional). Select New in the Protocol Pack pane to download the latest NBAR2 Protocol Pack (PP). The PP is a single compressed file that contains the rules used for classifying traffic when Deep Packet Inspection is enabled. Prime NAM stores the default plus one additional PP.
Step 3 Enter the PP URL to download the PP files.
This URL supports ftp, http[s], scp, and sftp protocols. The User Name and Password fields are used only if the server requires authentication. Alternatively, the username and password can be specified directly within the following URL:
ftp://username:password@hostname/
You can also download the PP files under the Cisco Prime Network Analysis Module Software product links at the CCO software download location at following URL:
http://software.cisco.com/download/navigator.html

Timesaver Use Downloads Home >Products > Cloud and Systems Management > Network Analysis Module (NAM) Products > Cisco Prime Network Analysis Module Cisco Prime Network Analysis Module Software to locate the protocol pack.
Step 4 To revert back to the default protocol when a previous protocol pack is no longer needed, choose Restore Default .
About Deeper Application Classification
This release of Prime NAM method allows you to see more details in your monitoring dashboards and packet captures (including application names, interface details, and so on).
To expand the level of application information your Prime NAM can monitor and analyze, enable the deeper level of application classification and download application signature updates when you need them.
In addition to providing the application name, this method also brings attributes to simplify application management for both classification and reporting. Application categorization, for example, allows the grouping of similar applications.
When this method is enabled you can view extracted information from applications such as HTTP URL, HTTP User Agent, and SIP URL, for export or classification.
Note Depending on your installation or upgrade method you may need to enable deep packet inspection.
You can use protocol packs to add new and update existing application signatures. NAM support of protocol packs allows you to see any new and updated application signatures in Prime NAM traffic monitoring. For more details on Protocols Packs, see About Protocol Packs and Application Classification.
You can also use the Prime NAM CLI to change the classification status to use the deeper application classification method and check which classification setting your NAM is using.
For details about what application signatures are in specific protocol pack versions, see Network-Based Application Recognition Q&A on Cisco.com.
For details on enabling deep application classification and updating protocol packs using the CLI, see the Cisco Prime Network Analysis Module Command Reference Guide .
About Protocol Packs and Application Classification
Prime NAM uses Cisco’s Network-Based Application Recognition to recognize and classify a wide variety of protocols and applications, including web-based and other difficult-to-classify applications and protocols that use dynamic TCP/User Datagram Protocol (UDP) port assignments. The support of Protocol Packs (PP) allow you to update your application signatures so that dashboard and traffic data provide the most detailed information available. Prime NAM Protocol Packs can be found in the CCO software download location. These are the only protocol packs you should use with Prime NAM.
You do not need a license to download a protocol pack for Prime NAM. For this release, updating the protocol pack may cause a temporary interruption of operation for several seconds, similar to changing the system time.
To view the Prime NAM Protocol Pack version, choose Setup > Classification > Applications Settings .
To turn on deep application classification in Prime NAM, choose Setup > Classification > Applications Settings and select Deep Packet Inspection . For details, see Adding More Detail into Dashboard and Application Reports.
If you choose not to use the deep application classification method, Prime NAM defaults to a less comprehensive classification method that may not include all applications or protocols.
About NAM Classic Deep Packet Application Classification
This section covers how you can customize your Prime NAM to provide a deeper level of visibility into the application data presented in the dashboard and reports.
Prime NAM uses the application ID classification system. When defining applications, you can view and select from a list of protocols and port numbers, and candidate IP addresses and port numbers for the traffic being analyzed. You can also create URL-based application classifications. For an in depth overview of application types, see Understanding Application Traffic.
You can also configure custom applications using the Application Programming Interface (API), also referred to as the North Bound Interface (NBI). This is needed to ensure uniform application classification across a number of NAMs. See your customer service representative for details on how to get access to the NBI documentation.
Creating Deeper Visibility Into Application Traffic
This section provides details into the application classification method known as Network Based Application Recognition (NBAR) classic.
You can use Prime NAM to monitor pre-determined or custom applications in your Data Center so that your traffic analysis is more focused and therefore optimal.
Without configuring application classification, applications running on a certain servers or specific ports are classified as unknown . This means that you may not have enough insight into the monitoring traffic. After configuring your application or ports, you can gain visibility into those application details on the monitoring screens. Similarly for the URL-based applications, instead of having all web traffic being grouped under the HTTP URL, you can specify a more granular layer of monitoring by using the application and port.
This section describes the following tasks:
- Creating Custom Applications
- Editing Custom Application Classifications
- Adding More Detail into Dashboard and Application Reports
- Deleting an Application Rule
- Understanding Application Traffic
To find out more about Layer 7 visibility and deep packet inspection, see Adding More Detail into Dashboard and Application Reports.
Creating Custom Applications
You can create a custom applications using the list of rules based on HTTP URL, Protocol, or Server IP addresses. If you create a custom application, you can later edit it if you choose. Standard, pre-defined applications cannot be edited.
For details on application types or other options, see Understanding Application Traffic.
To create a new application classification:
Step 1 Choose Setup > Classification > Applications and select Create ..
For a description of the Applications window, see Table D-29 .
Step 2 Enter an application classification name.
Step 3 (Optional) Enter an application description that gets displayed in the view table. There is a 75 character limit.
Step 4 (Optional) You can skip the Selector value. This is an arbitrary number, unique within an engine-id. It will be automatically assigned if left blank.
Step 5 Select the application classification rule type drop-down menu.
a. To choose a Server/Port application rule, select Server/Port in the Application Classification Rule drop-down menu.
Then select the definition drop-down menu to enter the following required information.
– To choose a Server, Protocol, and Port or Port Range, select the drop-down menu then enter the required information.
– To choose a protocol, select Any , TCP , UDP , or Both TCP & UDP .
– To choose a port or port range, enter the required information.
b. To choose the URL-based application rule, select HTTP URL in the Application Classification Rule drop-down menu then enter the required information. (See Understanding URL-Based Application Classification for additional field details.)
Tip You can also add or remove multiple rule definitions to this application classification by clicking the gear icon and selecting Insert new rule or Delete.
Step 6 Click Submit to create the new application classification signature.
You can now monitor the new applications using the Interactive Report filter with the application dashboards.
Editing Custom Application Classifications
In Prime NAM you can only modify the custom, or user-defined, applications, and not the preconfigured system applications. You can only edit an application for which it states Custom in the Engine ID column.
Step 1 Choose Setup > Classification > Applications .
Step 2 Select the application to edit, and click Edit .
The Application configuration window displays.
Step 3 Make the desired changes.
Step 4 Do one of the following:
Deleting an Application Rule
You may want to delete an application rule when you are no longer using it in your network.
To delete an application rule, simply select it from the Application list, then click Delete .
You cannot delete preconfigured system applications, only custom applications.
Understanding Application Traffic
This section contains information on application types, rules, and other details you may find helpful.
There are two types of application classification rules:
1. Server/Port rules defines a a server IP address. For server-based application classification, Prime NAM analyzes traffic for the candidate IP addresses and port number or numbers you specify. You can also define port or protocol-based application (for example, based on a TCP port). You can create additional ports to enable Prime NAM to handle additional traffic for standard applications. Port ranges for IP are 1-255 for IP. TCP and UDP port ranges are1-65535.
2. HTTP-based URL rules define URL-based application extensions to the existing list of supported applications. When the URL in an HTTP request matches the criteria of a URL-based application, the traffic is classified as that protocol. The HTTP request is a URL on any port that is part of the iana-l4:http protocol, or protocol named http under the iana-l4 engine ID.
Tip To create Protocol or Server IP Address applications, you can check the Application Configuration table in Analyze > Traffic > Application. To create an HTTP URL-based application, you can analyze the incoming URLs on Analyze > Traffic > URL Hits. NBAR is enabled through CLI and GUI.
Prime NAM recognizes an application based on either:
- An application which resides on a specific server IP address—You can filter using an IP address, a protocol, and a port or range of port numbers. After configuring the server information, the monitoring dashboard displays more detailed application information instead of just the unknown grouping.
- A set list of application IDs—The protocol, port number, or port number range, along with the focused inspection of traffic (for example, voice signaling traffic or FTP), heuristics (for example, DCE-RPC or SUN-RPC), or standardized application identifiers exported by Cisco platforms with NetFlow.
If Prime NAM is not able to recognize an application using any of these mechanisms, the application type of the traffic is reported as unknown . You can configure the application reported as unknown to create custom applications.
- A custom application based on a URL-based HTTP request—You can include URL Host, or URL Path and allows you to gain additional visibility instead of grouping all web traffic HTTP. For details, see Understanding URL-Based Application Classification.
To add custom applications and view or edit any user-defined applications, choose Setup > Classification > Applications .
Caution There is no limit on the number of URL-based applications that can be created. It is important to consider that these types of applications use large amounts of CPU bandwidth and may impact your performance if too many are defined.
Table D-29 describes the fields on the Applications view page.
Understanding URL-Based Application Classification
URL-based applications are extensions to the list of applications. When the URL in an HTTP request (a URL on any port that is part of the iana-l4:http protocol, or protocol named http under the iana-l4 engine ID) matches the criteria of a URL-based application, the traffic is classified as that protocol. The device interface statistics are collected by regularly (once a minute) polling the ifTable statistics of all interfaces on the managed device.
A URL-based application can be used the same way as any other application. For example, a URL-based application can be used in collections, captures, and reports.
An incoming URL is matched against the criteria of the configured URL-based applications in the order of the selector in ascending order. When a match is found, the remaining URL-based applications are not considered.
A URL consists of the following parts:
Tip Content-type argument should rarely be used in combination with the other two fields. It can be used alone, for example to identify WAP traffic you could define an application with a content type of *wap.*. In almost all other cases, we recommend you use host and path only.
Example—Creating an URL-Based Application
This example provides steps on how to create a URL to allow you to control the displayed traffic data. For example, the URL www.cisco.com/go/nam are broken down when sent to the web server into two fields: a host field (www.cisco.com) and a path field (/go/nam). By defining different values for the fields in the application, you can control the granularity of URLs that are classified as this new application. If you want to group all traffic to www.cisco.com together and only define the host part, then use the host only part. If you have multiple hosts that map to the same end resource and only want to define the path part., then use only the path entry ( go/nam ).
To collect traffic for a particular host and path for the URL http://cisco.com/go/nam enter:
- the host part is host.domain.com , for example, Cisco.com
- the path part is /go/nam
- the argument part is null/empty
In the configuration of an URL-based application, the path part and the argument path are combined and called the path part. For detailed descriptions, see Table D-33 .
Note The host, path, and argument parts of a URL are matched against the corresponding POSIX regular expressions specified in the application definition. For details on regular expression syntax, refer to the IEEE Std.
Configuring Application Groups
An application group is a set of applications that can be monitored as a whole. The following topics help you set up and manage the application group:
Creating an Application Group
To create an application group:
Step 1 Choose Setup > Classification > Application Groups .
The Application Groups window displays.
Step 2 Click Create and enter the name in the Application Group Name field.
Step 3 Use the next Application field and the Filter button to narrow the list of selectable applications. For example, if you enter bittorrent , all applications with that name appear in the list below.
Step 4 Select an application and click Add . Applications appear in the Selected Applications box.
You can select multiple applications at once by using the Shift button, and then click Add.
Step 5 Click Submit to save your changes.
Editing or Deleting an Application Group
To edit or delete an application group:
Step 1 Choose Setup > Classification > Application Groups .
Step 2 Select the Application Group by clicking the radio button, then click Edit or Delete .
Note You can only delete one application group at a time.
Deleting an Application Group
To delete an application group, simply select the application and then click the Delete button.
Filtering Encapsulations
Using encapsulation gives you increased flexibility when trying to view different types of application traffic (such as counting or grouping). The encapsulation settings affect how traffic of certain IP-based tunneling protocols are treated.
You can use this software to set up the way you want to view different types of encapsulations in network traffic for the following protocols:
- CAPWAP Data—Control And Provisioning of Wireless Access Points
- ERSPAN—Encapsulated Remote Switched Port Analyzer
- FabricPath
- GRE—IP over GRE tunneling (Generic Routing Encapsulation)
- GTP—GPRS (General Packet Radio Service) Tunneling Protocol
- IP.IP4—IP4 over IP4/IP6
- IP.IP6—IP6 over IP6
- IPESP—IP with Encapsulating Security Payload
- L2TP Data—Layer 2 Tunneling Protocol
- LISP Data—Locator/ID Separation Protocol
- LWAP Data—Lightweight Access Point Protocol
- MPLS—Multiprotocol Label Switching
- OTV—Overlay Transport Virtualization
- PPPoE—Point to Point Protocol over Ethernet
- Segment ID—Rule to match one or more fields with a regular expression.
- SGT—Security Group Tag
- VNTAG—Virtual Network Tag
- VxLAN—Virtual Extensible LAN
Step 1 Select Analyze > Traffic > Encapsulation .
Step 2 From the Interactive Report pane, click Filter to display the filter options,
Step 3 Use the available options to select filtering for the encapsulation traffic reports. Unavailable options will be grayed out.
Step 4 Enter whether you want to include filtering on the site and specify the data source.
Step 5 Select encapsulation options to filter on including the time range.
Step 6 If you add a filter name, the filter is saved below the Interactive Report pane for reuse.
Step 7 Click Submit to run the filter and update the Encapsulation Traffic graphs and Top N dashboards based on your filter settings.
If you want to revert to the previous settings since your last submission, click Reset .
Setting Up Prime NAM Monitoring
This section discusses how to set up monitoring over and above the default monitoring parameters. You can customize these monitoring parameters.
To set up Prime NAM monitoring perform these tasks:
- Setting Aggregation Intervals
- Configuring Response Time
- Setting Up Media Monitoring
- Creating RTP Filters
- Configuring URL Collections
- Enabling a URL Collection
Setting Aggregation Intervals
Prime NAM has short-term and long-term aggregation intervals (this was referred to as long-term reporting in earlier NAM releases). Aggregated data is displayed in the dashboards if the query is longer than one day.
The purpose of gathering short term aggregation interval data is for troubleshooting. It has a finer granularity than long term data (by default, the short term aggregation interval for Traffic/Media is one minute, the interval for RTP data is one minute, and short term response time interval is five minutes).
The purpose of gathering long term interval data is for trending analysis. The smallest aggregation interval for long term data is one hour (60 minutes).
Caution If you modify the aggregation intervals, existing collected data that is not in the same aggregation interval will be completely removed. Data will then start being collected from the beginning again at the moment the intervals are modified and applied.
Traffic and Media refer to applications, hosts, RTP streams, and voice calls monitoring. Response Time refers only to application response time. Prime NAM does not support long term aggregations of data for the following media: conversations, RTP streams, and voice signaling calls monitoring.
To set up aggregation intervals:
Step 1 Choose Setup > Monitoring > Aggregation Intervals .
Step 2 Choose the desired durations for Short Term Interval and Long Term Interval.
Step 3 Check the Collect only hosts from user-defined sites (exclude hosts from Unassigned site) check box if you want the Prime NAM long term data to contain information only for hosts classified to the user-defined sites. This check box only applies to the long term data; short term always collects all hosts.
Note Enabling the “Collect only hosts from user-define sites” option can significantly speed up report queries, because it excludes unclassified hosts’ statistics from the database.
When you first start the NAM, in monitoring windows that show site information, you will see a site named “Unassigned” and with a description of “Unclassified Hosts.” The Unassigned site includes any that do not match the site configurations. By default, long-term storage will include data for all sites, including the Unassigned site. In some cases, you may not want to view long term data of hosts that are not in your network, in which case you would check the check box.
The aggregation intervals determine how much data can be stored in the Prime NAM database. See Table 7-3 for information about short and long-term data retention. This calculation is based on a worst case scenario where tables are full or almost full. It is based on recommended database sizes.
Long-Term Aggregated Data (Normal)1
|
||||
|---|---|---|---|---|
Configuring Response Time
To configure the timing parameters for response time data collections:
Step 1 Choose Setup > Monitoring > Response Time .
The Response Time Configuration page displays. The settings you make on this window comprise the time distribution in microseconds for the detailed Response Time data collection.
Step 2 Check the Enable Response Time Monitor check box.
Step 3 After Monitored Server Filter, you will see Disabled or Enabled . Click Configure Filter to configure a filter if you need to enable your monitor server filter.
Step 4 Enter the Response Time values as described in Table D-31 .
Step 5 Accept the default settings or change the settings to the values you want to monitor. Click Submit to save your changes.
Setting up Voice Monitoring
You can use the Mean Opinion Score (MOS) to quantify the perceived level of quality you are receiving in your network voice traffic. This allows you to assess the work of codes, or algorithms, which compress audio traffic to save on bandwidth utilization but may result in a drop in quality.
After you set up the software to monitor voice data, you will be able to view the collected voice data under Analyze > Media . For more information on viewing the voice data, see Analyzing Media.
Note Voice monitoring features are supported with Cisco IP telephony devices only.
Step 1 Choose Setup > Monitoring > Media .
The Media Monitoring page displays.
Step 2 Check the Enable Call Signal Monitoring check box.
Step 3 Accept the default MOS Score value range or modify the values as you prefer. See Table D-32 .
Note To report jitter and packet loss for the SCCP protocol, you must enable CDR on Cisco Unified Communications Manager. For more information on Cisco Unified Communications Manager, see the Cisco Unified Communications Manager documentation.
http://www.cisco.com/en/US/products/sw/voicesw/ps556/tsd_products_support_series_home.html
Step 4 Click Submit to save your changes, or click Reset to cancel and revert to the previous settings.
Setting up Video Monitoring
You can use the Media Delivery Index (MDI) to quantify the perceived level of quality you are receiving in your network video traffic. This allows you to assess the work of codecs, or algorithms, which compresses audio traffic to save bandwidth utilization but may result in a drop in quality. After you set up the software to monitor video conversation data, you will be able to view the collected video stream data under Analyze > Media .
Step 1 Choose Setup > Monitoring > Media .
The Media Monitoring page displays.
Step 2 Check the Enable Video Signal Monitoring check box.
Step 3 Accept the default MDI quality range or modify the values as you prefer. See Table D-32 .
Step 4 Accept the default codec streams quality range or modify the values as you prefer.
Step 5 Click Submit to save your changes, or click Reset to cancel and revert to the previous settings.
Note You can enable the video signaling monitoring only when voice signaling monitoring is enabled, and when you disable voice signaling monitoring, video signaling monitoring also gets disabled.
Creating RTP Filters
When the software is initially started, RTP stream traffic will automatically start being monitored. Prime NAM enables you to monitor all RTP stream traffic among all SPAN traffic, without having to know the signaling traffic used in negotiating the RTP channels. RTP Stream Monitoring is enabled by default under Setup > Monitoring > RTP Filter . To disable it, uncheck the Enable RTP Stream Monitoring check box and click Submit to apply the change.
Step 1 Choose Setup > Monitoring > RTP Filter .
Step 3 From the drop-down menu, choose the protocol (IP or IPv6).
Step 4 Enter the Source Address, Source Mask, Destination Address, and Destination Mask.
Configuring URL Collections
The URL collection listens to traffic on TCP port 80 of a selected data source and collects URLs. Any protocol which has its master port set to TCP port 80 can be used for URL collections. URL collection can be enabled on multiple data sources such as Data Port(s), CEF Data Port(s) and ERSPAN.
A URL, for example: http://host.domain.com/intro\?id=123 , consists of a host part ( host.domain.com ), a path part ( intro ), and an arguments part ( ?id=123 ).
Note Since the argument is matched against a regular expression, a literal ?id=123 is not a valid regular expression. The ? needs to be escaped with a backslash character, \ , so the actual regular expression needed is \?id=123.
The collection can be configured to collect all parts or it can configured to collect only some of the parts and ignore others.
Enabling a URL Collection
Step 1 Choose Setup > Monitoring > URL.
Step 2 Provide the information described in Table D-33 .
You can enter a partial name of a data source and click Filter to find data sources that match. Choose Clear to return to the entire list of data sources.
Note Depending on which radio button option is collected, the format of the URL varies. For example, the leading http: part is only present if the host part is collected. Keep this variable in mind, when configuring a match only expression.
Step 3 Check the Recycle Entries check box to recycle entries.
Step 4 Select the check box for one of the following:
- Collect complete URL (Host, Path and Arguments)—You might use this if you are a network security engineer and suspect a virus infection may be caused by a website. This information could be used to identify which web page has the virus embedded and how it may have spread. It can also be shared for further analysis to help create a solution to stop the spread.
- Collect Host only (ignore Path and Arguments)—You might use this if your network administrator changed your firewall policies to block certain hosts.
- Collect Host and Path (ignore Arguments)
- Collect Path and Arguments (ignore Host)
- Collect Path only (ignore Host and Arguments)
Step 5 Click Submit to save your changes, or click Reset to cancel.
Changing a URL Collection
Step 1 Choose Setup > Monitoring > URL .
Step 2 Change the URL Collection Configuration field information as described in Table D-33 .
Note Changing any parameters and applying the changes flushes the collected URLs and restarts the collection process.
Step 3 Click Submit to save your changes, or click Reset to cancel.
Disabling a URL Collection
When you disable URL collection monitoring, all collection stops immediately and any collection that was in progress is deleted.
Step 1 Choose Setup > Monitoring > URL .
Step 2 Uncheck the Enable check box.
Enabling Transaction Analysis Monitoring
Transaction analysis for a particular protocol must first be enabled before it can be viewed on the Monitor > Overview > Transaction Summary page or on any of the pages under Analyze > Transaction.
To enable (or disable) transaction analysis monitoring for a particular protocol, follow the steps below:
Step 1 Choose Setup > Monitoring > Transaction Analysis.
Step 2 Check the Enable check box for the protocols that you want to monitor.
Uncheck the check box for protocols you want to stop monitoring
Step 3 Click Submit to save your changes, or Reset to cancel and revert to the previous settings.
 Feedback