- Overview
- Getting Started
- Monitoring and Analyzing Traffic
- Capturing and Decoding Packets
- Performing User and System Administration
- Understanding NAM Deployment
- Customizing Cisco Prime NAM
- Understanding Prime NAM Traffic Sources
- Configuring NAM Security
- Understanding Prime NAM Behavior Reference
- GUI Field Descriptions
- Troubleshooting Network and NAM Issues
Cisco Prime Network Analysis Module User Guide, 6.4(1)
Bias-Free Language
The documentation set for this product strives to use bias-free language. For the purposes of this documentation set, bias-free is defined as language that does not imply discrimination based on age, disability, gender, racial identity, ethnic identity, sexual orientation, socioeconomic status, and intersectionality. Exceptions may be present in the documentation due to language that is hardcoded in the user interfaces of the product software, language used based on RFP documentation, or language that is used by a referenced third-party product. Learn more about how Cisco is using Inclusive Language.
- Updated:
- February 1, 2015
Chapter: Understanding Prime NAM Behavior Reference
- Menu Bar
- Filters
- Displaying Detailed Views
- Accessing Context Menus
- Performing a Quick Capture
- Determining How to Use Sites to View Data
- Filtering Traffic for Viewing on the Dashboards
- Filtering Data Using Global Search
- Switching Chart Formats Using the Chart View / Table View
- Accessing Other Tasks Using Mouse-Over for Details
- Changing the Time Interval Using Zoom/Pan Charts
- Using Sort Grid to Change Sort Order
- Displaying Bits or Bytes or Packets in Charts
- Statistics
- Context-Sensitive Online Help
- Feedback
- Subscribing to NAM Notification Alerts
Understanding Prime NAM Behavior Reference
This appendix includes details on how Cisco Prime Network Analysis Module (Prime NAM) works including how to navigate and use the control elements in the user interface.
This section includes the following topics:
- Menu Bar
- Filters
- Displaying Detailed Views
- Accessing Context Menus
- Performing a Quick Capture
- Determining How to Use Sites to View Data
- Filtering Traffic for Viewing on the Dashboards
- Switching Chart Formats Using the Chart View / Table View
- Accessing Other Tasks Using Mouse-Over for Details
- Changing the Time Interval Using Zoom/Pan Charts
- Using Sort Grid to Change Sort Order
- Displaying Bits or Bytes or Packets in Charts
- Statistics
- Context-Sensitive Online Help
- Feedback
- Subscribing to NAM Notification Alerts
For the location of the release-specific documentation for the command line interface or the application programming interface, see the Cisco NAM Documentation Overview on Cisco.com.
Menu Bar
For a description of common tasks in Prime NAM, see Table C-1 .
Filters
You can use the Filter feature to display specific information on the Prime NAM interface. The Filter icon is provided wherever the data is displayed in a tabular format. The following types of filters are available:
Quick Filter
This filter allows you to narrow down the data inside a table by applying a filter to a specific table column or columns. To apply different operators, use the Advanced Filter option.
To launch the quick filter, choose Quick Filter from the Filter drop-down menu.
Advanced Filter
This filter allows you to narrow down the data in a table by applying a filter using multiple operators such as Does not contain, Does not equal, Ends with, Is empty, and so on. For example, you can choose the filter pattern by table column names and operator from the drop-down menu. In addition, you must enter filter criteria based on the data available in the Prime NAM database.
To launch advance filtering, choose Advanced Filter from the Filter drop-down list.
Displaying Detailed Views
You can access additional details from the Dashboard and Monitor and Analyze mega-menus that provide packet and bits per second data as well as identify host, application, DCSP, and other categories. Select a graph element and left-click to view menu options. These may include options titled Details or Detailed Views . For an example of the Applications submenu see Figure C-1.
Accessing Context Menus
On most charts that appear on the dashboards (except for pie charts), you can left-click on a colored bar of data to get a context menu, with which you can get more detailed information about that item. See Figure C-1.
Figure C-1 Context Menu Showing Application Submenus

The example above is from the Response Time Summary Dashboard, Top N Applications by Transaction Time chart. The description to the right of “Selected Application” in the menu shows what item you had clicked on (in this case, dce-rpc ).
The menu items above the separator line are specific to the selected element of the Top N chart. The items below the separator line are not specific to the selected element, but apply to the Top N chart. The selections with no icons display in the current page. Selections with icons open in a separate page.
Performing a Quick Capture
From the Context menu of many of the bar charts that show Applications or Hosts or VLANs. you can start a Capture. For example, when you click on an Application in a bar chart (as in Figure C-1) and choose Capture, the following is done automatically:
- A memory-based capture session is created
- A software filter is created using that application
- The capture session is started
- The decode window pops open and you can immediately see packets being captured.

Note Quick Capture does not use site definition/filter.
From both the selectors in the upper left of the dashboards and from the item the user clicks on in the barchart, the following are carried into the context for the capture session:
If you open up the associated Capture Session and its associated Software Filter, the above settings will be shown.
Determining How to Use Sites to View Data
A site is an optional collection of hosts, or network endpoints, partitioned into views that help you monitor traffic and troubleshoot problems (see Configuring Sites for more detailed information).
If you have set up sites, you will be able to select a particular site to view in the Interactive Report and view data relevant to that site only. In some cases, you can select both a Client Site and a Server Site to view data pertaining to interaction between hosts at different sites.
Filtering Traffic for Viewing on the Dashboards
You can use the Interactive Report on most Monitor and Analyze windows to filter the parameters of the information displayed in the dashboards. Use the Monitor windows to view at a glance data and the Analyze windows to view data over time.
Step 1 Click the Filter button to change the parameters of the information displayed in the charts. An asterisk represents required fields.
Step 2 To search for a specific site’s VLAN traffic, select the Site name from the drop-down menu. Then select Encapsulation Edit button and enter the Layer 1 VLAN options on which you want to filter. You can select multiple values and additional layers.
To set a custom time range, select the Custom option from the Time Range drop-down menu. Then enter the dates and times. The From and To fields are only enabled when the Time Range is set to Custom .
You may need to enter the time range filter several times before seeing the data that you need. The default filter time range is for the last hour.
The reporting time interval selection changes depends upon both the dashboard you are viewing and your NAM platform.
Step 3 To view your updated filter results in the dashboard, click Apply .
Step 4 To save your filter for future use, enter a Filter Name and click Submit .
The software supports up to five saved filters. Saved reports display at the bottom of the Interactive Report panel. You can also edit or delete filters after creating them using the icons in the saved filter dialog box.
Filtering Data Using Global Search
You can use the global search filter to limit your overall view to specific host data. The global search tool appears in the top-right corner of the user interface. Enter the host IP address in the global search tool. The host search dashboard appears. On the Top N Applications chart, you can left-click a colored bar to get the context menu, and choose Analyze Host Traffic to see the host dashboard and analyze the host traffic for the selected application using Over Time chart.
Step 1 From your Monitor or Analyze dashboard enter your IPv4, IPv6, and Layer 2 traffic MAC addresses. You may also search using hostnames if you have enabled hostname (DNS lookup) in Prime NAM.

Specified host filters are also in effect for context menu charts. For example, if you specify a hostname filter in Monitor > Response Time Summary, the dashboard refreshes with only data specific to this host (including the IP address and site, if applicable). You can hover over table data for instant details. drill down menus also reflect this host’s data.
Step 2 To change the time range, select one of the default ranges or create a custom range.
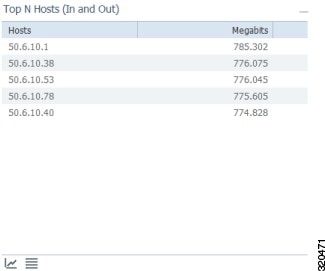
Switching Chart Formats Using the Chart View / Table View
Using the Chart view lets you see an overview of the data in an integrated manner, and can show you trending information. To get the exact value of any data in the graphical view, hover over a data point to see the tool tip. The chart view may be To toggle between the two views, use the Chart and Table icons at the bottom of the panel:

Accessing Other Tasks Using Mouse-Over for Details
When in Chart view, you can mouse over the chart to get more detailed information about what occurred at a specific time.
Many of the line charts in Prime NAM are dual-axis, meaning there is one metric shown on the left axis of the chart and another metric shown on the right axis of the chart.
For example, in the DCSP Group Traffic chart, Megabits per second is shown on the left axis, and Packets per second is shown on the right axis.
Changing the Time Interval Using Zoom/Pan Charts
For many charts, you can drag the beginning or end to change the time interval, as shown below.

The time interval change on the zoom/pan chart affects the data presented in the charts in the bottom of the window. The zoom/pan time interval also affects the drill down navigations; if the zoom/pan interval is modified, the context menu drill downs from that dashboard will use the zoom/pan time interval.
Note In a bar chart which you can zoom/pan, each block represents data collected during the previous interval (the time stamp displayed at the bottom of each block is the end of the time range). Therefore, you may have to drag the zoom/pan one block further than expected to get the desired data to populate in the charts in the bottom of the window.
Using Sort Grid to Change Sort Order
When looking at information in Grid view, you can sort the information by clicking the heading of any column. Click it again to sort in reverse order.
Displaying Bits or Bytes or Packets in Charts
To change the display on most Monitor and Analyze charts from bits to bytes, you can use the Bits and Bytes radio buttons to specify which information you would like the chart to display. To change this preference to display bytes use the Administration > System > Preferences .
On most Monitor and Analyze charts, you can use the Bits and Packets check boxes at the top to specify which information you would like the chart to display. To change this preference to display bytes use the Administration > System > Preferences .
Statistics
The Statistics legend gives you the minimum, maximum, and average statistics of the data. This will display the initial data retrieved for the selector.
Context-Sensitive Online Help
Click the Help link on the top-right corner of the Prime NAM interface to bring you to the Help page for that particular window of the GUI.
If available, the Help link appears on the top-right corner of each page; some pages also have a blue “i”, which provides help for that specific subject.
On some fields, hovering over the field displays tip information.
Feedback
Click the feedback link on the top-right corner of the Prime NAM interface to view the email id to which you can send your feedback. You can click the Product Info button to view the Cisco Prime Network Analysis Module (NAM) Products page.
Subscribing to NAM Notification Alerts
Cisco Notification Service allows you to subscribe and receive important NAM notification alerts. This alert includes Security Advisories, Field Notices, End of Sale/Support statements, Software Updates, and Known Bugs. Specifically, this service provides an improved unified subscription experience and the ability to choose the timing of notifications, as well as the notification delivery method (email or RSS feed).
For more details, seethe Cisco Notification Services Help document on Cisco.com.
To subscribe and receive notification on information related to NAM product:
Step 1 Go to the following URL:
http://www.cisco.com/cisco/support/notifications.html
Step 2 From the Cisco Notification Service page, click Add Notification .
Step 3 Enter the following details:
Step 4 Review and click Finish to submit your notification alert.
 Feedback