- Overview
- Getting Started
- Monitoring and Analyzing Traffic
- Capturing and Decoding Packets
- Performing User and System Administration
- Understanding NAM Deployment
- Customizing Cisco Prime NAM
- Understanding Prime NAM Traffic Sources
- Configuring NAM Security
- Understanding Prime NAM Behavior Reference
- GUI Field Descriptions
- Troubleshooting Network and NAM Issues
Cisco Prime Network Analysis Module User Guide, 6.4(1)
Bias-Free Language
The documentation set for this product strives to use bias-free language. For the purposes of this documentation set, bias-free is defined as language that does not imply discrimination based on age, disability, gender, racial identity, ethnic identity, sexual orientation, socioeconomic status, and intersectionality. Exceptions may be present in the documentation due to language that is hardcoded in the user interfaces of the product software, language used based on RFP documentation, or language that is used by a referenced third-party product. Learn more about how Cisco is using Inclusive Language.
- Updated:
- February 2, 2015
Chapter: Capturing and Decoding Packets
- How Do I Solve My Problem?
- Manually Starting a Capture
- Using Alarm-Triggered Captures
- Scheduling Captures
- Troubleshooting Application Slowness Using Alarms
- Application Performance Monitoring Using Capture and Decode
- Creating and Managing Capture Sessions
- Working with Capture Files
- Utilizing Capture Data Storage
- Inspecting Packet Decode Information for Suspicious Traffic
Capturing and Decoding Packets
You can use Prime NAM to capture packets to disk or memory buffers. Capture filters is used to select which packets to keep and which to drop. Prime NAMalso supports built-in packet decoder which can decode captured packets from .pcap files on the disk or directly from a capture memory buffer. Decode filters shows only the interested packets and these interested packets are be written to a new .pcap file. You can then manage the data in local or remote storage and display the contents of the packets to collect troubleshooting information.

Note This software feature may be limited depending on your hardware platform. For details, see the NAM Compatibility Matrix or the Cisco Prime Network Analysis Module Software Release Notes.
This contains the following sections:
- How Do I Solve My Problem?
- Manually Starting a Capture
- Using Alarm-Triggered Captures
- Scheduling Captures
- Troubleshooting Application Slowness Using Alarms
- Application Performance Monitoring Using Capture and Decode
- Creating and Managing Capture Sessions
- Working with Capture Files
- Utilizing Capture Data Storage
- Inspecting Packet Decode Information for Suspicious Traffic
How Do I Solve My Problem?
This section provides an overview of how to collect and analyze packet data to ensure your network is running well or pinpoint network issues.
There are many ways to collect data and analyze it using Prime NAM. In order to collect data, the prerequisite is to have set up SPAN or ERSPAN through your NAM dataports. For details on data source configuration, see Understanding Prime NAM Traffic Sources. Many users want a quick capture to analyze their packet data. See Manually Starting a Capture for details on how to get a quick capture.
Table 4-1 provides an at-a-glance summary of capture tasks you can perform to ensure your network is optimized and trouble-free.
Capture the traffic quickly from any NAM dashboard when anomalies are present |
Targets data collection based on the dashboard graph you select and provides a capture session and decode window to analyze the traffic immediately. See Manually Starting a Capture. Do not use quick capture if your context includes an NBAR application ID on NAM platforms other than virtual NAMs like VX10, VX20 ESXi or KVM vNAM, vNAM on UCSE. Use Capture > Packet Capture/Decode > Sessions to configure and start your capture. |
|
Proactively capture packet data to learn the cause of a network issue |
||
Create hardware and software filters to focus on specific long-term packet data |
On supported NAM hardware, helps to limit the amount of packet data processing. See Configuring Hardware Filters and Configuring Software Filters. |
|
Allows you to save data to external storage targets, potentially for larger disk capacity and higher capture throughput or to offload capture files. Continuous capture overwrites itself in memory when the buffer is full. |
||
Allows you to decide when to use trigger capture sessions. This must be setup in Setup > Alarms > Actions . See Configuring Alarm Actions and Using Alarm-Triggered Captures. |
||
Allows you to save data for extended periods either to memory or storage. See About Capturing to Data Storage. |
||
See Inspecting Packet Decode Information for Suspicious Traffic. |
Manually Starting a Capture
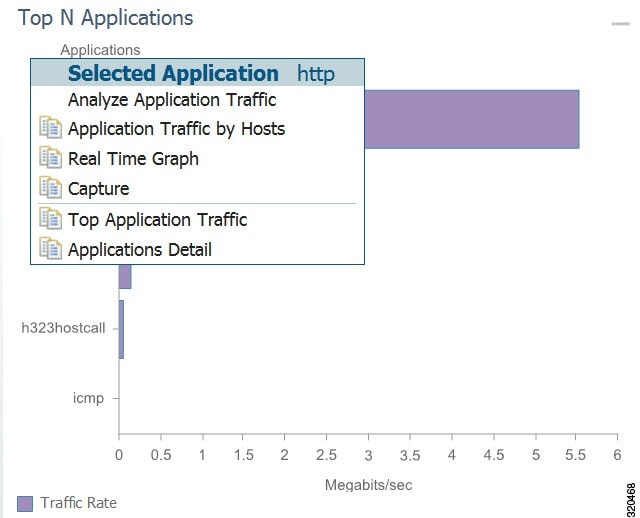
You do not have to perform any configuration and can quickly collect packet data by selecting the context menu option, Capture . Figure 4-1 shows an example of a context menu for Top N Applications dashboard.
For details on how to use the decode window to analyze your data, see Inspecting Packet Decode Information for Suspicious Traffic.
Using Alarm-Triggered Captures
You can configure multiple alarm-triggered captures that start and stop automatically by alarm events you define.
To set up an alarm-triggered capture:
Step 1 Choose Capture > Packet Capture/Decode > Sessions and create a capture session. For detailed instructions, see Configuring Capture Sessions.
Step 2 Create an alarm event from Setup > Alarms > Actions and click Create to make a new trigger capture action which uses the session from Step 1.
Configure an alarm event for the type of event for which you want to capture data. For detailed instructions, see Configuring Alarm Actions.
Step 3 Create a threshold which uses the alarm event action from Step 2. Choose Setup > Alarms > Thresholds window.
To configure the threshold of parameters of interest in the associated Alarm Event, see Defining Thresholds.
Scheduling Captures
You can configure multiple time-based triggered captures that start and stop automatically based on a certain time or period of time that you define. This is also referred to as continuous capture. Continuous capture overwrites itself in memory when the buffer is full. The following is an example of setting a 60 minute window to schedule capture packet data.
Step 1 Create a new capture from the Capture > Packet Capture/Decode > Sessions window.
Step 2 Check the Auto Capture Enable check box.
Step 3 Set the Start Date and Time and Duration (in minutes) to 60 .
Step 4 Select an appropriate storage type to store your capture data. For example, select capture to memory HDD .
Step 5 Select appropriate software filters.
Step 7 To start the capture session, return to the Capture > Packet Capture/Decode > Sessions menu and select the capture session you previously created and click Start .
Troubleshooting Application Slowness Using Alarms
This section describes how to use Prime NAM to use triggered alarms and capture files to help you determine the source of some network problems.
You must already create an alarm that notifies you when there is a surge in application traffic. If you need to create an alarm, thresholds, and set up email notification, see Setting Up Alarms and Alarm Thresholds.
To use existing alarms to help you to create and analyze captured packet files:
Step 1 After receiving an email that was triggered by an alarm notification, view the alarm summary and analyze the details. For example, if your alarm triggers when your application has reached a certain threshold, choose Monitor > Alarm Summary to view the Top N Applications by Alarm Count dashboard.
If you use sites , you could view the top sites by alarm count dashboard in order to see the alarm details and determine what threshold variable is causing the alarm to trigger.
Step 2 To view more details (or drill down) from this dashboard, left-click the row you are interested in and select Application Response Time in order to analyze the response time during the time interval of the alarm trigger. If you application is not listed in the graph, you can select the table icon to choose your application from the list of all the applications and drill down from there to analyze the response time.
Step 3 Adjust the Interactive filter to view specific time ranges and severity levels in order to view where the spike in response time occur. This helps to determine if the occurrence is limited to a one-time event, if it occurs more than once in a short period of time, or is an event related to a specific time of the day. For example, by changing the time range filter from 1 hour to 4 hours to 1 day, you can see the latest data trends that help you to determine what to do next. See Filtering Traffic for Viewing on the Dashboards.
Step 4 In the graph that displays, focus in on the time frame when the event occurs by using the slider to pinpoint the event. Look for peak or valleys; these may be critical changes that require investigation. Using the legend you can determine whether the event was caused by the network or server. See Changing the Time Interval Using Zoom/Pan Charts.
Step 5 Select any of the metrics provided below the application average response time graph.
a. To view if there are specific clients that have significant transaction time differences, see the Top Clients By Average Transaction Time graph in order to identify data such as Client-Server Application Transactions using an application-specific filter.
Application Performance Monitoring Using Capture and Decode
This task explains how to proactively monitor your application performance, then use it to help isolate and troubleshoot application latency issues experienced by your end user.
NAM assumes that your system time is synchronized. If you do not have the time synchronized between the NAM and the standard time source outside the NAM, then you may see either incorrect data or no data. If you suspect inaccurate timestamps, you need to set up the System Time so that NAM data presentation is accurate. For instructions on how to set system time by choosing Administration > System > System Time , see Synchronizing Your System Time.
Step 1 Identify and monitor your business critical applications. To see Layer 7 application details, ensure you enable deep packet inspection. Choose Setup > Classification > Applications Settings and select the Deep Packet Inspection check box.
For detailed instructions, see Adding More Detail into Dashboard and Application Reports.
Step 2 Proactively detect performance degradation using threshold violation alerts. First, define your alarm by choosing Setup > Alarms > Actions . Then define the thresholds for your alarm by choosing Setup > Alarms > Thresholds .
For detailed instructions, see Setting Up Alarms and Alarm Thresholds.
Step 3 Validate a reported trouble ticket or network issue. Choose Monitor > Overview > Response Time Summary and use the Top N Applications by Transaction Time dashboard to identify which application may be impacted.
You can select the table view to see more than the top default applications. You can also use the other dashboards to view server or client transaction times. See Using Response Time Summary.
Step 4 Analyze the application performance behavior over time using the Interactive Report filter. Determine if the behavior is transient, persistent, recurring, and so on. For details on using the Interactive Report filters, see Filtering Traffic for Viewing on the Dashboards.
Step 5 Zoom in to view specific spikes in the performance, and drill down to isolate whether the cause of the degradation stems from your network, server or application. See Changing the Time Interval Using Zoom/Pan Charts.
Step 6 Analyze the server response time and network performance metric in order to eliminate one of them as the cause. See Server Response Time and Network Response Time.
Step 7 Analyze server activity based on the traffic the server is placing on the network and assess the cause of increase in the server response time. See Analyzing Host Traffic.
Step 8 Perform packet captures in order to identify the root-cause. For details on quick captures or trigger captures, see Capturing and Decoding Packets.
Step 9 Perform additional actions to isolate and troubleshoot the problem including: QoS analysis and interface analysis.
Creating and Managing Capture Sessions
You can use capture sessions to capture, filter, and decode packet data, manage the data in a local or remote storage, and display the contents of the packets. The captured packets can be decoded and analyzed using Prime NAM for more efficient problem isolation.
This section contains the following topics:
- Configuring Capture Sessions
- Configuring Software Filters
- Configuring Hardware Filters
- Understanding Hardware and Software Capture Sessions Filters
- Viewing Capture Sessions
- Understanding Global Capture Settings
Configuring Capture Sessions
It is important for you to collect data over time and have various locations for which you want to analyze data, we support multiple sessions per capture location/target. You can collect data using multiple sessions per target, but only one session runs per hard disk target. Concurrent capture sessions can run if capture to buffers or different hard disk based targets. This limitation is mainly to avoid disk fragmentation and better performance. Capture decode filters can be used to view or separate different subset of packets to different files. Prime NAM now supports up to 25 capture sessions. If you have external storage you can save to local disk and some number of LUNs. As part of configuring a capture session, you can also create software filters, if desired (see Creating a Software Capture Filter for a Capture Session).
To configure a new capture session:
Step 1 Choose Capture > Packet/Capture Decode > Sessions .
Step 2 Click Create to set up a new capture. The NAM displays the Configure Capture Session window.
Step 3 Enter information in the Capture Settings Fields ( Table D-61 ) as appropriate.
When capturing to multiple files, a suffix is added to the file name. For example, the first file for a capture named CaptureA would be labeled as CaptureA_1 the second CaptureA_2 , and so on.
Step 4 Click Submit to finish configuration for this session, or configure Software Filters for this session (see Understanding Global Capture Settings).
Configuring Software Filters
You can create and save specialized filters that will disregard all capture data except the information in which you are interested (see Figure 4-6). You can configure multiple software filters for each session (up to six). This allows you to narrow in on the traffic that you are interested in, and it also saves resources (either memory or disk space).
Use the following topics for help on filtering network traffic using software filters:
Creating a Software Capture Filter for a Capture Session
You can create software capture filter for many variables. This workflow examines how to create a capture session with a software filter.
To create a software capture filter:
Step 1 Choose Capture > Packet Capture/Decode > Sessions .
Step 2 Click Create to create a new capture session.
If you already have a capture session to which you want to add a software filter, see Editing a Software Capture Filter for detailed instructions.
Step 3 Click Create in Software Filters section.
Step 4 Enter information in each of the fields as appropriate. See Table D-67 for descriptions of the fields.
Step 5 Click Submit to create the filter, or click Cancel to close the dialog box without creating a software filter.
Note In the case of IP tunneling, such as IP in IP, the address will be matched against the innermost IP address in the package.
Editing a Software Capture Filter
To edit software capture filters:
Step 1 Choose Capture > Packet Capture/Decode > Sessions .
Step 2 Choose the session to edit, then click Edit .
The Software Filter dialog box displays. See Table D-67 .
Step 3 Choose the Software Filters , then click Edit .
Step 4 Enter information in each of the fields as appropriate.
Step 5 Do one of the following:
Important Notes about Software Capture Filters
This section contains important software capture filters details that may be helpful to know.
- Multiple software filters use the “OR” logic; in other words, if a packet passes any software filter, it is captured.
- If you create a session and then start it, you cannot edit the session or analyze it without stopping it. If you edit a session containing already captured data, you get a warning stating that the session will be cleared and the data removed. If clearing the session and removing the data is acceptable, ignore the warning dialog message, then add a filter to the session and click Submit to enable the new filter settings.
- The application filter can be used to filter on the highest layer of the protocol parsing; that is usually a layer 4 protocol (based on port). If you want to filter on the transport protocol (for example, UDP or TCP), you will need to use the IP Protocol selector. Selecting, for example, TCP in the “IP Protocol” selector will filter on all packets using TCP.

Tip Be careful when setting capture software filtering for encapsulation. If you set a software capture filter with encapsulation for the top three network traffic layers only, data displays only if the top three layers match the specified encapsulation type.
Understanding Software Capture Filter Options
You can define a software filter to filter based on any of the following options:
- Source host address
- Destination host address
- Network encapsulation
- VLAN or VLAN range
- TCP Flag bits
- Application
- Source port or port range
- Destination port or port range
- IP Protocol
Note Software capture filtering is not supported on URL-based applications.
Table D-67 contains descriptions of the Software Filter dialog box fields.
Note The parameters described in the table above are independently evaluated by the NAM. Therefore, the NAM will allow you to enter parameters that are contradictory, but you will not be able to get meaningful results if they do not match.
For example, the parameters Network Encapsulation and Source/Destination Address are independently evaluated. If a filter is specified with contradicting parameters such as “Network Encapsulation=IP4” and “Source Address=an IPv6 address”, it will never match any traffic, and the result will be 0 packets captured.
Configuring Hardware Filters
You can use hardware filtering to help limit the amount of traffic allowed into the NAM for processing. In service modules, there is a hardware datapath throughput limitation and hardware filtering helps to reduce the traffic into the NAM. The NAM hardware platforms that support hardware filtering include:
Depending on your NAM, the hardware filter support varies. The following section describes:
Creating NAM Service Modules Hardware Filters
This section is applicable only for NAM-3 and NAM-NX1 service modules.
NAM-3 and NAM-NX1 service modules have specific hardware filter logic. These hardware filters allow you to improve capture performance by eliminating extraneous traffic, since packets excluded from capture processing.
Hardware filters and global packet slicing affect all capture sessions, except for ERSPAN capture sessions. See Figure 4-6, “NAM Capture Sessions Example” for an architectural overview.
NAM-3 and NAM-NX1 support up to four hardware filters. You can disable hardware filters without deleting them.
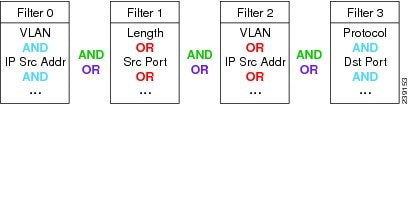
Within each filter, you can set up conditions with the AND/OR logic. Only the same logic type can be used within the same filter; you cannot mix the AND/OR logic within the same filter. Also, you can combine the filters together with the AND/OR logic. See Figure 4-2 for examples of filter logic you can use.
Figure 4-2 Hardware Filter Logic (AND/OR)
The selections are described in the following sections. For information about how you can achieve specific results, see Configuring Hardware Filter Examples.
Tip Software filters add flexibility to your filtering, but hardware filters are most efficient. The less traffic that requires software filtering, the more efficient the filtering.
See these topics for information about setting up and managing hardware filters:
- Creating or Editing a NAM Services Modules Hardware Filter
- Configuring Hardware Filter Settings
- Configuring Hardware Filter Examples
Choose Capture > Packet Capture/Decode > Sessions to view the status and settings of hardware filters that are configured on the Cisco NAM. The Hardware Filters box appears at the bottom of the Sessions page.
Creating or Editing a NAM Services Modules Hardware Filter
The Hardware Filters window displays the status and settings of the hardware filters if they have been defined. To configure a capture with hardware filters:
Step 1 Choose Capture > Packet Capture/Decode > Sessions . The top half of the window shows Capture Sessions, and the bottom half of the window shows Hardware Filters.
Step 2 In the Hardware Filters section on the bottom of the window, click Create . The Hardware Filter Dialog appears.
Step 3 Enter a name for the hardware filter in the Name field. The name should be less than 40 characters and contain only supported characters.
Step 4 Check the Enable check box to enable the filter. If the filter is created with the Enable check box unchecked, the filter will be saved but inactive. It can be enabled at a later time by editing the filter and checking the Enable check box.
Step 5 Choose either the AND or the OR radio button. This selection will apply to all of the selections you make in the next step (the selections are described in Table 4-4 ).
Step 6 Check the boxes for the attributes you want to filter on, and then in the corresponding drop-down menu, select the desired option. The Check All check box selects all check boxes. See Table D-65 .
Step 7 Click Apply to complete the configuration of the hardware filter.
Configuring Hardware Filter Settings
The Hardware Filter Settings allows you to set global settings for all capture hardware filters.
To add settings that apply to all hardware filters:
Step 1 Choose Capture > Packet Capture/Decode > Sessions .
Step 2 In the Hardware Filters section at the bottom, click Hardware Filter Settings .
Step 3 Choose the AND or OR Combination Logic, which will be applied to all configured hardware filters. This logic is used to combine the filters; see the green text in Figure 4-2.
Step 4 Choose the Include in capture or Exclude from capture Packet Match Logic. This selection will apply to all configured hardware filters.
Exclude from capture will drop packets that match all of the hardware filters you have configured. Meanwhile, all packets that do not match will be captured.
Configuring Hardware Filter Examples
Use these topics to configure the following network traffic:
- IP Subnet + L4 Port (L5 Application)
- VLAN + L4 Protocol
- Multiple Hosts
- VLAN Range
- Data Port + Frame Length
- MPLS
IP Subnet + L4 Port (L5 Application)
To capture all HTTP traffic emanating from the 10.1.1.0/24 subnet:
Step 1 On the Hardware Filters window, click Create .
Step 2 Enter a name in the Name field.
Step 3 Choose the Logic AND radio button (this will combine the selections you make below).
Step 4 Check the Source IP Address check box and enter the subnet “10.1.1.0/24”.
Step 5 Check the L4 Source Port check box and enter the port “80” for HTTP.
To see the opposite direction of the HTTP conversations:
Step 1 On the Hardware Filters window, click Create .
Step 2 Enter a name in the Name field.
Step 3 Choose the Logic AND radio button.
Step 4 Select Destination IP Address and enter the same subnet as before, 10.1.1.0/24
Step 5 Select L4 Destination Port and enter the same port, 80.
Step 7 To see the incoming and the outgoing, click Hardware Filter Settings and select the OR logic. This will combine the two hardware filters with the OR logic.
To see all TCP traffic from VLAN 100:
Step 1 On the Hardware Filters window, click Create .
Step 2 Enter a name in the Name field.
Step 3 Choose the Logic AND radio button.
Step 4 Select VLAN and enter the VLAN, 100.
Step 5 Select L4 Protocol and choose TCP.
To see traffic sent to and from multiple hosts: 1.1.1.1, 2.2.2.2, ...:
Step 1 On the Hardware Filters window, click Create .
Step 2 Enter a name in the Name field.
Step 3 Choose the Logic OR radio button.
Step 4 Check the Source IP Address check box and enter the first host: 1.1.1.1.
Step 5 Check the Destination IP Address and enter the same host: 1.1.1.1.
Step 7 Click Create to make a second hardware filter.
Step 8 Enter a name for the hardware filter in the Name field.
Step 9 Choose the Logic OR radio button.
Step 10 Check the Source IP Address check box and enter the second host, “2.2.2.2”.
Step 11 Check the Destination IP Address check box and enter the second host, “2.2.2.2”.
Step 13 Repeat Step 7 through Step 12 for a third and fourth host, if desired.
Step 14 Click Hardware Filter Settings and select the logic OR radio button.
To see all traffic from VLANS 10 through 20:
Step 1 On the Hardware Filters window, click Create .
Step 2 Enter a name in the Name field.
Step 3 Check the check box for VLAN IDs and choose Greater Than from the drop-down menu.
Step 4 In the empty field, enter the bottom VLAN range boundary, “9.”
Step 6 Click Create to make a second filter.
Step 7 Enter a name in the Name field.
Step 8 Check the check box for VLAN IDs and choose Less Than from the drop-down menu.
Step 9 In the empty field, enter the bottom VLAN range boundary, “21.”
Step 11 Click Hardware Filter Settings and select the AND radio button, which will combine the logic of all hardware filters.
To see all traffic spanned to DATA PORT 1 that is less than 200 bytes:
Step 1 On the Hardware Filters window, click Create .
Step 2 Enter a name in the Name field.
Step 3 Choose the Logic AND radio button.
Step 4 In the Data Port drop-down list, choose DATA PORT 1 .
Step 5 Check the check box for Frame Length and choose Less Than from the drop-down menu.
Step 6 In the empty field, enter the frame length ceiling, “200.”
To see traffic in which the first MPLS label is 300:
Step 1 On the Hardware Filters window, click Create .
Step 2 Enter a name in the Name field.
Step 3 Check the check box for MPLS Label .
Step 4 In the empty field, enter the label, “300.”
To see both directions of a conversation between hosts 1.1.1.1 and 2.2.2.2:
Step 1 On the Hardware Filters window, click Create .
Step 2 Enter a name in the Name field.
Step 3 Choose the Logic AND radio button.
Step 4 Click the Source IP Address/Mask check box, select Equal To from the drop-down menu, and enter the first host: “1.1.1.1”.
Step 5 Select the Destination Address/Mask check box, select Equal To from the drop-down menu, and enter the second host: “2.2.2.2.”
Step 7 Click Create to make a second hardware filter.
Step 8 Enter a name for the hardware filter in the Name field.
Step 9 Choose the Logic AND radio button.
Step 10 Click the Source IP Address/Mask check box, select Equal To from the drop-down menu, and enter the second host: 2.2.2.2.
Step 11 Select the Destination Address/Mask check box, select Equal To from the drop-down menu, and enter the first host: 1.1.1.1.
Step 13 Click Hardware Filter Settings and click OR .
In the previous example, you set up filters that match the packets. For negative filter logic, these now need to be blocked.
To see everything except the conversation from the previous example:
Step 1 On the Hardware Filters window, click Hardware Filter Settings .
Step 2 For Packet Match Logic, select the Exclude from capture radio button.
Go to the next section, Understanding Global Capture Settings, for information about configuring software filters for capture sessions.
Creating NAM Appliance Hardware Filters
This section describes how to create NAM appliance hardware filters.
The Hardware filters allow you to improve capture performance by eliminating extraneous traffic, since packets filtered out are excluded from capture processing.
Note The hardware filter applies to the NAM 2420, 2440 and 2520 appliance. The NAM does not support hardware filters.
Software filters add flexibility to your filtering, but a capture session is most efficient when you use hardware filters only. The less traffic requiring software filtering, the more efficient the filtering.
For the NAM appliances that support hardware filtering, you can set up to five hardware filters per appliance. When multiple hardware filters are created on the appliance, the logic among them are OR logic.
Hardware filters and global packet slicing affect all capture sessions, except for ERSPAN capture sessions.
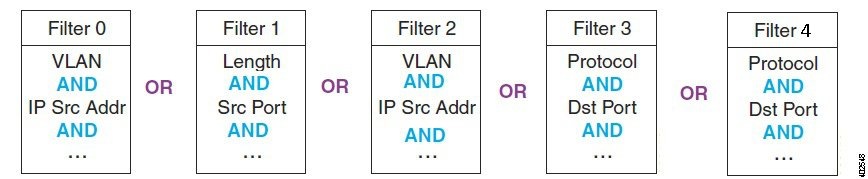
All fields within a single filter are combined with AND logic. The filters are then combined with OR logic. See Figure 4-3 for examples of filter logic you can use.
Figure 4-3 Hardware Filter Logic (AND/OR)
See Configuring Supported NAM Appliance Hardware Filters for detailed steps.
Configuring Supported NAM Appliance Hardware Filters
The Hardware Filters window appears at the bottom of the Capture > Packet Capture/Decode > Sessions window. To configure a hardware filter:
Step 1 Choose Capture > Packet Capture/Decode > Sessions .
Step 3 Enter a name in the Name field.
Step 4 Choose any or all of the following types of filters:
- VLAN
- VLAN and IP
- IP
- IP and TCP/UDP
- IP and Payload Data
- Payload Data
Note When you use the IP address fields in the hardware filters, tunneled packets will be filtered based on the outer IP address. The NAM will further inspect matching packets to analyze the contents within the tunnel. The NAM will always display the inner IP address in the packet list. See Understanding the NAM Packet Decoder for details.
Step 5 Data fields will then appear that correspond with the type of hardware filter you select. Fill in the desired fields.
Step 6 Click Submit to complete the configuration of the capture session.
To configure an IP and Payload Data hardware filter:
Step 1 Enter a Filter Name and select your options.
Step 2 Enter a Source Address / Mask (optional).
Step 3 Enter a Destination Address / Mask (optional).
Step 4 Choose a Layer 4 Protocol, either TCP or UDP.
Step 5 Enter the values for Pattern Match:
Note Only one payload segment (one row) is required and provided. This is to guard against overlapping payload segments. If overlapping segments have different values the filter will never match anything due to the inherent AND logic.
To configure a Payload Data hardware filter:
Step 2 Choose a Layer 4 Protocol, either TCP or UDP.
Step 3 Enter the values for Payload Data:
Note Only one payload segment (one row) is required and provided. This is to guard against overlapping payload segments. If overlapping segments have different values the filter will never match anything due to the inherent AND logic.
Figure 4-4 and Figure 4-5 shows configuration examples on how to calculate the offsite value and how to set mask to use the payload feature.
Figure 4-4 Configuration Example

Figure 4-5 Configuration Example (Continued)

Understanding Hardware and Software Capture Sessions Filters
You can filter specific traffic data and manage that information in local or remote storage. This increases your visibility into network issues and allows you to filter out unnecessary information. You can use either hardware or software filters to target specific packet data to receive.
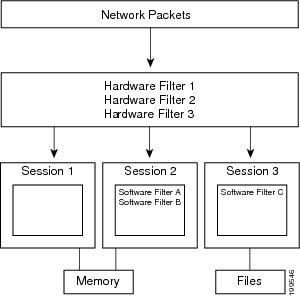
As shown in Figure 4-6, if network packets coming into the NAM pass through the hardware filters you have configured, the packets go on to the next step. If no hardware filters are configured, all packets pass through.
Note Hardware filters are supported on specific Prime NAM platforms. See Configuring Hardware Filters for details.
Packets must then pass at least one software filter in that particular session to be saved by that session. If no software filters are configured for a session, then all packets are captured. For more information about software filters, see Configuring Software Filters.
For better performance for the supported NAM platforms, hardware filters are recommended over software filters, and fewer sessions are recommended over more sessions.
You do not have to configure the items in Figure 4-6 in any particular order. For example, you can set Global Capture Settings first, and then configure Capture Sessions, and then create filters; or, you can create Hardware and Software filters first, and then configure Capture Sessions, and finally apply Global Capture Settings. We recommend that you “Start” the session last; otherwise, you will start capturing before you have configured any filters and before doing any packet slicing.
Global Capture Settings and Hardware Filters can be changed at any time, even when the session is running; they will affect running capture sessions immediately. We recommend that you first stop your capture session to edit it since you may capture some unexpected packets during the filter change. See Understanding Global Capture Settings for details.
Figure 4-6 NAM Capture Sessions Example
Note For traffic that has encapsulation layer inside the packet, hardware filter will always run the filter based on its outer layer instead of the inner layer.
Take below ERSPAN encapsulation packet as an example:
- If using IP based hardware filter to match the packet, you need to create a filter based on its outer ip (Src:10.79.46.31, Dst:7.1.1.2) which is showed before the ERSPAN header.
- If you want to do a filter to match its inner IP address (Src: 20.10.150.7, Dst:20.10.10.3), but the Hardware Filter could not get it, you may use Capture Session’s Software Filter to get it.
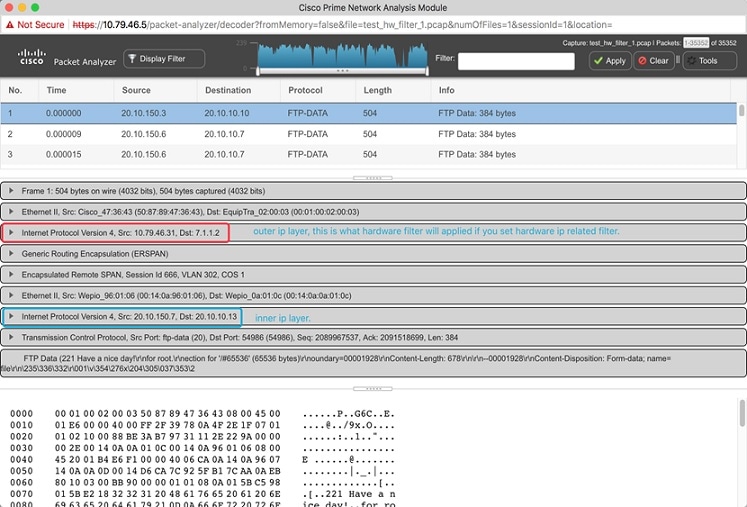
In some cases, if you are not sure about which IP should be filtered, you can capture without hardware/software filter. You will have to first decode it and understand the packet layers to proceed.
Viewing Capture Sessions
To access the basic operations for capturing, viewing and decoding packet data on the NAM, choose Capture > Packet Capture/Decode > Sessions .
The Capture Sessions window shows the list of capture sessions. If none have been configured, the list will be blank. Table D-60 describes the Capture Sessions fields and operations that you can perform from the Capture Sessions window.
Understanding Global Capture Settings
You can limit the size of the captured packets by using the Global Capture Settings to apply a custom packet slice and error settings for all capture sessions. This setting applies to NAM-3 and NAM-NX1 only. You can change these settings even when a filter is running since they affect the running sessions immediately.
To enable the Global Capture Settings, click Global Capture Settings in the Capture > Packet Capture/Decode > Sessions then click Enable and complete your selections.
Global Packet Slicing
Global packet slicing affects all capture sessions, as opposed to the per-session Packet Slice Size parameter, and is performed in hardware. Use this feature to capture packets more efficiently when only the first N bytes are of interest to you. The capture buffer/file is smaller and the NAM is able to capture more packets per second.
The default setting for Global Packet Slicing is Disabled.
This setting overrides individual capture session software slicing settings if it is shorter. For example, if you have a capture session with the slicing field set to 100, but you also have Global Packet Slicing set to 56, then all packets will be sliced down to 56 bytes.
Hardware filters and global packet slicing affect all capture sessions, except for ERSPAN capture sessions.
In addition to global packet slicing you can set choose to allow error packets in the packet. For details on error packet settings, see Error Packets.
Error Packets
Error packets are packets that would normally be dropped by the network interface card, such as under size and over size packets, as well as packets with CRC errors. Error packets can be very helpful for troubleshooting the network.
If you want to customize how Prime NAM treats error packets use the following options:
- Include in capture (Default)—Includes packets with and without errors.
- Exclude from capture —Omits error packets. The packet capture only includes packets without errors.
- Only error packets in capture —Omits packets without errors. The packet capture includes only packets with errors. This option will save disk space but may not be as helpful since you may be unable to see the big picture view of all packet details.
This setting applies to all capture sessions on NAM-3 and NAM-NX1 only.
This setting is applied to all capture sessions. In addition to setting error packets, you can also enable global packet slicing. For details on global packet slicing settings, see Global Packet Slicing.
Working with Capture Files
To decode, download, rename, convert/merge, delete, analyze, or error-scan saved packet capture files use the Files option.
This section covers the following topics:
- Analyzing Capture Files
- Downloading Capture Files
- Deleting a Capture File
- Deleting Multiple Capture Files
- Understanding Capture Sessions
Analyzing Capture Files
The Capture Files window (click Analyze button at Capture > Packet Capture/Decode > Files ) enables you to obtain various statistics including traffic rate (bytes/second) over a capture period and lists of hosts and protocols associated with network traffic.
This window also enables you to drill down for a more detailed look at a particular set of network traffic. The pane above the Traffic over Time graph displays the time shown in the graph in the From: and To: fields. It also provides fields for Protocol and Host/subnet, and a Drill-Down button.
Note After clicking the Drill-Down button, the Host Statistics results table will display both source and destination hosts, if either the source or destination host of the traffic belongs to the Host/Subnet that you had specified.
Each slice in the Traffic over Time graph displays the amount of traffic for the amount of time set in the Granularity of the capture file.
You can view more detail about a specific time frame by entering the time in the From: and To: fields and choosing Drill-Down . You can also drill down on a specific Protocol or Host/subnet address.
Table D-59 describes the different areas of the Capture Analysis window.
Drilling Down into Packet Error Details
You can further investigate, or drill down, into packet error details by viewing the decode packet data available on Prime NAM.
The Capture Errors and Warnings Information window shows warnings and errors, and packet irregularities. From here, you can launch the Packet Decode Window, where you can drill down to packet details.
To get to the Capture Errors and Warnings Information window, choose Capture > Packet Capture/Decode > Files . Highlight a file and click the Errors Scan button. The Error Scan window displays. The fields are described in Table D-62 . Then select the packet details by selecting a row and clicking the Decode Packets button.
Downloading Capture Files
You can only download one capture file at a time. To download a capture file to your computer:
Step 1 Choose Capture > Packet Capture/Decode > Files .
Step 2 Choose a capture file from the list of captures.
A Save As dialog box opens and provides a way for you to rename and save the file at a location of your choice.
Deleting a Capture File
Step 1 Choose Capture > Packet Capture/Decode > Files .
Step 2 Check the check box to select a capture file from the list of captures, or select more than one if desired.
Step 3 Click Delete . A dialog box displays and asks “ Are you sure you want to delete file(s)? ” and displays the file name.
Step 4 Click OK to delete the file(s) or Cancel to allow the file(s) to remain.
Deleting Multiple Capture Files
To delete all capture files at once:
Step 1 Choose Capture > Packet Capture/Decode > Files .
Step 2 Check at least one check box to select a capture.
Step 3 Click Delete All to delete all captures.
A dialog box displays and asks “ Are you sure you want to delete all files? ”
Step 4 Click OK to delete all the files or Cancel to allow them to remain.
Understanding Capture Sessions
To understand how Prime NAM creates capture files with saved packet data, it is important to learn about how NAM handles capture session triggers.
This section contains the following topics:
Packet capture sessions can be triggered on the Prime NAM in several ways:
- Manually, by starting a capture using the Capture menu option or clicking the Start capture button.
- Scheduled, by specifying a start date/time and maximum duration when you create or edit a capture session.
- Alarmed, by creating an alarm with an associated trigger capture action that starts a particular capture session.
Prime NAM supports multiple capture sessions associated with the same capture storage location, but only one of these sessions can be running at any given time. Since there are several ways for such capture session to be started, it is possible for conflicts to arise among such capture sessions.
For example, suppose one capture session is started manually, but another capture session is scheduled to begin capturing while the first is still running. If these two sessions capture to the same storage location, there is a conflict. In this case, Prime NAM resolves the conflict by automatically stopping the manual session and allowing the scheduled session to begin.
In general, NAM resolves capture session conflicts by prioritizing them in the following (descending) order:
1. High-severity alarm triggered capture
2. Low-severity alarm triggered capture
If there are existing capture sessions already running on the same storage target, this means there is a conflicting alarm trigger. An alarm trigger is created when you configure an alarm threshold to start collecting packet data. Each alarm has a severity option.
Once a capture session is completed, you can manipulate the file. See
This section provides an overview of the tasks you can complete with capture files. See Table 4-2 .
For information about how to save capture sessions to files, see Creating and Managing Capture Sessions.

Caution If you have capture files with a state of Full and the NAM is rebooted, the capture is triggered again and these files may be overwritten by the new capture. If you want to retain the file, save the file before you reboot.
Download a file to your computer in .pcap file format.
Note Do not add a file suffix when you provide the filename. The suffix .pcap is added automatically. |
|
Give the file a new name. A dialog box displays and asks you to enter the new name for the selected capture file. |
|
Merges capture files that were captured simultaneously in chronological order. Note Merged files cannot exceed 2,000 MB. This limit is set purposely since many tools can not handle the large size capture files. |
|
View statistical analysis of the selected capture. See Analyzing Capture Files. |
|
View more information about the file (Packed ID, Protocol, Severity, Group, and Description). From here you can also decode the packet. For more information see Drilling Down into Packet Error Details. |
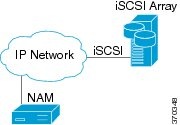
Utilizing Capture Data Storage
Cisco Prime Network Analysis Module platforms offer external storage connectivity for extended capture durations and higher capture bandwidths. All platforms support iSCSI data storage. Some platforms may support other forms of data storage, but this document covers only iSCSI data storage.
This section covers the following topics:
- About Capturing to Data Storage
- Installing and Configuring Local and External Storage
- Recovering Data Storage
Figure 4-7 External Storage Setup
For instructions on installing and configuring external storage not covered here, see your platform-specific guides on Cisco.com or related documentation in the Cisco NAM Documentation Overview .
About Capturing to Data Storage
To avoid filling up the local server disk on the NAM, you can capture files to external storage. One of the benefits of using external storage is that it can provide larger capacities, higher read/write speeds, and can be moved from one Cisco NAM to another. The capture files are decoded in the same manner as the Capture > Packet Capture/Decode > Files page.
Using Prime NAM, you can perform internal and external storage management using Capture > Packet Capture/Decode > Data Storage. This window lists detected storage devices, including the internal hard drive, if one is available. For details on how to install and configure local and external storage, see Installing and Configuring Local and External Storage .
This release supports 32 external data storage targets, or Logical Unit Numbers (LUNs).
You can create multiple capture sessions per target. Only one capture per storage target (file location) is allowed at a time. Additionally you can have multiple sessions to memory.
Installing and Configuring Local and External Storage
You can use local or external storage as a repository for long term data for performance comparisons.
Configuring the iSCSI Array
You may decide that in addition to or instead of local storage that you want to set up an external storage drive using iSCSI. This section contains the required settings for Prime NAM.
Use your vendor's user documentation to ensure you have properly configured the iSCSI array. The Cisco Prime NAM is independent of most array settings, but some are important for accessibility and performance.
Step 1 To configure the disk volumes on the array there is often a Segment Size setting. Larger segment sizes can improve write speeds. Configure the Segment Size setting to use the largest possible segment size (up to 512 KB).
Multiple volumes can be configured on a single array.
Step 2 Assign a Logical Unit Number (LUN) to the disk volume. This number is used for volume identification by the host.
Step 3 Map the LUNs to iSCSI Qualified Names (IQNs) on the array. The NAM's local IQN is listed using remote-storage iscsi local-iqn . Each IQN represents a different list of LUNs which hosts (such as the Prime NAM) can access.
Prime NAM supports up to 32 LUNs between all protocols and multiple LUNs mapped to one IQN.
Step 4 Prime NAM also has an IQN, which represents the host side of an iSCSI session. You must give the Prime NAM’s IQN address access to the iSCSI array’s LUNs. The array calls this Host Access. Be sure to give the Prime NAM’s IQN read-write access. Most arrays require this for security reasons to ensure that only certain hosts can access the LUNs.
Each Prime NAM has a unique IQN, so perform this required step for each Prime NAM that requires access and for each target LUN that you want to access. For more details about which CLI command to use, see Locating the Prime NAM IQN.
Caution Only one Prime NAM should connect to a LUN because only one host can have write access at a time. If multiple Prime NAMs connect to the same LUN simultaneously, there will be access conflicts and capture operations may not work properly.
Step 5 Ensure the Prime NAM management Connecting the Storage Arrayport has IP connectivity to the iSCSI array. For details on how to complete this required task, see .
Locating the Prime NAM IQN
To find the Prime NAM IQN, use the remote-storage iscsi local-iqn CLI command:
For details on how to complete the storage array configuration, see Connecting the Storage Array.
Connecting the Storage Array
After you configure the iSCSI storage arrays, ensure that the array has an IP path to the Prime NAM management port. The array can be connected while the Prime NAM is running.
Some arrays come with multiple storage controller modules. As a security feature, module ownership must often be mapped to each LUN or IQN.
The Prime NAM logs into the storage to start an iSCSI session using the IP address and IQN(s) of the storage array.
To connect the storage array using the user interface:
Step 1 Log into the Prime NAM web interface. To access the Data Storage page, choose Capture > Packet Capture/Decode > Data Storage .
Step 2 Click iSCSI Login and enter the iSCSI array IP address. Then click Search IQN Targets.
A list of IQNs available to the Prime NAM host IQN appear.
Step 3 Depending on the outcome, perform one of the following steps:
a. If the IQNs do not appear, check remote-storage iscsi list to verify the iSCSI session was properly started.
The follow example shows how to verify the iSCSI session.
root@
nam.domain
# remote-storage iscsi list
Target IQN: iqn.2011-09:celeros.target11
tcp: [8] 172.20.122.81:3260,1 iqn.2011-09:celeros.target11
The LUN number (in the above example, LUN 4) helps you identify one LUN from others mapped to the same IQN. This number is unique to each IQN, meaning two LUNs from different IQNs can have the same number.
b. If the iSCSI session was properly started, check the storage array configuration to verify that:
c. If you make any configuration changes, logout of the iSCSI session and login again. To logout, use the CLI remote-storage iscsi logout or use the GUI and click iSCSI Logout . All LUNs mapped to that target IQN will be disconnected from the Prime NAM.
Preparing LUNs for File Storage
Some arrays come with multiple storage controller modules, and the module ownership must often be mapped to each LUN (Logical Unit Numbers). This is a common security feature.
To see if the NAM can access the storage array LUNs and prepare them to store files:
Step 1 Choose Capture > Packet Capture/Decode > Data Storage .
New LUNs which have not been used by the NAM show a status of Unformatted .
a. Skip to Step 3 if your LUNs are formatted.
b. If no LUNs appear, see Installing and Configuring Local and External Storage and Configuring the iSCSI Array for detailed instructions on how to set up your storage array.
Step 2 To prepare these LUNs for capture use, select the LUN and click Format . After a few minutes, the status should change to Ready .
Step 3 To apply optional user labels to the LUNs to help differentiate between them, select the LUN and click Label .
The Label dialog appears with information about the current label and the last time the LUN was formatted.
You are now ready to use the external storage for capture files.
Using LUNs to Store Packets from a Capture Session
To use a LUN to store packets from a capture session:
Step 1 Go to Capture > Packet Capture/Decode > Sessions .
Step 2 Under the Capture Sessions table, click Create .
Step 3 Fill in the appropriate fields for creating a session, and for Storage Type choose the Files option.
Step 4 Use the File Location table to select the LUN you wish to use. Each list entry includes the protocol and either the model or the user label if it is set. Note that the list will only include targets which are in the Ready state.
Step 5 Click Submit to create the session.
When a session is STARTED , the associated LUN state changes to In Use . At that point, no other session can use that LUN until the session is deleted. This prevents contention, corrupted data, and write bandwidth degradation.
Logging In and Out of External Storage LUNs
You can use iSCSI to facilitate data transfers over intranets and to manage your remote capture data storage.
Prime NAM provides a more streamlined workflow to log in and out of your data storage targets. You must log into iSCSI in order to save capture sessions to remote storage. If you do not log in, capture sessions are saved to either local disk or memory locations.
To log in or out of your available remote data storage LUNs:
Step 1 Ensure you have configured your target iSCSI system with read/write permission to your NAM for at least one LUN in the storage array. For details, see About Capturing to Data Storage.
Step 2 Choose Capture > Packet Capture/Decode > Data Storage and click iSCSI Login .
Step 3 To enable auto discovery of any iSCSI Qualified Name (IQN) target, enter the target IP address of the storage location and click Search IQN Targets .
All available IQNs for that location display in the table.
Step 4 To log out, click iSCSI Logout . The list of IQNs to which you are currently logged into displays in a table.
Step 5 To view the LUNs which the system will log you out, select one of the IQNs and a popup displays the associated LUNs to select.
Connecting and Disconnecting External Storage
Before physically disconnecting an external storage device, it is highly recommended to use the Unmount button on the Capture > Packet Capture/Decode > Storage window. This notifies the Cisco NAM that the device will be disconnected, so that the Prime NAM can perform important cleanup procedures. After this is done, the storage target displays as Unmounted in the status column, and it is safe to remove the external storage device. External storage is automatically unmounted in this manner when the Cisco NAM is powered down.
Caution If this step is skipped, it is possible to corrupt the storage data upon physical disconnect.
If a device has been logically disconnected using the Unmount button, but the storage is still physically connected, it can be reactivated using the Mount button. It will restore the storage target’s previous state. This makes it unnecessary to physically disconnect and reconnect the storage, which can be particularly useful if the storage is located far away from you.
Recovering Data Storage
In the event that a previously working target displays as Unformatted , you can use the CLI to determine what happened by running a filesystem check on it. Use the command remote-storage <protocol> fsck <storage ID> , when you know the protocol. You can find the storage ID using remote-storage <protocol> list . The filesystem check can potentially resolve filesystem corruption or state issues. If the command succeeds, it automatically mounts the storage and displays as Ready .
Inspecting Packet Decode Information for Suspicious Traffic
After you have captured some traffic data packets, you can use the NAM packet decoder to view the packet contents and inspect for suspicious traffic.
This section includes the following sections:
- Analyzing Packets in the Packet Decoder
- Filtering Packets Displayed in the NAM Packet Decoder
- Viewing Detailed Protocol Decode Information
- Understanding the NAM Packet Decoder
Analyzing Packets in the Packet Decoder
Figure 4-8 Packet Decoder Window
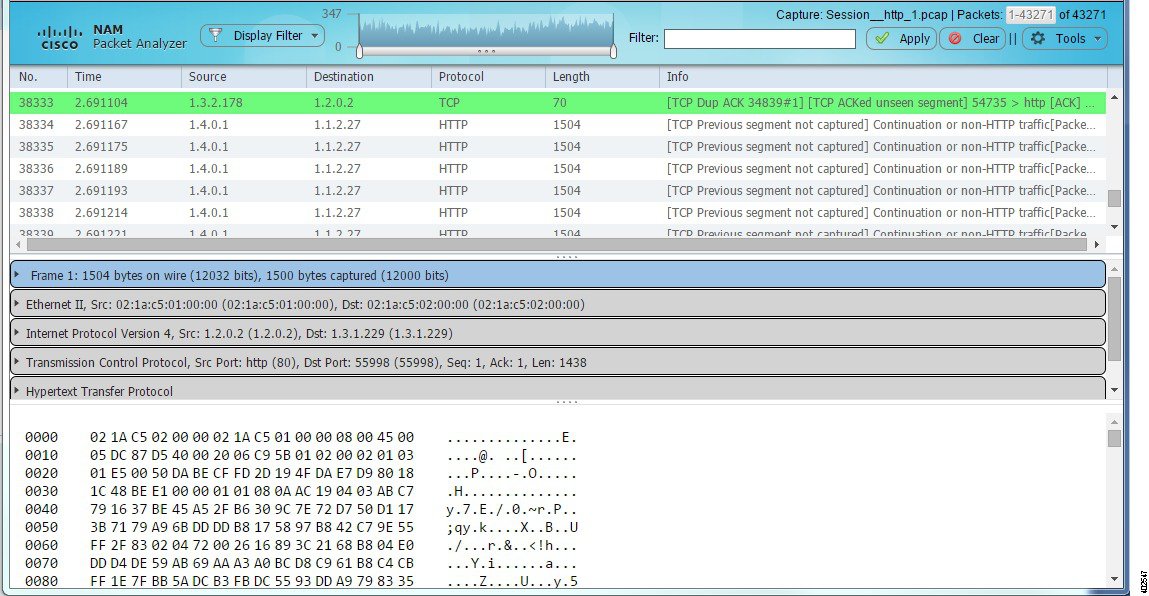
Note To use these decode features, you must be capturing to memory with the no rotate option selected. Otherwise, captures must be paused or stopped. For detailed descriptions about the features in this window, see Understanding the NAM Packet Decoder.
To inspect packet decode information for suspicious traffic:
Step 1 Choose Capture > Packet Capture/Decode > Sessions and create a capture session. If you already have a capture session choose Capture > Packet Capture/Decode > Files .
Step 2 Choose a capture session or file, and then click Decode . The Packet Decoder window displays. See Figure 4-8. For table descriptions see Table D-66 .
Step 3 To quickly filter on a key word or phrase, for example rtp to focus on voice quality, enter the word in the Filter text box (see Figure 4-8). The window refreshes displaying only data that includes the filtered information.
Step 4 To filter packet data based on multiple filters, click Display Filter and enter your options in the window, then click Apply . This action displays only the distribution of the packets that match your filter. For detailed steps, see Filtering Packets Displayed in the NAM Packet Decoder.
Step 5 To save filters for future use, click Save Display Filters on the Display Filter window. You can also edit or remove existing filters as needed.
Step 6 To view the packet capture flow and focus in on a specific time interval or area of interest click on the slider in the Packet Histogram and move the left or right cursors to zoom in (see Figure 4-8). To pan this filtered data, click and hold the slider while moving it inside the histogram. This provides a visual of packet capture flow and enables you to navigate through the packet list.
Step 8 To disable the default colors in the packet window, choose Tools > Disable Protocol Coloring .
Step 9 To review capture file information, choose Tools > Capture Info .
Step 10 To save the current filtered packet info displayed on this page, choose Tools > Save Filtered Packets . Only visible when filters are in use. Saves to memory or to the capture file based on the options in your Capture Sessions window. See Configuring Capture Sessions.
Step 11 To make the font size larger or smaller for the hex data pane, hover over the top-right corner of the pane to see the enlarge option. To increase the font, select the A+ or to decrease it select the A- .
Step 12 Use the Tools menu to perform validation tasks—options have limited support. Options include:
– TCP Checksum Validation check box—filter on TCP in the decode window and use the TCP pane to verify that the checksum has been validated.
– UDP Checksum Validations check box—filter on UDP in the decode window and use the UDP pane to verify that the checksum has been validated.
– IP Host Name Resolution—perform global host name resolution for NAM. Synchronizes with the Administration preferences.
Step 13 Use Decode As option to temporarily force specific tcp and /or udp ports to be decoded as the specific protocols as specified by the user. This is useful for custom protocols that use user defined ports or the same ports may be used by more than one protocols
Step 14 To view packet details including packet range displayed, data port, and number of filtered packets, see the heading in the upper right corner of the NAM window.
Step 15 To reconstruct files from the capture file, choose Tools > Export Objects , then choose either HTTP, FTP, SMB or IMF(Email) from the protocol drop-down list.
A dialog will be displayed to show all the exported files. See Table 4-2 for description of the fields in this dialog.
Table 4-3 Description of the fields in object list dialog.
Note The exported file will be corrupted if any lost segments and/or out-of-order packets in the packet stream.
Note Empty file will not be listed in the dialog. The exported ftp file will be incomplete when FTP pause and resume happens.
Filtering Packets Displayed in the NAM Packet Decoder
To filter packets based on multiple options for display in the NAMPacket Decoder:
Step 1 From the NAMPacket Decoder, click Display Filter . The NAM - Display Filter Window displays.
– Inclusive displays packets that match the condition(s.)
– Exclusive displays packets that do not match the condition(s).
– IP/Host address filters on IP address.
– MAC address filters on MAC address.
– Source allows you to specify the source address, or leave it blank if not applicable.
– Destination allows you to specify the destination address, or leave it blank if not applicable.
– Both Directions allows you to match of packets traveling in both directions.
– Click Match any (or) to display packets that match any of the protocols or fields.
– Click Match all (and) to display packets that match all of the protocols or fields.
– Choose a protocol from the Protocols list.
Note You can enter the first few letters of the protocol name to go directly to the protocol. If you make a typo, press ESC or SPACE to reset.
– Choose a protocol field from the Fields list, then specify the field value if applicable.
Step 3 To add more protocol filters, click the + sign.
Step 4 To delete a defined Protocol Filter, click the - sign.
Step 5 Click OK to apply the filter and close the window or Apply to apply the filter and keep the window open.
Viewing Detailed Protocol Decode Information
To view detailed protocol information:
Step 1 Highlight the packet number about which you want more information.
Detailed information about that packet is displayed in the Protocol Decode and hexadecimal dump panes at the bottom of the window.
Note If you highlight the details in the Protocol Decode pane, the corresponding bytes are highlighted in the hexadecimal dump pane below it.
Step 2 To review the information, use the scrolling bar in the lower panes.
Note When you decode SCCP traffic, Prime NAM lists the protocol as skinny, not SCCP.
Tip • Protocols are color coded both in the Packet Browser and the Protocol Decode pane.
- Choose the protocol name in the Protocol Decode pane to collapse and expand protocol information.
- To adjust the size of any of the panes, click and drag the pane frame up or down.
Understanding the NAM Packet Decoder
The NAM, also known as the packet decoder, uses two levels of packet analysis: basic and full. Because preparing a large capture file for full analysis can take a long time, NAM automatically chooses which level to use based on your filtering complexity. This allows you to browse your captured packet data more quickly without having to wait for analysis.
When you select a capture file to analyze for the first time, NAM limits some of the more complex display filters you can use. For example, you can filter using protocol identifiers such as TCP, UDP, SDP, and SIP which allow the packet decode to display more quickly than an advanced filtering selection.
If you enter more advanced filters (such as those with and/or logic operators on the protocol field), NAM automatically begins the full analysis of the capture file and then applies your complex filter to display the results. For example, if you filter using ‘ip.src==192.168.1.1 && tcp.dstport==80’, the NAM starts the full analysis and displays it only after the results have been filtered.
Understanding the NAM Packet Decoder Window and Browser Pane
The NAM Packet Decoder window shows three views of a packet:
- a summary line briefly describes the packet type
- the protocol field of interest can be shown and analyzed in the portion of the window directly below the summary line
- a hexadecimal dump shows exactly what the packet looks like when it goes across the wire.
There are many unique features in the NAM Packet Decoder decode window; for example, it can assemble all the packets in a TCP conversation and highlight the ASCII data in that conversation. You can use the expanded display filter functionality to allow you to view more focused data.
Figure 4-8 is an example of the NAM Packet Decoder window.
You can perform the following tasks in the NAM window:
- Show Packet histogram display the number of packets over a specific time range. This provides a feel of the packet flow for the capture. You can use the histogram selector control to navigate through the packet list as well. You can apply a display filter to make the histogram show the distribution of the packets that match the applied filter. Can set time range and move across histogram. Firefox is faster than IE performance with this feature.
- Toggle to Show Packet Paging Controls displays the buffer divided into pages.
- Toggle layout changes how the three content panes in the decoder are arranged.
- Display Hex data font size by hovering over two buttons in the top right corner of the hex data content pane of the decoder. You can increase or decrease the font size of the contents.
- Display the current range of packets in the packet list by selecting the Packet range button. You can also enter the range of packets to view.
- Use the Display Filter button yo display Saved Display Filters and Manage Display Filters windows.
- Alter Protocol coloring. You can map custom colors to specific protocols in this release. Default colors
- Use the Tools menu—options have limited support. Options include:
– TCP Checksum Validation check box—filter on TCP in the decode window and use the TCP pane to verify that the checksum has been validated.
– UDP Checksum Validations check box—filter on UDP in the decode window and use the UDP pane to verify that the checksum has been validated.
– IP Host Name Resolution—perform global host name resolution for NAM. Synchronizes with the Administration preferences.
Customizing Display Filters
Use custom display filters to create and save customized filters to use in the NAM decode window to limit which packets are displayed.
NAM supports most software display filters with the following exceptions:
See these topics for help setting up and managing custom display filters:
Creating Custom Display Filters
To create custom display filters:
Step 1 Choose Capture > Packet Capture/Decode > Sessions .
The Hardware Filters box is displayed at the bottom of the page.
Step 2 Click Create . The Hardware Filters Dialog box displays. See Table D-64 .
Step 3 Enter information in each of the fields as appropriate.
Step 4 Do one of the following:
Tips for Creating Custom Decode Filter Expressions
You can construct custom decode filter expressions using the following logical and comparison operators listed in Table 4-4 .
To group subexpressions within parentheses, use the fields in Table D-63 to help you add filter expressions.
Examples of Custom Decode Filter Expressions
Table 4-5 provides some examples of basic NAM display filters you can use to filter on application types.
Table 4-6 provides some examples of complex NAM display filters.
Table 4-7 provides some examples of protocol field hexbyte filters.
Table 4-8 provides some examples of protocol field hexbyte subrange filters.
Table 4-9 provides some examples of hexbyte data representations syntax.
Note You can use a filter expression with other fields in the Custom Decode Filter dialog box. In this case, the filter expression is ANDed with other conditions. Invalid or conflicting filter expressions result in no packet match.
Editing or Deleting Custom Display Filters
To edit custom display filters:
Step 1 From the NAM Packet Decoder, choose Display Filters .
Step 2 To edit a filter, choose the filter to edit then click Edit .
Step 3 Change the information in each of the fields as appropriate.
Step 4 To delete a filter, choose the filter to delete from the Hardware Filters Data Port 1 or Data Port 2 pane, then click Delete .
 Feedback