Getting Started with Monitoring and Alerting in a Cisco SAN Fabric
Available Languages
Bias-Free Language
The documentation set for this product strives to use bias-free language. For the purposes of this documentation set, bias-free is defined as language that does not imply discrimination based on age, disability, gender, racial identity, ethnic identity, sexual orientation, socioeconomic status, and intersectionality. Exceptions may be present in the documentation due to language that is hardcoded in the user interfaces of the product software, language used based on RFP documentation, or language that is used by a referenced third-party product. Learn more about how Cisco is using Inclusive Language.
- US/Canada 800-553-2447
- Worldwide Support Phone Numbers
- All Tools
 Feedback
 Feedback
Overview of Monitoring and Alerting in a Cisco SAN fabric
Access mechanisms in a Cisco SAN fabric
MDS 9000 switches, UCS Manager, and DCNM – Initial Setup
Monitoring and Alerting of specific components
Note: The documentation set for this product strives to use bias-free language. For the purposes of this documentation set, bias-free is defined as language that does not imply discrimination based on age, disability, gender, racial identity, ethnic identity, sexual orientation, socioeconomic status, and intersectionality. Exceptions may be present in the documentation due to language that is hardcoded in the user interfaces of the product software, language used based on RFP documentation, or language that is used by a referenced third-party product.
This document provides a step-by-step guidance to setup automated monitoring and alerting in a Cisco SAN fabric. The primary audience is first-time users of Cisco MDS 9000 switches, NX-OS, and Data Center Network Manager (DCNM) but experienced users can also benefit from it.
The command outputs, screenshots, and capabilities that are described in this document are based on Cisco NX-OS 8.4(2) for MDS 9000 switches and DCNM 11.4(1). Although the procedures and recommendations that are outlined in this document apply to most NX-OS releases for MDS 9000 switches and DCNM, we recommend referring to the release notes and the configuration guides for the up-to-date information. Also, it is an overview document, primarily aimed at the new users. For details on specific topics, please refer to the White Papers and Configuration Guides listed in the references section.
Overview of Monitoring and Alerting in a Cisco SAN fabric
Cisco MDS 9000 switches have hardware and software sensors to collect metrics and logs in real time. The hardware sensors are integrated within all the components. For example:
1. Sensors on port-ASICs collect metrics from wire-data for congestion monitoring, utilization, link-integrity, and so on.
2. Sensors on port-modules, supervisor modules and fabric modules monitor general health, temperature, hardware failures, and so on.
3. Sensors on power supplies, fan trays, and other hardware components monitor environmental conditions.
It is not an exhaustive list and is provided here for a reference only. Cisco NX-OS collects the sensor data and listens for any events that are generated by the hardware sensors. Based on the severity, the events are categorized under various levels, for example, Emergency, Critical, Informational, and so on. Finally, the events can be sent to remote monitoring systems via notification mechanisms, for example, SNMP, Syslog, and Call Home.
While Cisco NX-OS manages, monitors, and generates alerts from a single switch, Cisco DCNM can do the same for multiple switches and fabrics. It offers an intuitive web-UI to monitor the underlying SAN fabric. DCNM receives the hardware and software sensor data that is collected by Cisco NX-OS and MDS 9000 switches and it maintains long-term trends and seasonality. Also, DCNM receives event notifications that are generated by the switches and can forward them to a compatible third-party application.
In addition to monitoring the health of a SAN fabric, it is possible to monitor the storage performance using Cisco SAN Analytics. The MDS 9000 switches inspect the end-to-end SCSI and NVMe transactions to collect performance metrics in real time. Finally, the metrics are exported via streaming telemetry to SAN Insights, which is an analytics engine within DCNM.
Access mechanisms in a Cisco SAN fabric
The access mechanisms in a Cisco SAN fabric that are built using MDS 9000 switches can be used for the following functions.
· Configuration
· Monitoring
· Event notifications
The following subsections provide an overview of these functions.
Configuring an MDS 9000 switch requires read-write access to it. This section provides an overview of the commonly used mechanisms to make configuration changes on the MDS 9000 switches. Detailed configuration options are outside the scope of this document.
For more details, please refer to the references section to access the Cisco MDS 9000 Configuration guides.
CLI access is achieved over an SSH session to make configuration changes using the Cisco NX-OS commands. For example, the following snippet displays the steps to enable a Fibre Channel interface on MDS 9000 switches.
[user@~]%ssh -l admin <management_ip_address_of_the_switch>
User Access Verification
Password:
<snip>
MDS9000# configure
Enter configuration commands, one per line. End with CNTL/Z.
MDS9000(config)# interface fc1/1
MDS9000(config-if)# no shutdown
MDS9000(config-if)# end
MDS9000#
The preceding snippet shows accessing the NX-OS CLI from a Linux host using SSH. The same can be achieved from other types of hosts (for example, Windows) and SSH clients (for example PuTTY).
It is possible to make configuration changes to MDS 9000 switches using SNMP MIBs with read-write access. For example, SNMP object zoneDefaultZoneBehaviour (OID: 1.3.6.1.4.1.9.9.294.1.1.1.1.1) can change the behavior of the default zone in a VSAN.
For more details, please refer to the references section to access the Cisco MDS 9000 Series MIB Quick Reference Guide.
NX-API provides programmable access to the MDS 9000 switches over HTTP or HTTPS. NX-API can be used to make configuration changes on the switches to achieve automation and programmability.
For more details, please refer to the references section to access the Cisco MDS 9000 Series Programmability Guide.
MDS 9000 Software Development Kit (SDK)
The SDK provides programmable access to the MDS 9000 switches. It leverages NX-API and CLI to communicate with the switches while abstracting the lower-level details from an end user. This SDK simplifies the rapid development of automation and programmable infrastructure to configure the SAN fabrics that are built using MDS 9000 switches.
For more details, please refer to the references section to access the MDS SDK repository on GitHub and its documentation.
Cisco DCNM REST APIs enable programmable access to the managed SAN fabric. DCNM REST APIs are self-documented and can be accessed by clicking on the username on the top-right corner of the screen. Click REST API Tool and then, click API-docs. It is also possible to try and execute the APIs using this tool.
|
|
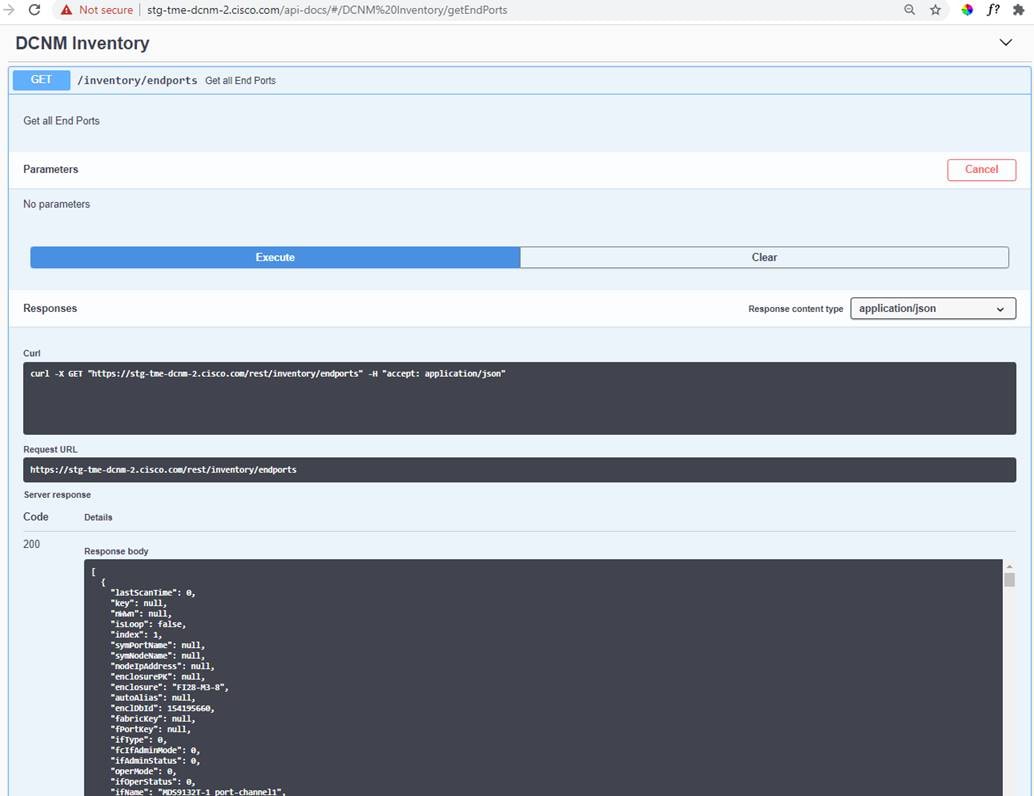
DCNM REST API tool
For more details, please refer to the references section to access the Cisco DCNM REST API Reference Guide.
Monitoring an MDS 9000 switch requires read-only access to it. This section provides an overview of the commonly used mechanisms to monitor the MDS 9000 switches.
CLI access is achieved over an SSH session to monitor the hardware and the software components on MDS 9000 switches using the NX-OS show commands. For example, the following snippet displays the steps to monitor the input and the output traffic rate on a Fibre Channel interface.
[user@~]%ssh -l admin <management_ip_address_of_the_switch>
User Access Verification
Password:
<snip>
MDS9000# show interface fc1/1 counters brief
-------------------------------------------------------------------------------
Interface Input (rate is 5 min avg) Output (rate is 5 min avg)
----------------------------- -----------------------------
Rate Total Rate Total
MB/s Frames MB/s Frames
-------------------------------------------------------------------------------
fc1/1 178 1205015867909 241 1724344685965
MDS9000#
The preceding snippet shows accessing the NX-OS CLI from a Linux host using SSH. The same can be achieved from other types of hosts (for example, Windows) and SSH clients (for example PuTTY).
SNMP provides an extensive set of MIBs to monitor hardware and software components on MDS 9000 switches. For example, SNMP object zoneNumber (OID: 1.3.6.1.4.1.9.9.294.1.1.6) can display the number of entries present in the zone table. Using SNMP, a remote monitoring agent can poll the switches (commonly known as SNMP polling) to monitor the switches. The frequency of polling the MDS 9000 switches depends upon the type of the metric. For example, congestion (slow-drain) metrics can be polled every few seconds while memory utilization of a switch can be polled every few minutes.
For more details, please refer to the references section to access the Cisco MDS 9000 Series MIB Quick Reference.
NX-API provides programmable access to the MDS 9000 switches over HTTP or HTTPS. NX-API can be used to request the output of show commands in the JSON or XML format. The recommended frequency of the request depends upon the type of the metric. For example, congestion (slow-drain) metrics can be requested every few seconds while memory utilization of a switch can be requested every few minutes.
For more details, please refer to the references section to access the Cisco MDS 9000 Series Programmability Guide.
MDS Software Development Kit (SDK)
The SDK provides programmable access to the MDS 9000 switches. It leverages NX-API and CLI to communicate with the switches while abstracting the lower-level details from an end user. This SDK simplifies the rapid development of automation and programmable infrastructure to monitor MDS 9000 fabrics.
For more details, please refer to the references section to access the MDS SDK project on GitHub and its documentation.
Streaming Telemetry is a push mechanism for high-fidelity metric export from the MDS 9000 switches. The primary use-case is to export IO flow metrics collected by Cisco SAN Analytics. For example, MDS 9700 directors running NX-OS 8.4(2) collects up to 70 metrics for 40,000 flows. This results in an export of 2.8 million metrics at every export interval of 30 seconds.
As of NX-OS 8.4(2), MDS 9000 switches support streaming telemetry using gRPC transport with (compact) GPB encoding. In addition to the IO flow metrics collected by SAN Analytics, interface metrics can also be exported using streaming telemetry.
For more details, please refer to the references section to access the Cisco MDS 9000 Series SAN Analytics and SAN Telemetry Streaming Configuration Guide.
It is possible to monitor various components of the managed SAN fabric using the DCNM REST APIs, for example, inventory, performance data, topology and so on. DCNM REST APIs are self-documented and can be accessed by clicking on the username on the top-right corner of the screen. Click the REST API Tool and then, click API-docs. It is possible to try and execute the APIs using this tool.
For more details, please refer to the references section to access the Cisco DCNM REST API Reference Guide.
MDS 9000 switches can automatically send event notifications to a remote receiver in response to a local event.
It is possible to open a CLI session to MDS 9000 switches to display the events, as they are generated in the real time. These events are called system messages. A limited number of system messages can be stored on the switch for a historic view. Although this approach is commonly used for active troubleshooting in real time, it is not strictly an unsolicited event notification mechanism to a remote agent.
For example, please refer to the following snippet showing a system message when the operational state of an interface goes down.
2020 Jun 22 14:31:24 MDS9710-A %PORT-5-IF_DOWN_NONE: %$VSAN 1%$ Interface fc3/46 is down (None)
The printing of system messages on the console or terminal is disabled by default. To enable this functionality, please use #terminal monitor command.
A limited number of system messages are stored on the switch and can be displayed using # show logging [logfile | nvram] command, as show in the following snippet.
MDS9710-A# show logging nvram
2020 Mar 4 09:53:30 MDS9710-A %PLATFORM-2-PS_OK: Power supply 5 ok(Serial number DTM16510042)
2020 Mar 4 09:53:30 MDS9710-A %PLATFORM-2-PS_FANOK: Fan in Power supply 5 ok
2020 Mar 4 09:53:30 MDS9710-A %PLATFORM-2-PS_OK: Power supply 6 ok(Serial number DTM172403YW)
2020 Mar 4 09:53:30 MDS9710-A %PLATFORM-2-PS_FANOK: Fan in Power supply 6 ok
<snip>
For more details, please refer to the references section to access the Cisco MDS 9000 Series System Management Configuration Guide.
SNMP provides an extensive set of MIBs to notify a remote agent via traps and informs. These notifications are generated in response to a locally generated event. For example, SNMP object linkDown (OID: 1.3.6.1.2.1.11.0.2) is a trap to notify that the operational state of a switch port has gone down.
For more details, please refer to the references section to access the Cisco MDS 9000 Series MIB Quick Reference.
Events on MDS 9000 switch are logged as system messages carrying timestamp, device id, facility name, severity, and a text description of the event. These systems messages can be sent to remote Syslog servers.
The MDS 9000 switches support 8 levels of message severity, from level-0 (Emergency) to level-7 (Debug). By default, system message with level-5 severity (Notifications) and lower are enabled. It is possible to customize the severity of the messages that are generated by a facility and, also control what is sent to a remote Syslog server. For more details, please refer to the references section to access the Cisco MDS 9000 Series System Management Configuration Guide.
Critical events can be notified via emails, directly by the MDS 9000 switches using Call Home or by DCNM using event forwarding.
MDS 9000 switches can send event notifications via email using the Call Home functionality.
For more details, please refer to the references section to access the Cisco MDS 9000 Series System Management Configuration Guide.
DCNM acts as a centralized repository of all the events and can be the single source to generate emails to multiple destinations. The switches in the managed SAN fabric can send events to a DCNM server via any of the above-mentioned mechanisms, for example, SNMP and Syslog. Based on the configured rule and filtering, DCNM can forward the events via email for urgent attention of the owners or for automated ticketing systems.

Comparison and Usage recommendations
Choosing the correct mechanism for monitoring and event notification depends on the use-cases and the capability of the monitoring application. This section provides high-level guidelines about various available options.
Cisco SAN Fabric managed with DCNM
Cisco SAN fabric managed and monitored by DCNM is an end-to-end validated solution. The best monitored and notification mechanisms are used by default. For example, as of DCNM 11.4(1) and NX-OS 8.4(2):
1. Interface utilization is monitored using SNMP polling.
2. IO flow metrics that are collected by SAN Analytics are received by streaming telemetry.
3. Events are received by SNMP traps or informs and Syslog.
The preceding is not an exhaustive list and provided here for a reference only.
Using your own or third-party application
It is best to refer to the recommendations of the third-party vendor to choose the best metric export or notification mechanism. If you are building your app or customizing an existing app (for example, an open-source monitoring application), please consider the following recommendations.
SNMP provides maximum coverage for monitoring and is widely supported by Cisco and third-party products. NX-API support was added on MDS 9000 switches in 2016. Commonly used features are available via NX-API at the time of writing this document, but the feature coverage is not as extensive as SNMP. Streaming telemetry supports the monitoring of IO flow metrics and interface metrics only as of NX-OS 8.4(2) for MDS 9000 switches.
SNMP is known to be a resource-intensive protocol. The MDS 9000 switches have powerful CPUs. But high-frequency monitoring is best achieved by a newer and optimized mechanism like NX-API and streaming telemetry. It is fine to continue using SNMP with legacy applications because rewriting the complete application may not be worth the effort. However, for any newer implementations, we recommend using NX-API for high-frequency monitoring of the MDS 9000 switches.
Streaming telemetry is the best option to export millions of metrics with minimal load on the switch. But it requires a gRPC receiver which may not be worth the effort just for exporting interface metrics.
SNMP is widely supported across industry. Newer monitoring applications support SNMP but also allow building custom receivers using the monitored agent APIs. NX-API can be used in such cases. Streaming telemetry is also a valid option, but it requires a dedicated gRPC receiver.
MDS 9000 switches, UCS Manager, and DCNM – Initial Setup
The initial setup of monitoring and alerting in a Cisco SAN fabric requires the following steps:
1. Setup MDS 9000 switches to be discovered by DCNM.
2. Setup UCS Manager to be discovered by DCNM. It is an optional step and is required only if you wish to monitor Cisco UCS Fabric Interconnect and servers using DCNM.
3. Setup DCNM.
The following subsections provide step-by-step details.
Initial setup of MDS 9000 switches and NX-OS before DCNM Discovery
As a first step, configure the network services like NTP, DNS, and so on. on the MDS 9000 switches. This step is important to keep correct timestamps in the outgoing event notifications, traffic utilization graphs on DCNM, streaming telemetry (if configured), and so on.
For more details on configuring the network services, please refer to the references section to access the Cisco MDS 9000 Series Fundamentals Configuration Guide.

Next, create an snmp-user on MDS 9000 switches. DCNM requires the IP address of just a single switch (known as a seed switch) to discover the entire fabric but the user and the password must be the same on all the switches.
The process of using a third-party monitoring application is similar. Please refer to the documentation of the third-party vendor for more details.
Cisco DCNM can monitor UCS Fabric Interconnects and the associated blade and rackservers when connected to a managed Cisco SAN fabric. This functionality requires the same snmp-user and password combination on the Cisco UCS Manager and SHA-AES authentication and privacy mode. Due to this reason, we recommend using the same auth-privacy mode on the MDS switches also. Even if the SAN fabric may not have UCS servers connected today, it still is best practice to avoid any changes in the future.

Creating a user on MDS switches for DCNM discovery
Use #snmp-server user command to create a local user with SHA-AES authentication and privacy mode. This user must have a network-admin role.
MDS9000#configure
MDS9000(config)#snmp-server user dcnmuser network-admin auth sha <> priv aes-128 <>
MDS9000(config)#
MDS9000(config)#end
MDS9000# show running-config | inc dcnmuser
username dcnmuser password 5 $5$5Cht7P1y$ZaR6bDvAo5dSt7KUjr4H7qoaOQ/7cyUq98Av5k3jDF3 role network-operator
username dcnmuser passphrase lifetime 269063912 warntime 279936932
snmp-server user dcnmuser network-admin auth sha 0x9eba83d512cd70bd34165e7f45af2962211c7be1 priv aes-128 0x9eba83d512cd70bd34165e7f45af2962211c7be1 localizedkey
MDS9000#
Initial setup of Cisco UCS Manager before DCNM discovery
DCNM can discover and monitor Cisco UCS Fabric Interconnects when connected to a managed Cisco SAN fabric. The discovery and monitoring are achieved via SNMP that is the same mechanism used to monitor the MDS 9000 switches. Starting DCNM 11.x, it is possible to monitor components beyond the Fabric Interconnects, for example, blade servers, vHBA, and vNICs. This enhanced monitoring is performed using UCS APIs and requires a read-only user in Cisco UCS Manager. Overall, an SNMP user is required for the discovery and monitoring of the UCS Fabric Interconnects while a separate read-only user is required for monitoring vHBA and vNIC traffic.
It is an optional step. Full functionality is available in DCNM if both the users are created and added correctly. If none of the users are created, DCNM can still discover the connected UCS Fabric Interconnects but is unable to show any more information on them. It is fine to reuse existing snmp-user and read-only user accounts if they already exist on UCS Manager.
It is important to setup basic network services like NTP, DNS, and so on. before enabling the monitoring and alerting of a Cisco UCS domain.
For more details, please refer to the references section to access the Cisco UCS Manager configuration guide.
Adding a SNMP user in Cisco UCS Manager
Navigate to Admin tab > Communication Management > Communication Services. Scroll down to the SNMP section and add a new SNMP user. For successful discovery by DCNM, it is mandatory to choose Auth Type as SHA and select the check box for AES-128. In some versions of UCS Manager, AES-128 is enabled by default. In such cases, no additional action is required by a user to select the privacy mode.
|
|
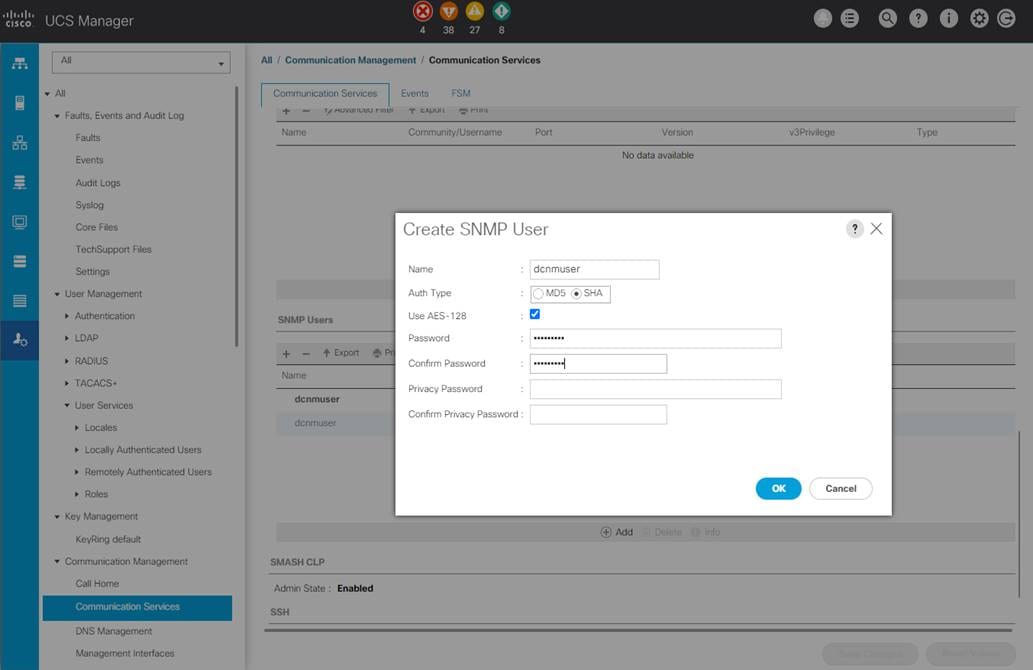
Adding an SNMP user in Cisco UCS Manager
We recommended using different names for snmp-user and read-only user (for example, dcnmuser for SNMP access and ucs_ro for API access). This scheme helps in cleaner implementation and better troubleshooting if discovery does not work correctly in the future.

Adding a read-only user in Cisco UCS Manager
Navigate to Admin tab > User Management > User Services. Go to locally authenticated users and add a new user. In Cisco UCS Manager, a user with no special roles is a read-only user.
|
|
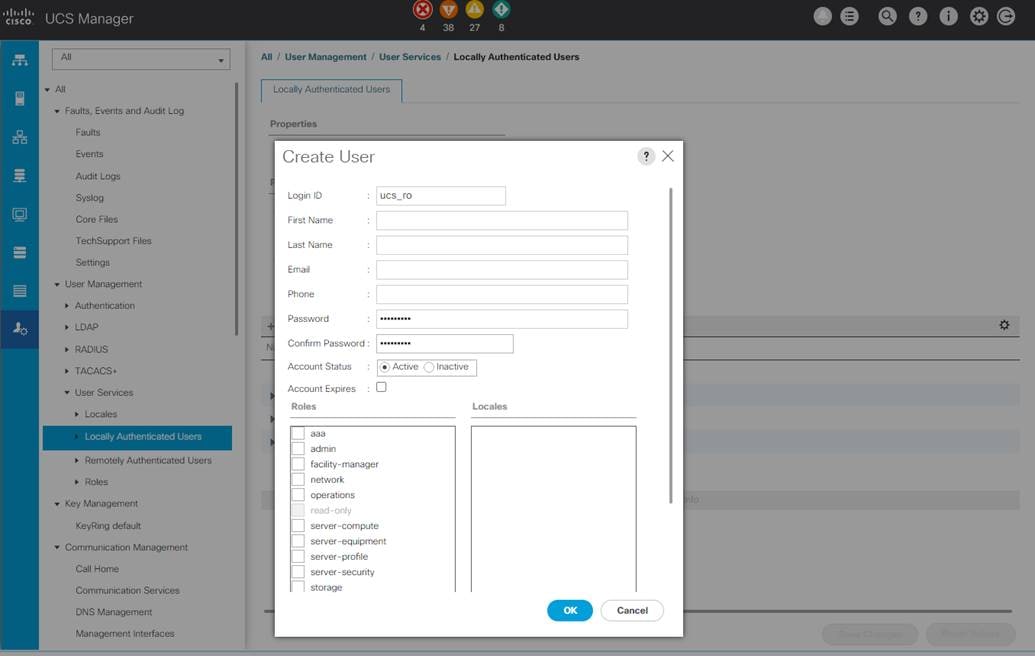
Adding a read-only user in Cisco UCS Manager
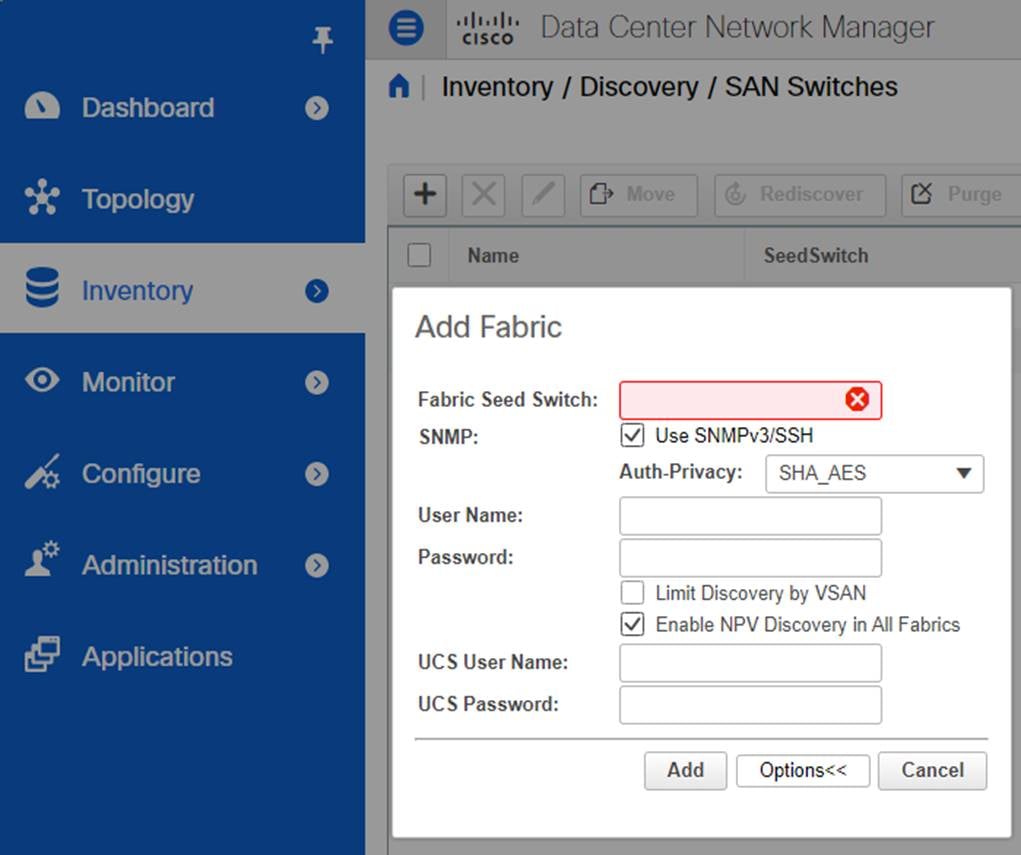
Before discovering a SAN fabric, DCNM must be correctly installed and setup for network services like DNS, NTP, and so on. For more details on DCNM installation, please refer to the references section to access the Cisco DCNM Installation and Upgrade Guide for SAN Deployment.
Log in to DCNM. Navigate to Inventory > Discovery > SAN Switches. Click + (Add) button. In the Fabric Seed switch text box, enter the IP address of any switch in the fabric. Select SHA_AES from the Auth-Privacy drop-down list as per the above-mentioned best practice. This step assumes that the User Name and the Password on the MDS 9000 switches have been created using the same auth and privacy mode. In the same pop-up window, click the Options button to display text boxes for UCS User Name and UCS Password. Under the UCS User Name, enter the read-only user (not the snmp-user) created in UCS Manager. The snmp-user in Cisco UCS Manager must be the same user as created on the MDS 9000 switches and already entered in the User Name text box.
Click Add. It takes a few minutes to completely discover the fabric. Repeat the preceding steps for adding multiple fabrics.
Discovering a SAN fabric is a mandatory step for DCNM to manage that fabric. Adding UCS is optional (but highly recommended) and is required only if you wish to monitor the Fabric Interconnects, Servers, vHBA, and vNIC using DCNM.
|
|
Discovering a SAN fabric and the connected UCS domains in DCNM
DCNM can detect the connected hypervisors (ESXi) and the hosted VMs. Navigate to Inventory > Discovery > Virtual Machine Manager and click + (Add) button to add VMware vCenter Server. To view the connected hosts, navigate to Dashboard > Hosts. Select a hypervisor host to display the hosted VMs.
It is an optional step but highly recommended.
DCNM can detect and display information from storage arrays using SMI-S. Navigate to Inventory > Discovery > Storage Devices and click + (Add) button. Select the storage array vendor from the drop-down list. The SMI-S server capability must be configured before adding the storage array in DCNM.
it is an optional step.
Setting login image and message of the day (MOTD)
Navigate to Administration > DCNM Server > Customization to add a custom image and message of the day (MOTD).
It is an optional step.
Navigate to Inventory > Discovery > SAN Switches. Select a discovered fabric and click the edit button. Rename the fabric to make it more relevant. For example, a fabric with the autodiscovered name of Fabric_MDS9718-A can be changed to Fabric_A.
It is an optional step but highly recommended.
Navigate to Administration > DCNM Server > Switch Groups. Click the Add button to create custom switch groups. Drag and drop the discovered fabrics under the switch group to create a hierarchy for global locations, data centers, floors, halls, fabrics, and so on. DCNM follows this hierarchy across all the screens to help in focusing on the relevant entities faster.
It is an optional step but highly recommended.

Following is an example of switch groups and the discovered fabrics under them.
US
NY
DC-1
Fabric-A
Fabric-B
DC-2
Fabric-A
Fabric-B
LA
DC-1
Fabric-A
Fabric-B
DC-2
Fabric-A
Fabric-B
Europe
London
DC-1
Fabric-A
Fabric-B
DC-2
Fabric-A
Fabric-B
Frankfurt
DC-1
Fabric-A
Fabric-B
DC-2
Fabric-A
Fabric-B
Asia
Singapore
DC-1
Fabric-A
Fabric-B
DC-2
Fabric-A
Fabric-B
Navigate to Administration > Manage Licensing > DCNM to install the appropriate licenses.
Enabling Performance Management
Monitoring the performance of the switch ports (for example, traffic utilization) is disabled by default. Enable this functionality by navigating to Administration > Performance Setup > SAN Collections. Select a fabric to enable SAN collections for ISL/NPV Links, Hosts, and Storage. Repeat this step for all the fabrics.
|
|
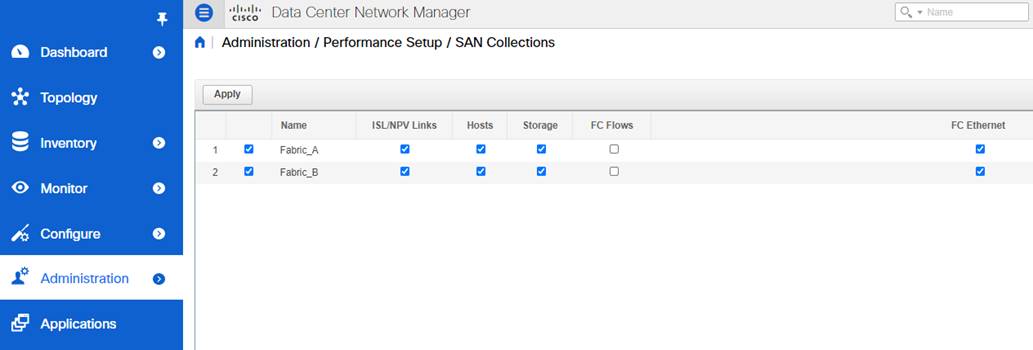
Enabling the collection of performance data in DCNM
This step requires restarting the Performance Collector service in DCNM. The status of various services and associated actions is available under Administration > DCNM Server > Server Status.
|
|
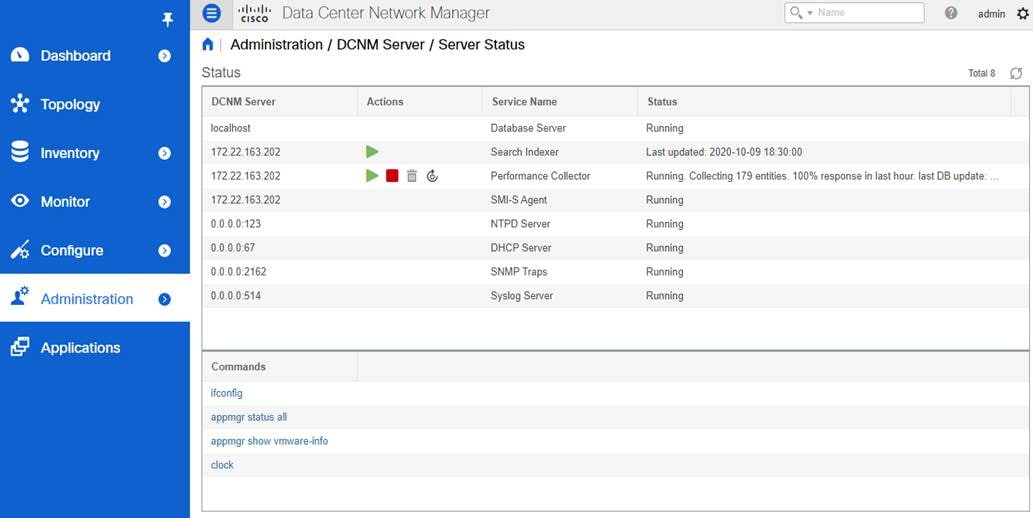
State of the DCNM server and services
It takes a few minutes for the performance graphs to display the data in DCNM. Navigating to Monitor > SAN > FC Ports and select the Performance tab to view the charts.
It is a mandatory step to display switch port utilization graphs in DCNM.
Setting up event notifications on MDS 9000 switches
DCNM uses SNMP to discover and monitor the MDS 9000 switches using the configured snmp-user. Discovering a SAN fabric by DCNM also sets itself as a receiver of the SNMP trap notifications but the Syslog notifications are not automatically enabled.

Setting up SNMP traps and informs destination
SNMP trap and inform destinations can be configured by NX-OS CLI or using DCNM.
To configure via DCNM, navigate to Inventory > View > Switches. Click a switch name under the Device Name column and select the Device Manager tab. In the Device Manager, select the Admin tab > Events > Destinations. Configure the IP address of the remote SNMP trap or inform destination. It can be the IP address of the DCNM server or any other compatible third-party application. DCNM configures itself as a receiver of SNMP trap when it discovers an MDS 9000 switch and starts managing it. No additional action is needed from a user.
|
|
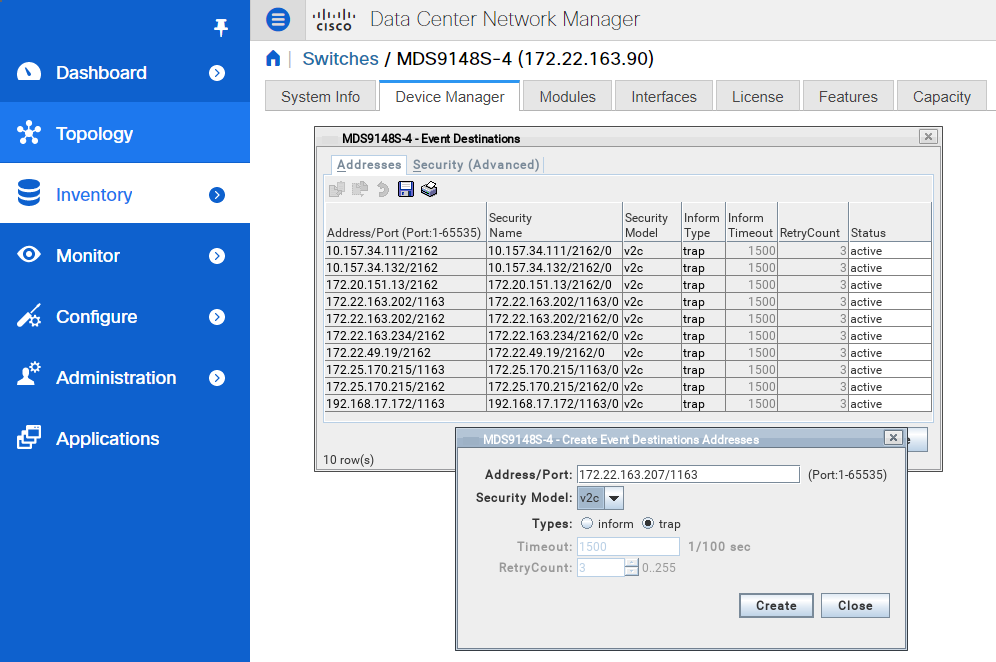
Setting up SNMP trap or inform destinations in DCNM
SNMP trap or inform destination can also be configured directly on the MDS 9000 switches using the # snmp-server host command.
MDS9710-A#configure
MDS9710-A(config)# snmp-server host <destination> traps version 2c <community_string>
MDS9710-A(config)# end
MDS9710-A#
Syslog destinations can be configured by NX-OS CLI or using DCNM.
To configure via DCNM, navigate to Inventory > View > Switches. Click a switch name under the Device Name column and select the Device Manager tab. In the Device Manager, select the Logs tab > Syslog > Setup. Configure the IP address of the remote Syslog destination. It can be the IP address of the DCNM server or any other compatible third-party application.
|
|
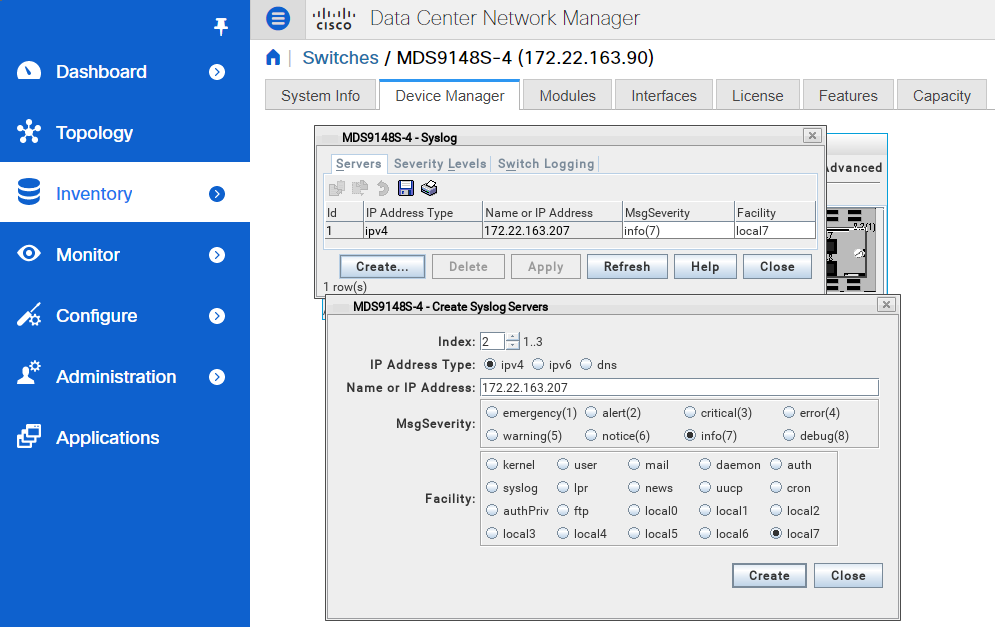
Setting up Syslog destinations in DCNM
Syslog destination can also be configured directly on the MDS 9000 switches using the # logging server NX-OS command.
MDS9710-A#configure
MDS9710-A(config)# logging server <destination>
MDS9710-A(config)# end
MDS9710-A#
It is possible to configure a syslog server on a single switch and distribute the same configuration to all the switches in the fabric using Cisco Fabric Services (CFS). It is the preferred approach in larger environment. Please refer to the preceding snippet.
switch# configure
switch(config)# switch(config)# logging distribute (to all fabric switches via CFS)
switch(config)# logging commit
For more information on logging distribute command, please refer to the references section to access the Cisco MDS 9000 Series System Management Configuration Guide.
Setting up Call Home
MDS 9000 switches can send event notifications via email using the Call Home functionality.
For details configuring Call Home, please refer to the references section to access the Cisco MDS 9000 Series System Management Configuration Guide.
Setting up event notifications in DCNM
DCNM provides event forwarding using SNMP traps or informs and emails. A valid SMTP server is required for email forwarding. To configure event forwarding in DNCM, navigate to Administration > Event Setup > Forwarding. After filling up general information (for example, SMTP Server), Click the Add (+) button under Event Forwarder Rules to configure specific rules.
|
|
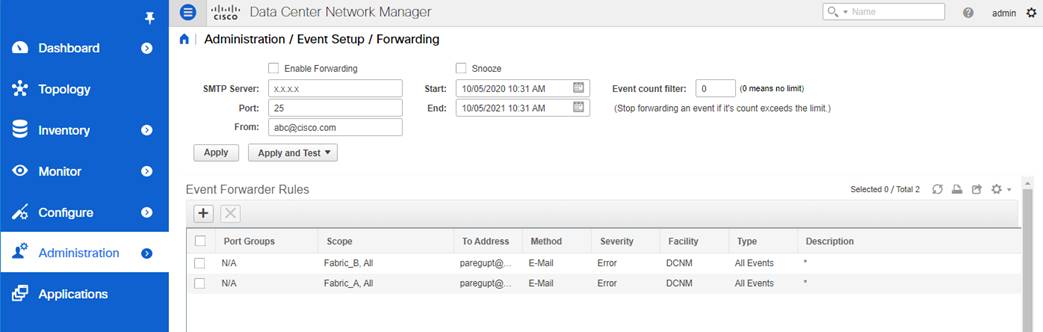
Setting up Event Forwarding in DCNM
A note on the number of monitoring agents, traps or informs, and Syslog destinations
Multiple monitoring agents can simultaneously monitor the same MDS 9000 switches. Similarly, push notifications via SNMP traps and informs, Syslog, and Call Home can be sent to multiple destinations. Although NX-OS allows configuring many destinations, we recommend limiting to 2 or 3 in order to prevent extra load on the monitored switch.

If more destinations are required, we recommend using the event forwarding feature of DCNM. Similar capability to relay the events is commonly available in other third-party applications also.
The destination of push notifications via SNMP or Syslog is explicitly configured on MDS 9000 switches. Hence, the number of destinations is known and can be limited by changing the configuration. On the contrary, the number of monitoring agents is not explicitly limited by an MDS 9000 switch. Many agents can simultaneously perform SNMP polling or send HTTP(s) requests causing extra load on the switch. There is little reason for more than 3 agents to simultaneously monitor the same switch. Any such access should be limited by user credentials and other security mechanisms such as Access Control Lists (ACLs) or network firewalls.
Monitoring and Alerting of specific components
The following subsections provide details on monitoring and alerting of specific hardware and software components on MDS 9000 switches and NX-OS. Details are provided for using DCNM and a compatible third-party application.
Correct interpretation of SNMP polling or to receive trap and inform notifications require the MIB file to be present on the monitoring agent. Cisco DCNM already carries all the MIB files and no additional action is required from a user. Using a third-party monitoring agent requires loading more MIB files into it. The required MIB files can be downloaded from the Cisco SNMP Object Navigator.
SNMP support is widely available across other Cisco and industry products. While using a generic SNMP MIB, please be cautious before overwriting any existing MIB files. The generic services are common and do not require an MDS 9000 specific MIB. For example, cseSysCPUUtilization is a generic SNMP object to monitor the CPU utilization for many Cisco products. MDS 9000 switches are purposefully built for Fibre Channel and hence, carry specific MIBs for Fibre Channel services. Such MIB must be loaded in the monitoring agent in addition to the existing MIB files.
For more details, please refer to the references section to access the Cisco MDS 9000 Family MIB Quick Reference. SNMP MIBs for specific components are provided in the following subsections.
For more details to translate OIDs into object names, their descriptions, browse OID trees, and to download the MIB files, please refer to the references section to access the Cisco SNMP Object Navigator.
General switch health can be monitored using the following NX-OS commands:
Table 1. NX-OS commands to check the overall switch health
| NX-OS command |
Description |
| show processes cpu < detailed | history | module | sort> |
Check the control-plane CPU utilization of the switch |
| show processes memory < physical | shared | sort> |
Check the memory utilization of the switch |
| show version |
Check the NX-OS version, uptime, switch model, and so on. |
| show < environment | hardware > |
Check the status of the hardware components of the switch |
The output of the preceding commands is also available via NX-API when requested by a remote agent over HTTP or HTTPS.
SNMP MIBs can be used to poll the general health of the switch, especially the CPU, and the memory utilization.
Table 2. General switch health SNMP Objects
| SNMP Objects |
OID |
Description |
| cseSysMemoryUtilization |
1.3.6.1.4.1.9.9.305.1.1.2 |
Percent utilization of memory |
| cseSysCPUUtilization |
1.3.6.1.4.1.9.9.305.1.1.1 |
Percent utilization of CPU |
Threshold-based alerting from common switch components
Use RMON to configure high-CPU, high-memory, and other similar alerts on MDS 9000 switch. RMON notifications are sent via SNMP trap or inform.
To configure RMON alerts from DCNM, navigate to Inventory > View > Switches. Select the switch from the Device Name column. Open Device Manager. Navigate to Admin tab > Events > Threshold Manager. Go to the Physical tab to set RMON alerts for high-CPU and high-Memory conditions.
|
|
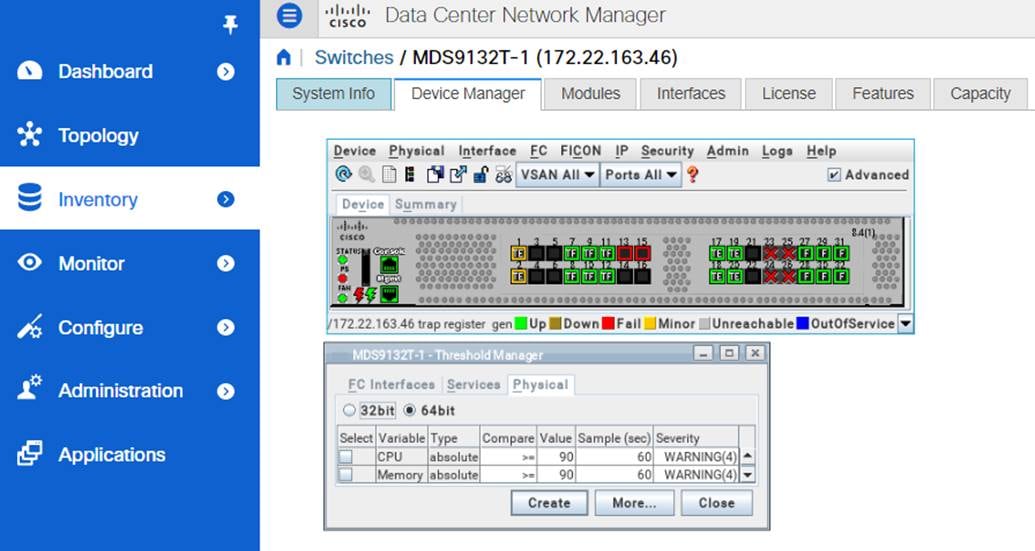
Configuring RMON events in DCNM

It is possible to set RMON alerts via NX-OS CLI but DCNM is recommended because it automatically translates SNMP OID to a user-friendly string. Please refer to the following snippet to configure the high-CPU and high-Memory RMON alerts using NX-OS.
MDS#configure
MDS(config)# rmon hcalarm 1 1.3.6.1.4.1.9.9.305.1.1.1.0 60 absolute startupalarm 1 rising-threshold 90 4 falling-threshold 89 4 owner user_1_cseSysCPUUtilization
MDS(config)# rmon hcalarm 2 1.3.6.1.4.1.9.9.305.1.1.2.0 60 absolute startupalarm 1 rising-threshold 90 4 falling-threshold 89 4 owner user_1_cseSysMemoryUtilization
MDS#
The RMON events are sent to the configured SNMP trap or inform destination, which can be DCNM or a compatible third-party application.
Monitoring of switch hardware components
The monitoring of switch hardware components is enabled by default. The notifications can be sent using Syslog and SNMP trap or inform. Email notifications can also be generated by MDS 9000 switches using Call Home or by DCNM event forwarding functionality.
The default enabled SNMP traps can be verified using #show snmp trap command. Please refer to the following snippet.
MDS9718-A# show snmp trap
--------------------------------------------------------------------------------
Trap type Description Enabled
--------------------------------------------------------------------------------
entity : entity_mib_change Yes
entity : entity_module_status_change Yes
entity : entity_power_status_change Yes
entity : entity_module_inserted Yes
entity : entity_module_removed Yes
entity : entity_unrecognised_module Yes
entity : entity_fan_status_change Yes
entity : entity_power_out_change Yes
link : linkDown Yes
link : linkUp Yes
link : extended-linkDown Yes
link : extended-linkUp Yes
link : cieLinkDown Yes
link : cieLinkUp Yes
link : connUnitPortStatusChange Yes
link : delayed-link-state-change Yes
callhome : event-notify No
callhome : smtp-send-fail No
cfs : state-change-notif No
cfs : merge-failure No
fcdomain : dmNewPrincipalSwitchNotify No
fcdomain : dmDomainIdNotAssignedNotify No
fcdomain : dmFabricChangeNotify No
fcsp : fcsp No
rf : redundancy_framework Yes
aaa : server-state-change No
license : notify-license-expiry Yes
license : notify-no-license-for-feature Yes
license : notify-licensefile-missing Yes
license : notify-license-expiry-warning Yes
scsi : scsi-lunDiscovery-complete No
fcns : reject-reg-req No
fcns : local-entry-change No
fcns : db-full No
fcns : remote-entry-change No
rscn : rscnElsRejectReqNotify No
rscn : rscnIlsRejectReqNotify No
rscn : rscnElsRxRejectReqNotify No
rscn : rscnIlsRxRejectReqNotify No
fcs : request-reject No
fcs : discovery-complete No
fctrace : route-test-complete No
zone : request-reject1 No
zone : merge-success No
zone : merge-failure No
zone : default-zone-behavior-change No
zone : unsupp-mem No
ipsec : CryptoMap-Added No
ipsec : CryptoMap-Deleted No
ipsec : CryptoMap-Attached No
ipsec : CryptoMap-Detached No
vni : virtual-interface-created No
vni : virtual-interface-removed No
vsan : vsanStatusChange No
vsan : vsanPortMembershipChange No
fspf : fspfNbrStateChangeNotify No
upgrade : UpgradeOpNotifyOnCompletion Yes
upgrade : UpgradeJobStatusNotify Yes
feature-control : FeatureOpStatusChange No
vrrp : cVrrpNotificationNewMaster No
fdmi : cfdmiRejectRegNotify No
sysmgr : cseFailSwCoreNotifyExtended No
rmon : risingAlarm Yes
rmon : fallingAlarm Yes
rmon : hcRisingAlarm Yes
rmon : hcFallingAlarm Yes
config : ccmCLIRunningConfigChanged No
snmp : authentication No
link : cisco-xcvr-mon-status-chg No
vtp : notifs No
vtp : vlancreate No
vtp : vlandelete No
zone : enhanced-zone-db-change No
entity : entity_sensor Yes
entity : cefcMIBEnableStatusNotification Yes
system : Clock-change-notification No
generic : coldStart Yes
generic : warmStart Yes
feature-control : ciscoFeatOpStatusChange No
syslog : message-generated No
entity : cefcEnablePSOutputChangeNotif Yes
vtp : notifs No
lldp : lldpRemTablesChange No
switchfabric : fabric-crc No
Traps and informs for more components can be enabled by # snmp-server enable traps command. Please refer to the following snippet.
MDS9718-A# configure
Enter configuration commands, one per line. End with CNTL/Z.
MDS9718-A(config)# snmp-server enable traps ?
<CR>
aaa Enable aaa traps
callhome Enable callhome traps
cfs Enable cfs traps
config Enable config traps
entity Enable entity traps
fcdomain Enable fcdomain traps
fcns Enable fcns traps
fcs Enable fcs traps
fcsp Enable fcsp traps
fctrace Enable fctrace traps
fdmi Enable fdmi traps
feature-control Enable feature-control traps
fspf Enable fspf traps
generic Enable generic traps
ipsec Enable ipsec traps
license Enable license traps
link Enable link traps
lldp Enable lldp traps
rf Enable rf traps
rmon Enable rmon traps
rscn Enable rscn traps
scsi Enable scsi traps
snmp Enable snmp traps
storm-control Enable storm-control traps
switchfabric Enable switchfabric traps
syslog Enable syslog traps
sysmgr Enable sysmgr traps
system Enable system traps
upgrade Enable upgrade traps
vni Enable vni traps
vrrp Enable vrrp traps
vsan Enable vsan traps
vtp Enable vtp traps
zone Enable zone traps
Hardware misconfigurations are automatically detected, and alerting is enabled by default. The notifications are sent using Syslog and SNMP traps or informs. For example, switches with the support of bidirectional airflow, a misconfiguration in the airflow direction is autodetected and a system message is generated, as shown below.
2018 Apr 11 18:22:39 MDS9000 Apr 11 18:22:39 %KERN-0-SYSTEM_MSG: [496944.553395] Airflow conflict is detected. Incompatible PSU/ Fan found. Switch will be shutdown if compatible PSU/ Fan is not installed. - kernel
Similar alerts are generated from other hardware components when a failure or misconfiguration is detected. No actions are required from a user.
High-availability (HA) monitoring
The HA state of MDS 9000 switches can be monitored via command # show system redundancy ha status. Please refer to the following snippet.
MDS9706-C# show system redundancy ha status
This supervisor Other supervisor
--------------- ---------------
Active with HA standby HA standby
MDS9706-C# show system redundancy status
Redundancy mode
---------------
administrative: HA
operational: HA
This supervisor (sup-3)
-----------------------
Redundancy state: Active
Supervisor state: Active
Internal state: Active with HA standby
Other supervisor (sup-4)
------------------------
Redundancy state: Standby
Supervisor state: HA standby
Internal state: HA standby
MDS9706-C#
The high-availability state of the MDS 9000 switches can also be monitored via CISCO-RF-MIB. For example, ciscoRFIssuStateNotif is generated to indicate a new state of the system. These state changes also generate system messages which can be sent to a remote agent via Syslog.
Email notifications can also be generated by MDS 9000 switches using Call Home or by DCNM event forwarding functionality.
Monitoring and alerting of SFPs on MDS 9000 switches are enabled by default. No action is required from a user. The alerting thresholds are pre-defined by the manufacturer based on the type of the SFP.
Use the # show interface transceiver details command to monitor the SFP.
MDS9718-A# show interface fc1/1 transceiver details
fc1/1 sfp is present
Name is CISCO-AVAGO
Manufacturer's part number is AFBR-57F5PZ-CS1
Revision is B2
Serial number is AVJ1827JW6U
Nominal bit rate is 14000 Mb/s
Link length supported for 50/125um OM2 fiber is 35 m
Link length supported for 62.5/125um fiber is 15 m
Link length supported for 50/125um OM3 fiber is 100 m
FC Transmitter type is short wave laser w/o OFC (SN)
FC Transmitter supports short distance link length
Transmission medium is multimode laser with 62.5 um aperture (M6)
Supported speeds are - Min speed: 4000 Mb/s, Max speed: 16000 Mb/s
Cisco extended id is unknown (0x0)
Cisco part number is 10-2666-01
Cisco pid is DS-SFP-FC16G-SW
No tx fault, no rx loss, in sync state, diagnostic monitoring type is 0x68
SFP Diagnostics Information:
----------------------------------------------------------------------------
Alarms Warnings
High Low High Low
----------------------------------------------------------------------------
Temperature 29.45 C 75.00 C -5.00 C 70.00 C 0.00 C
Voltage 3.33 V 3.63 V 2.97 V 3.46 V 3.13 V
Current 7.01 mA 10.50 mA 2.50 mA 10.50 mA 2.50 mA
Tx Power -2.16 dBm 1.70 dBm -13.00 dBm -1.30 dBm -9.00 dBm
Rx Power -3.49 dBm 3.00 dBm -15.90 dBm 0.00 dBm -11.90 dBm
Transmit Fault Count = 0
----------------------------------------------------------------------------
Note: ++ high-alarm; + high-warning; -- low-alarm; - low-warning
MDS9718-A#
SFPs are monitored for:
· Temperature (Celsius)
· Voltage (Volts)
· Current ((milli)Ampere)
· Tx Power (dBm)
· Rx Power (dBm)
· Transmit Fault (count)
The preceding command output also displays the alarm and warning ranges. The monitoring of the SFPs is enabled by default and alerts are generated when thresholds are exceeded. This event results in system messages (which can be sent to a remote agent via Syslog) and SNMP traps and informs.
This alert is also sent to DCNM and is accessible by navigating to Monitor > Switch > Events.
|
|
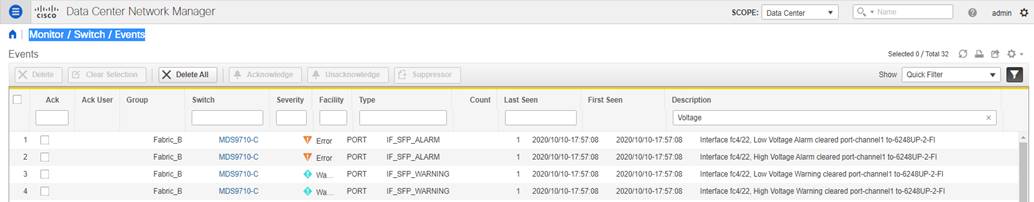
Viewing events in DCNM
The SFP parameters can be polled from the switches using SNMP (CISCO-ENTITY-SENSOR-MIB). Use this option to continuously monitor the SFP parameters for a long-term trending and seasonality.
The SNMP traps and informs for SFP alarm and warning notifications are sent via CISCO-INTERFACE-XCVR-MONITOR-MIB. The object is cIfXcvrMonStatusChangeNotif with following components:
· ifName
· cIfXcvrMonDigitalDiagTempAlarm
· cIfXcvrMonDigitalDiagTempWarning
· cIfXcvrMonDigitalDiagVoltAlarm
· cIfXcvrMonDigitalDiagVoltWarning
· cIfXcvrMonDigitalDiagCurrAlarm
· cIfXcvrMonDigitalDiagCurrWarning
· cIfXcvrMonDigitalDiagRxPwrAlarm
· cIfXcvrMonDigitalDiagRxPwrWarning
· cIfXcvrMonDigitalDiagTxPwrAlarm
· cIfXcvrMonDigitalDiagTxPwrWarning
· cIfXcvrMonDigitalDiagTxFaultAlarm
For more details to translate OIDs into object names, their descriptions, browse OID trees, and to download the MIB files, please refer to the references section to access the Cisco SNMP Object Navigator.
following is a sample message when a low voltage warning is generated from SFP in port fc1/1.
%PORT-4-IF_SFP_WARNING: Interface fc1/1, Low Voltage Warning
Interface State and Performance monitoring and Alerting
Hardware sensors on the port-ASICs on the Cisco MDS 9000 switches continuously collect the metrics at low granularity in real time. This section provides details to display the metrics using the NX-OS CLI or export them to a remote agent or generate automated alerting.
The monitoring of interfaces on MDS 9000 switches is enabled by default. Alerting of only major events is enabled by default, for example, link-up and link-down events. More alerts must be explicitly enabled, for example, high link utilization and B2B credit unavailability.
The interface counters are available under # show interface <> counters, # show interface <> counters brief and # show interface <> counters detailed commands, as shown below.
MDS9718-A# show interface fc1/15
fc1/15 is trunking
Port description is to_MDS9706-C
Hardware is Fibre Channel, SFP is short wave laser w/o OFC (SN)
Port WWN is 20:0f:8c:60:4f:9e:2b:00
Peer port WWN is 20:0f:8c:60:4f:54:51:00
Admin port mode is auto, trunk mode is on
snmp link state traps are enabled
Port mode is TE
Port vsan is 1
Admin Speed is auto
Operating Speed is 32 Gbps
Rate mode is dedicated
Port flow-control is ER_RDY
Transmit B2B Credit for VL 0-3: 15, 15, 40, 430
Receive B2B Credit for VL 0-3: 15, 15, 40, 430
B2B State Change: Admin(on), Oper(up), Negotiated Value(14)
Receive data field Size is 2112
Beacon is turned off
fec is enabled by default
Logical type is core
Belongs to port-channel2
Trunk vsans (admin allowed and active) (1,20)
Trunk vsans (up) (1,20)
Trunk vsans (isolated) ()
Trunk vsans (initializing) ()
5 minutes input rate 1446253536 bits/sec,180781692 bytes/sec, 135982 frames/sec
5 minutes output rate 2023045760 bits/sec,252880720 bytes/sec, 194685 frames/sec
1207557063868 frames input,1613205257783384 bytes
0 discards,0 errors
0 invalid CRC/FCS,0 unknown class
0 too long,0 too short
1727972173378 frames output,2257782335763584 bytes
0 discards,0 errors
7 input OLS,5 LRR,4 NOS,0 loop inits
6 output OLS,10 LRR, 3 NOS, 0 loop inits
Transmit B2B credit remaining for VL 0-3: 15, 15, 40, 429
Receive B2B credit remaining for VL 0-3: 15, 15, 40, 430
Last clearing of "show interface" counters: never
MDS9718-A#
MDS9718-A# show interface fc1/15 counters brief
-------------------------------------------------------------------------------
Interface Input (rate is 5 min avg) Output (rate is 5 min avg)
----------------------------- -----------------------------
Rate Total Rate Total
MB/s Frames MB/s Frames
-------------------------------------------------------------------------------
fc1/15 181 1207557888405 258 1727973322943
MDS9718-A#
MDS9718-A# show interface fc1/15 counters detailed
fc1/15
Rx 5 min rate bit/sec: 1455865440
Tx 5 min rate bit/sec: 2036661120
Rx 5 min rate bytes/sec: 181983180
Tx 5 min rate bytes/sec: 254582640
Rx 5 min rate frames/sec: 136454
Tx 5 min rate frames/sec: 195363
Total Stats:
Rx total frames: 1207559175743
Tx total frames: 1727975142493
Rx total bytes: 1613208106752576
Tx total bytes: 2257786210241096
Rx total multicast: 0
Tx total multicast: 0
Rx total broadcast: 0
Tx total broadcast: 0
Rx total unicast: 1207559175627
Tx total unicast: 1727975142384
Rx total discards: 0
Tx total discards: 0
Rx total errors: 0
Tx total errors: 0
Rx class-2 frames: 0
Tx class-2 frames: 0
Rx class-2 bytes: 0
Tx class-2 bytes: 0
Rx class-2 frames discards: 0
Rx class-2 port reject frames: 0
Rx class-3 frames: 1207546927035
Tx class-3 frames: 1727965551223
Rx class-3 bytes: 1613207164103092
Tx class-3 bytes: 2257785595672952
Rx class-3 frames discards: 0
Rx class-f frames: 12248475
Tx class-f frames: 9591012
Rx class-f bytes: 942649484
Tx class-f bytes: 614568144
Rx class-f frames discards: 0
Link Stats:
Rx Link failures: 3
Rx Sync losses: 0
Rx Signal losses: 0
Rx Primitive sequence protocol errors: 0
Rx Invalid transmission words: 0
Rx Invalid CRCs: 0
Rx Delimiter errors: 0
Rx fragmented frames: 0
Rx frames with EOF aborts: 0
Rx unknown class frames: 0
Rx Runt frames: 0
Rx Jabber frames: 0
Rx too long: 0
Rx too short: 0
Rx FEC corrected blocks: 0
Rx FEC uncorrected blocks: 0
Rx Link Reset(LR) while link is active: 9
Tx Link Reset(LR) while link is active: 1
Rx Link Reset Responses(LRR): 5
Tx Link Reset Responses(LRR): 10
Rx Offline Sequences(OLS): 7
Tx Offline Sequences(OLS): 6
Rx Non-Operational Sequences(NOS): 4
Tx Non-Operational Sequences(NOS): 3
Congestion Stats:
Tx Timeout discards: 0
Tx Credit loss: 0
BB_SCs credit resend actions: 0
BB_SCr Tx credit increment actions: 0
TxWait 2.5us due to lack of transmit credits for VL 0: 0
TxWait 2.5us due to lack of transmit credits for VL 1: 0
TxWait 2.5us due to lack of transmit credits for VL 2: 0
TxWait 2.5us due to lack of transmit credits for VL 3: 0
Percentage TxWait not available for last 1s/1m/1h/72h: 0%/0%/0%/0%
Rx B2B credit remaining for VL 0: 15
Rx B2B credit remaining for VL 1: 15
Rx B2B credit remaining for VL 2: 40
Rx B2B credit remaining for VL 3: 430
Tx B2B credit remaining for VL 0: 15
Tx B2B credit remaining for VL 1: 15
Tx B2B credit remaining for VL 2: 40
Tx B2B credit remaining for VL 3: 430
Rx B2B credit transitions to zero for VL 0: 10
Rx B2B credit transitions to zero for VL 1: 4
Rx B2B credit transitions to zero for VL 2: 4
Rx B2B credit transitions to zero for VL 3: 210513
Tx B2B credit transitions to zero for VL 0: 11
Tx B2B credit transitions to zero for VL 1: 5
Tx B2B credit transitions to zero for VL 2: 5
Tx B2B credit transitions to zero for VL 3: 5
Other Stats:
Zone drops: 0
FIB drops for ports 1-16: 20
XBAR errors for ports 1-16: 0
Other drop count: 0
Last clearing of "show interface" counters : never
MDS9718-A#
DCNM starts monitoring interface utilization after enabling SAN Collections under the Performance setup. Switch port utilization graphs are accessible by navigating to Monitor > SAN > FC Ports > Performance tab.
|
|
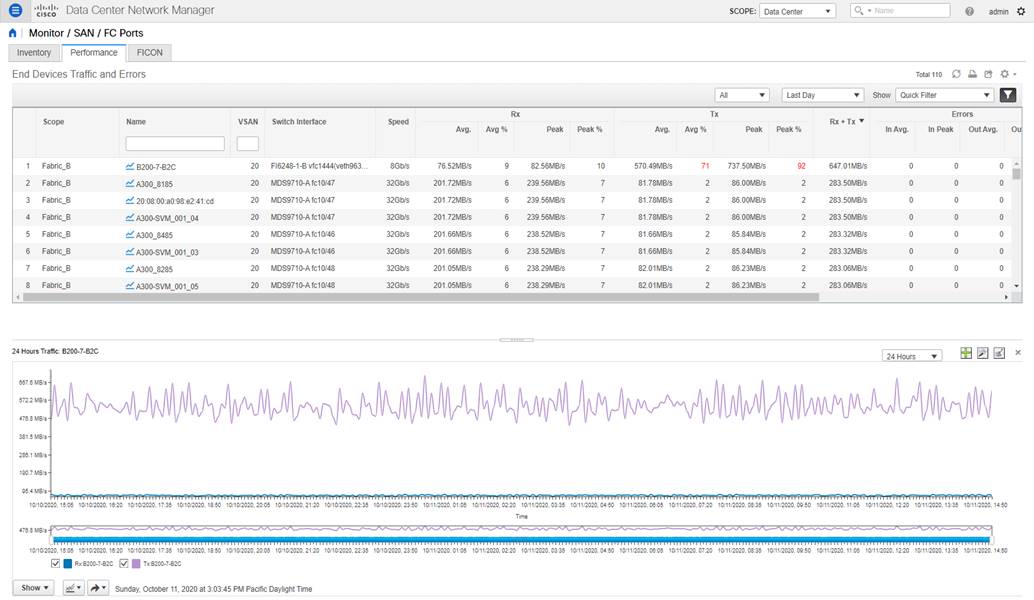
Monitoring performance of switch interfaces in DCNM
The interface metrics can be exported to a third-party application using SNMP, NX-API, or streaming telemetry.
For more details on NX-API, please refer to the references section to access the Cisco MDS 9000 Series Programmability Guide.
For more details on streaming telemetry, please refer to the references section to access the Cisco MDS 9000 Series SAN Analytics and SAN Telemetry Streaming Configuration Guide.
IF-MIB is a commonly used MIB to monitor interface metrics. Also, table 3 provides a list of commonly used SNMB MIB objects for monitoring the interfaces on MDS 9000 switches.
| S.No |
MIB name |
OID |
Description |
| 1 |
ifHCInOctets |
1.3.6.1.2.1.31.1.1.1.6 |
Number of bytes received by the interface |
| 2 |
ifHCOutOctets |
1.3.6.1.2.1.31.1.1.1.10 |
Number of bytes transmitted by the interface |
| 3 |
fcIfTxWaitCount |
1.3.6.1.4.1.9.9.289.1.2.1.1.15 |
TxWait, the number of 2.5µs when a switch port could not transmit due to 0 Tx B2B credits |
| 4 |
fcHCIfBBCreditTransistionFromZero |
1.3.6.1.4.1.9.9.289.1.2.1.1.40 |
Tx B2B credit transition to zero |
| 5 |
fcIfBBCreditTransistionToZero |
1.3.6.1.4.1.9.9.289.1.2.1.1.40 |
Rx B2B credit transition to zero |
| 6 |
fcIfTxWtAvgBBCreditTransitionToZero |
1.3.6.1.4.1.9.9.289.1.2.1.1.38 |
Number of 100ms when a switchport could not transmit due to 0 Tx B2B credits |
| 7 |
fcIfCreditLoss |
1.3.6.1.4.1.9.9.289.1.2.1.1.37 |
Credit Loss (recovery) - Represents extended period (1 or 1.5 seconds) of 0 Tx B2B credits |
| 8 |
fcIfTimeOutDiscards |
1.3.6.1.4.1.9.9.289.1.2.1.1.35 |
Timeout discards |
| 9 |
fcIfOutDiscard |
1.3.6.1.4.1.9.9.289.1.2.1.1.36 |
Total number of frames discarded in egress direction, which includes timeout discards |
| 10 |
fcIfLinkResetIns |
1.3.6.1.4.1.9.9.289.1.2.1.1.9 |
Number of link reset protocol errors that are received by an FC port from the attached FC port |
| 11 |
fcIfLinkResetOuts |
1.3.6.1.4.1.9.9.289.1.2.1.1.10 |
Number of link reset protocol errors issued by the FC port to the attached FC port. |
| 12 |
fcIfSlowportCount |
1.3.6.1.4.1.9.9.289.1.2.1.1.44 |
Duration for which Tx B2B credits were unavailable on a port |
| 13 |
fcIfSlowportOperDelay |
1.3.6.1.4.1.9.9.289.1.2.1.1.45 |
Number of times for which Tx B2B credits were unavailable on a port for a duration longer than the configured admin-delay value in slowport-monitor |
| 14 |
fcIfInvalidCrcs |
1.3.6.1.4.1.9.9.289.1.2.1.1.6 |
Number of invalid CRC packets detected by an FC port |
For more details, please refer to the references section to access the Cisco MDS 9000 Family MIB Quick Reference and Monitoring and Alerting in Cisco MDS Fabric white paper.
Alerting on interface metrics using port-monitor (PMON)
The port-monitor (PMON) feature on MDS 9000 switches proactively monitors the ports on an MDS 9000 switch and automatically generates alerts when the metrics exceed the configured thresholds. The port metrics are monitored in real time at a low granularity (as low as 2.5 microseconds). When PMON generates an event, the notification is sent using Syslog and SNMP traps or informs.

Please refer to the references section to access the Sample MDS Port-Monitor Policies. A sample port-monitor policy for core and edge ports is shown below.
!
port-monitor name CorePorts
logical-type core
counter link-loss poll-interval 60 delta rising-threshold 5 event 4 falling-threshold 0 event 4
counter sync-loss poll-interval 60 delta rising-threshold 5 event 4 falling-threshold 0 event 4
counter signal-loss poll-interval 60 delta rising-threshold 5 event 4 falling-threshold 0 event 4
counter invalid-words poll-interval 60 delta rising-threshold 1 event 4 falling-threshold 0 event 4
counter invalid-crc poll-interval 60 delta rising-threshold 5 event 4 falling-threshold 0 event 4
counter tx-discards poll-interval 60 delta rising-threshold 100 event 3 falling-threshold 10 event 3
counter lr-rx poll-interval 60 delta rising-threshold 5 event 2 falling-threshold 1 event 2
counter lr-tx poll-interval 60 delta rising-threshold 5 event 2 falling-threshold 1 event 2
counter timeout-discards poll-interval 60 delta rising-threshold 100 event 3 falling-threshold 10 event 3
counter credit-loss-reco poll-interval 60 delta rising-threshold 1 event 2 falling-threshold 0 event 2
counter tx-credit-not-available poll-interval 1 delta rising-threshold 10 event 4 falling-threshold 0 event 4
counter tx-datarate poll-interval 10 delta rising-threshold 80 event 4 falling-threshold 79 event 4
counter err-pkt-from-port poll-interval 60 delta rising-threshold 50 event 3 falling-threshold 0 event 3
counter err-pkt-to-xbar poll-interval 60 delta rising-threshold 50 event 3 falling-threshold 0 event 3
counter err-pkt-from-xbar poll-interval 60 delta rising-threshold 50 event 3 falling-threshold 0 event 3
counter tx-slowport-oper-delay poll-interval 1 absolute rising-threshold 80 event 4 falling-threshold 0 event 4
counter txwait poll-interval 1 delta rising-threshold 20 event 4 falling-threshold 0 event 4
monitor counter err-pkt-from-port
monitor counter err-pkt-to-xbar
monitor counter err-pkt-from-xbar
no monitor counter state-change
no monitor counter rx-datarate
!
port-monitor activate CorePorts
!
port-monitor name EdgePorts
logical-type edge
counter link-loss poll-interval 60 delta rising-threshold 5 event 4 falling-threshold 0 event 4
counter sync-loss poll-interval 60 delta rising-threshold 5 event 4 falling-threshold 0 event 4
counter signal-loss poll-interval 60 delta rising-threshold 5 event 4 falling-threshold 0 event 4
counter invalid-words poll-interval 60 delta rising-threshold 1 event 4 falling-threshold 0 event 4
counter invalid-crc poll-interval 60 delta rising-threshold 5 event 4 falling-threshold 0 event 4
counter tx-discards poll-interval 60 delta rising-threshold 50 event 3 falling-threshold 10 event 3
counter lr-rx poll-interval 60 delta rising-threshold 5 event 2 falling-threshold 1 event 2
counter lr-tx poll-interval 60 delta rising-threshold 5 event 2 falling-threshold 1 event 2
counter timeout-discards poll-interval 60 delta rising-threshold 50 event 3 falling-threshold 10 event 3
counter credit-loss-reco poll-interval 60 delta rising-threshold 4 event 2 falling-threshold 0 event 2
counter tx-credit-not-available poll-interval 1 delta rising-threshold 10 event 4 falling-threshold 0 event 4
counter tx-datarate poll-interval 10 delta rising-threshold 80 event 4 falling-threshold 79 event 4
counter tx-slowport-oper-delay poll-interval 1 absolute rising-threshold 50 event 4 falling-threshold 0 event 4
counter txwait poll-interval 1 delta rising-threshold 20 event 4 falling-threshold 0 event 4
no monitor counter err-pkt-from-port
no monitor counter err-pkt-to-xbar
no monitor counter err-pkt-from-xbar
no monitor counter state-change
no monitor counter rx-datarate
!
port-monitor activate EdgePorts
!
The preceding policy only triggers notifications. No port-guard actions are taken which can be configured for:
● Port flap
● Errodisable port (shutdown)
● Cong-isolated (Congestion Isolation)
Enabling a port-guard action can be configured after a few initial weeks of soaking the thresholds values. Also, there is no single set of thresholds that fit all scenarios. The preceding policy is a good start. The aim should be to make the thresholds more aggressive if notifications are not received. When notifications are received, the root cause of the problem should be found and fixed before making the thresholds more aggressive.

We recommend to configure higher severity for important counters. For example, the impact due to a Link Reset (lr-rx and lr-tx) event is more than a condition when a port does not have enough transmit B2B credits (txwait). Hence, the preceding sample policy configures lr-tx and lr-rx at severity level 2 and txwait to severity level 4.
Port-monitor can also be configured by DCNM for a consistent policy across multiple switches and fabrics. Navigate to Configure > SAN > Port Monitoring. Select one of the existing policy templates or create your own. The threshold values can be modified by clicking on the counter row. Finally, click the Push to switches button to configure the policy on one or multiple switches.
|
|
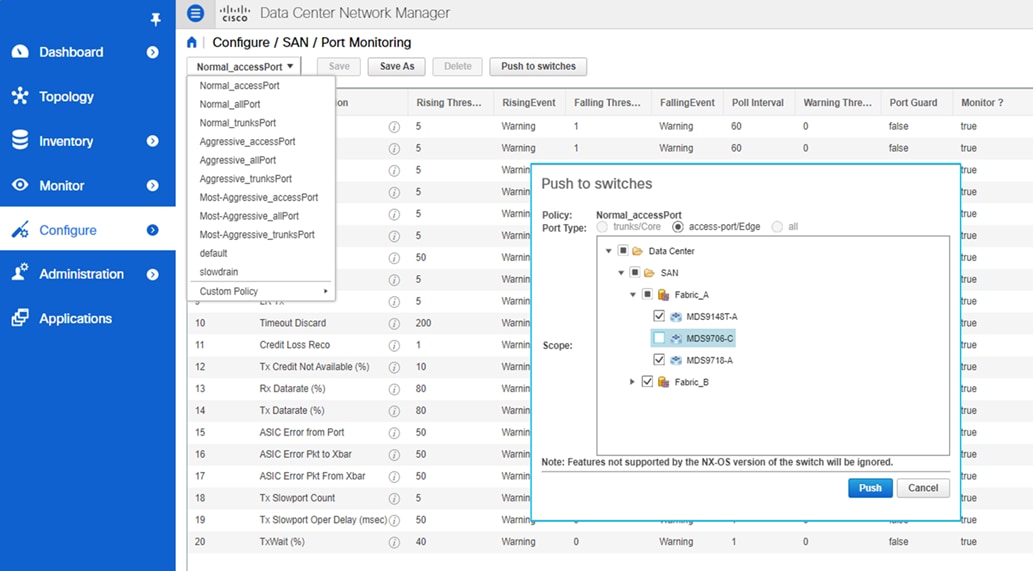
Configuring port-monitor from DCNM
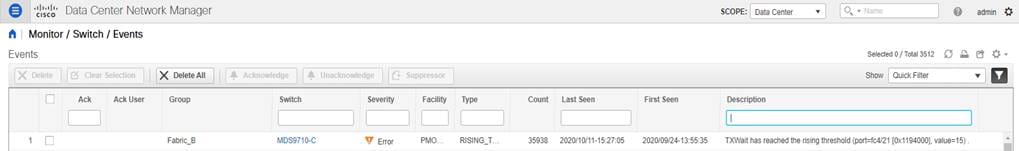
following is a sample message generated by the port-monitor feature.
2020 Oct 11 11:25:55 MDS9710-C %PMON-SLOT4-3-RISING_THRESHOLD_REACHED: TXWait has reached the rising threshold (port=fc4/26 [0x1199000], value=22) .
This alert is also sent to DCNM and is accessible by navigating to Monitor > Switch > Events.
|
|
Viewing port-monitor events in DCNM
Monitoring and Alerting of congestion and B2B credits
Cisco MDS 9000 switches and DCNM offer a strong feature-set to detect, troubleshoot, and automatically recover from SAN Congestion. An in-depth explanation of all the features is outside of the scope of this document. This section aims to help new users to quickly get started with monitoring and automated alerting for congestion in a SAN fabric built using MDS 9000 switches. For more details, please refer to the references section to access the Slow-Drain Device Detection, Troubleshooting, and Automatic Recovery white paper and Cisco MDS 9000 Series Interfaces Configuration Guide.
Monitoring of B2B credits and congestion is enabled by default on MDS 9000 switches. The metrics can be displayed by using #show interface <> counters detailed command, as shown in the following snippet.
MDS9718-A# show interface fc1/15 counters detailed
fc1/15
<snip>
Congestion Stats:
Tx Timeout discards: 0
Tx Credit loss: 0
BB_SCs credit resend actions: 0
BB_SCr Tx credit increment actions: 0
TxWait 2.5us due to lack of transmit credits for VL 0: 0
TxWait 2.5us due to lack of transmit credits for VL 1: 0
TxWait 2.5us due to lack of transmit credits for VL 2: 0
TxWait 2.5us due to lack of transmit credits for VL 3: 0
Percentage TxWait not available for last 1s/1m/1h/72h: 0%/0%/0%/0%
Rx B2B credit remaining for VL 0: 15
Rx B2B credit remaining for VL 1: 15
Rx B2B credit remaining for VL 2: 40
Rx B2B credit remaining for VL 3: 430
Tx B2B credit remaining for VL 0: 15
Tx B2B credit remaining for VL 1: 15
Tx B2B credit remaining for VL 2: 40
Tx B2B credit remaining for VL 3: 430
Rx B2B credit transitions to zero for VL 0: 10
Rx B2B credit transitions to zero for VL 1: 4
Rx B2B credit transitions to zero for VL 2: 4
Rx B2B credit transitions to zero for VL 3: 210513
Tx B2B credit transitions to zero for VL 0: 11
Tx B2B credit transitions to zero for VL 1: 5
Tx B2B credit transitions to zero for VL 2: 5
Tx B2B credit transitions to zero for VL 3: 5
<snip>
Last clearing of "show interface" counters : never
MDS9718-A#
The preceding command shows metrics in real time. A limited number of historic metrics and logs are stored in the persistent storage on the switch. This is called onboard failure logging (OBFL) and is accessible using #show logging onboard command. For example, please refer to the following snippet. The time at the execution of this command was 2020-10-14 11:22:52. The output displays that on Sat Apr 13 01:44:24 2019, interface fc1/3 was congested for 5% of the 20-seconds sampling period.
MDS9710-C# sh logging onboard txwait
---------------------------------
Module: 1 txwait count
---------------------------------
----------------------------
Module: 1 show clock
----------------------------
2020-10-14 11:22:52
---------------------------------
Module: 1 txwait
---------------------------------
Notes:
- Sampling period is 20 seconds
- Only txwait delta >= 100 ms are logged
---------------------------------------------------------------------------------
| Interface | Virtual Link | Delta TxWait Time | Congestion | Timestamp |
| | | 2.5us ticks | seconds | | |
---------------------------------------------------------------------------------
| fc1/3 | 441949 | 1 | 5% | Sat Apr 13 01:44:24 2019 |
The OBFL on MDS 9000 switches store extensive information.
For more details, please refer to the references section to access the Cisco MDS 9000 Series System Management Configuration Guide.
In addition to the congestion monitoring features enabled by default (for example, TxWait), Slowport monitor is an important feature to detect Tx B2B credit unavailability duration on the ports of MDS 9000 switches.

Slowport-monitor is not enabled by default. Enable it using # system timeout slowport-monitor command.
MDS9718-A# conf t
MDS9718-A(config)# system timeout slowport-monitor 1 logical-type core
MDS9718-A(config)# system timeout slowport-monitor 1 logical-type edge
MDS9718-A(config)# end
MDS9718-A#
DCNM Slow Drain Analytics provides a single-pane-of-glass visibility across the entire fabric. This feature is not enabled by default. Start the Slow Drain analysis in DCNM by navigating to Monitor > SAN > Slow Drain Analysis. Select a Fabric from the Scope drop-down. Select Daily from the Duration drop-down. Select the Other radio-button and increase the number of hours to 24. Click the green Start Collection button to start the Slow Drain Analysis.

Repeat the same process for all the monitored fabrics. It is possible to visualize the results while the collection is under progress by selecting the Fabric under Current Jobs and clicking on the Results button.
|
|
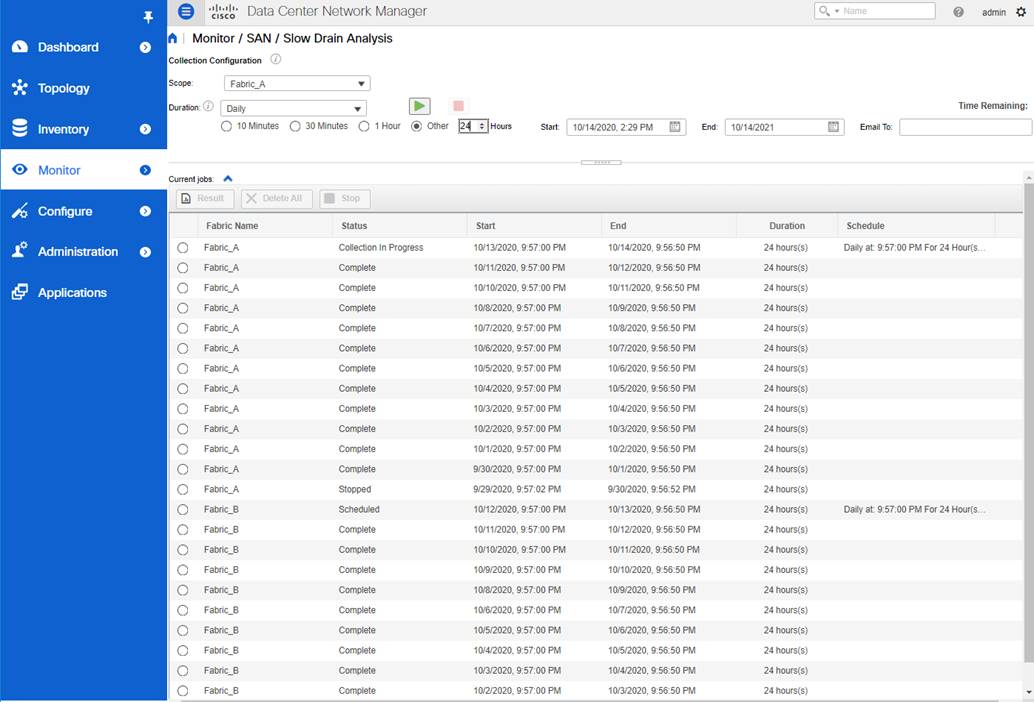
Slow Drain Analysis in DCNM
Metric export using SNMP, NX-API, or Streaming Telemetry
The Congestion metrics that are collected by MDS 9000 switches can be exported to remote agents using SNMP, NX-API, or streaming Telemetry.
Please refer to Table 3 for a list of import SNMP MIB objects for Congestion monitoring.
NX-API monitoring can be used to request the output of #show interface counter detail command which contains most of the congestion metrics.
Streaming telemetry can be used to export the interface counters which contain congestion metrics also.
Automatic alerting on SAN Congestion should be enabled using port-monitor. For more details and sample configuration, please refer to the section on Interface State and Performance monitoring and Alerting.

We recommend to use DCNM Drain Analysis for fabric-wide monitoring. Proactive and automated alerting should be enabled using the port-monitor feature on the MDS 9000 switches. Both the features serve different purpose and complement each other. When proactive notifications are received from PMON, historic trends and seasonality can be inspected using the DCNM slow drain analysis.
Fabric services monitoring and alerting
Cisco MDS 9000 switches have more inbuilt monitoring for FC/FCoE services like FCNS database, zoning, VSAN, and so on. The notifications can be sent using Syslog and SNMP traps or informs. Email notifications can also be generated by MDS 9000 switches using Call Home or by DCNM using the event forwarding.
Fibre Channel Name Server (FCNS)
FCNS service can be monitored using CISCO-NS-MIB. The two important components of this MIB are
· fcNameServerEntryAdd: Name Server sends this notification whenever a new entry is added to the Name Server database.
· fcNameServerEntryDelete: Name Server sends this notification whenever an existing entry is deleted from the Name Server database.
Not all the SNMP traps are enabled by default. If necessary, more traps can be enabled by using # snmp-server enable traps command.
Also, RMON based alerting can be enabled on the switches using the Threshold Manager in Device Manager. For more details and example, please refer to the section on Threshold-based alerting from common switch components.
VSAN service can be monitored using CISCO-VSAN-MIB, CISCO-VSAN-CAPABILITY, and CISCO-VLAN-MEMBERSHIP-MIB.
Like the FCNS traps, not all the SNMP traps are enabled by default. If necessary, more traps can be enabled by using #snmp-server enable traps command.
Also, RMON based alerting can be enabled on the switches using the Threshold Manager in Device Manager. For more details and example, please refer to the section on Threshold-based alerting from common switch components.
Zoning service can be monitored using CISCO-ZS-MIB and CISCO-ZS-EXT-MIB. Alerts are also generated using EEM. For example, __zone_members_max_per_sw system policy generates a system message which can be sent via Syslog when the number of zones exceeds the maximum limit per switch.
Like the FCNS traps, not all the SNMP traps are enabled by default. If necessary, more traps can be enabled by using #snmp-server enable traps command.
Also, RMON based alerting can be enabled on the switches using the Threshold Manager in Device Manager. For more details and example, please refer to the section on Threshold-based alerting from common switch components.
Following is a summary of the best practices discussed in this document:
1. We recommend using NTP to synchronize the clocks between the monitored SAN switches and the monitoring agent (DCNM) before setting up alerting and event notifications. It helps in having consistent timestamps on the events generated by the managed switches and as displayed by the monitored agent (DCNM).
2. We recommend using SHA-AES as authentication and privacy mode for DCNM to discover MDS 9000 SAN fabric and the connected UCS Fabric Interconnects.
3. For DCNM to discover and monitor UCS Fabric Interconnects, servers, and traffic, we recommend using different name strings for snmp-user and read-only user in UCS Manager. This approach helps in better troubleshooting if any issues are found later in the discovery process.
4. We recommend enabling sending of Syslog to DCNM. This functionality is not enabled by default and must be configured explicitly.
5. We recommended using DCNM Event Forwarding to generate email notifications from a managed Cisco SAN Fabr . DCNM event Forwarding acts as a single-source to send email-notifications using a rule-based filtering on a central repository of the logs and events.
6. In DCNM, we recommend modifying the default names of the fabrics to use custom and friendly names to better describe the fabrics.
7. In DCNM, we recommend creating custom and friendly names for switch-groups, hierarchy, and grouping the discovered fabrics accordingly. DCNM follows this hierarchy throughput the other screen. A Custom hierarchy helps in effective monitoring and faster troubleshooting.
8. We recommend limiting the number of agents monitoring the same MDS 9000 switches to less than 3. The monitoring agents can be Cisco DCNM or other third-party applications.
9. We recommend limiting the number of event notification destinations (SNMP trap or inform, Syslog, and so on.) from an MDS 9000 switch to less than 3. The destinations of the events can be Cisco DCNM or other third-party applications.
10. RMON threshold-based alerting is recommended to be configured using DCNM. Although the configuration is possible using NX-OS CLI, configuration from DCNM is easier and does not require knowing the exact SNMP OID.
11. We recommend configuring the port-monitor (PMON) feature on MDS 9000 switches to generate proactive and automatic event notifications based on the health of the switch ports, for example, high utilization, CRC, congestion, and so on.
12. In the port-monitor (PMON) policies, we recommend customizing the severity of events (using event-id) as per the severity of the monitored metric.
13. We recommended configuring the slowport-monitor feature for core and edge ports with admin delay of 1 millisecond. Enabling slowport-monitor can help to identify fabric level congestion. This functionality is not enabled by default and must be configured explicitly.
14. We recommend running DCNM Slow Drain Analysis for always-on monitoring to help identify where slow drain symptoms are occurring within the fabric. To achieve this, schedule DCNM Slow drain analysis to run daily for 24 hours. This functionality is not enabled by default and must be configured explicitly on DCNM.
15. We recommend using the Slow Drain Analysis on DCNM and port-monitor (PMON) on MDS 9000 switches. These features complement each other to help automatically identify fabric level congestion symptoms.
This document provides step-by-step guidance and best-practices to configure automated monitoring and alerting in a Cisco SAN fabric. The hardware and the software components on the MDS 9000 switches collect the metrics and the logs in real time. In addition to the health of a SAN fabric, Cisco SAN Analytics provides at-the-scale visibility into the end-to-end IO flows. The collected metrics and logs can be exported via SNMP, NX-API, Syslog, or streaming telemetry in an open format to a compatible third-party app or Cisco Data Center Network Manager (DCNM). The automated monitoring and alerting features available on MDS 9000 switches and DCNM help in achieving proactive operations, reduced downtimes, and improved SLAs.
More for information, please refer to
● Cisco DCNM Installation and Upgrade Guide for SAN Deployment
● Cisco MDS 9000 Series Programmability Guide
● Cisco MDS 9000 Series SAN Analytics and SAN Telemetry Streaming Configuration Guide
● Slow-Drain Device Detection, Troubleshooting, and Automatic Recovery white paper
● Cisco MDS 9000 Family MIB Quick Reference
● Monitoring and Alerting in Cisco MDS Fabric white paper
● Sample MDS Port-Monitor Policies
● Cisco DCNM REST API Reference Guide
● Cisco UCS Manager configuration guide
![]()