-
Cisco Unified CallManager Serviceability Administration Guide, Release 4.2(1)
-
Serviceability Administration Guide Book Length PDF
-
Preface
-
Introduction
-
Alarm Configuration
-
Alarm Definitions
-
Alarm Information
-
Trace Configuration
-
Trace Collection Configuration
-
Trace Analysis Configuration
-
Q.931 Translator
-
Troubleshooting Trace Setting Configuration
-
Service Activation
-
Control Center
-
Real-Time Monitoring Configuration
-
QRT Viewer
-
Serviceability Reports Archive Configuration
-
CDR Analysis and Reporting
-
CAR System Configuration
-
CAR Report Configuration
-
CAR User Reports Configuration
-
CAR System Reports Configuration
-
CAR Device Reports Configuration
-
CDR Search Configuration
-
Export CDR/CMR Records Configuration
-
Microsoft Performance
-
Bulk Trace Analysis
-
Overview of CiscoWorks2000
-
Path Analysis Configuration
-
System Log Management Configuration
-
Cisco Discovery Protocol Support Configuration
-
Cisco Secure Telnet Configuration
-
Show Command Line Interface
-
Simple Network Management Protocol Configuration
-
Understanding CAR Reports
-
Serviceability Administration Guide Index
-
 Feedback
Table Of Contents
Downloading Bulk Trace Analysis
Installing the Bulk Trace Analysis Program
Starting and Exiting the Program
Searching for Data in a Report
Creating a Report with Multiple Views
Customizing the Report Table Headings
Bulk Trace Analysis
The Cisco Bulk Trace Analysis tool, a plug-in software application provided in Serviceability, takes the input from one or multiple large (over 2MB) XML trace files and creates a report that you can use to analyze trace data.
This chapter contains the following topics:
•
Downloading Bulk Trace Analysis
•
Before You Begin
Bulk Trace Analysis uses an XML trace file as the input file. Use the Trace tools to generate the XML trace file. For information on XML trace files, see the following chapters:
•
•
•
Downloading Bulk Trace Analysis
You download the Bulk Trace Analysis tool from Serviceability and install it on a client PC.
This section describes how to download the Bulk Trace Analysis tool.
Procedure
Step 1
The Serviceability Install Plugins window displays.
Step 2
Step 3
Step 4
Step 5
Related Topics
•
Installing the Bulk Trace Analysis Program
Install the Bulk Trace Analysis program on a PC after the plugin has been downloaded from the Serviceability program.
This section describes how to install the Bulk Trace Analysis program on a client PC.
Procedure
Step 1
The installation wizard window displays.
Step 2
Step 3
The now installed program is ready to be used.
Related Topics
•
Using Bulk Trace Analysis
Bulk Trace Analysis takes one or multiple SDI or SDL XML trace files and creates reports that you can use to analyze the trace data. Bulk Trace Analysis supports the following report functionality:
•
•
•
•
Before You Begin
You must install the Bulk Trace Analysis program on a PC other than the Cisco CallManager publisher or subscriber system. See Downloading Bulk Trace Analysis and Installing the Bulk Trace Analysis Program.
Make sure the program is started and running on the PC. See Starting and Exiting the Program.
Starting and Exiting the Program
This section describes how to start and exit the Bulk Trace Analysis program.
Step 1
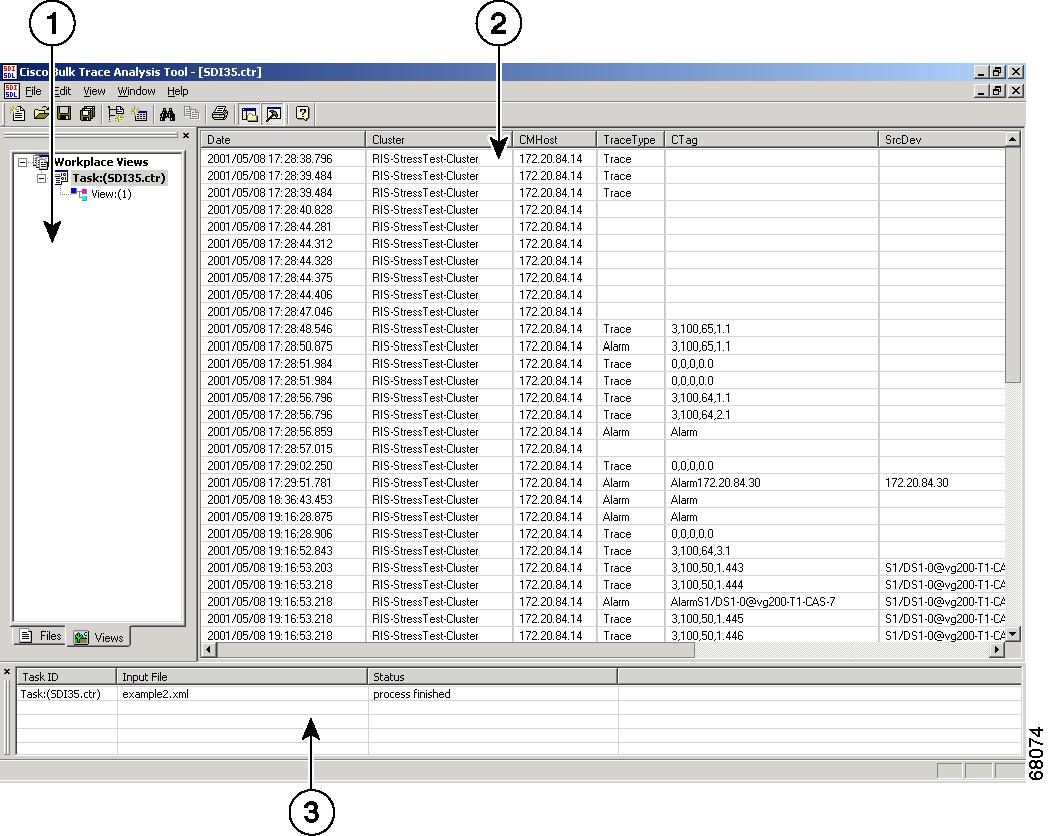
The Bulk Trace Analysis Tool window displays. See Figure 24-1.
Step 2
Step 3
Figure 24-1 Bulk Trace Analysis Window
Related Topics
•
•
•
Creating a Report
Bulk Trace Analysis creates reports using SDI or SDL XML trace files. You create a report using the following input trace files:
•
•
•
Caution
Procedure
This section describes how to create a report from a trace file.
Step 1
The New File dialog window displays.
Step 2
Step 3
The Open window displays.
Step 4
Step 5
The New File dialog window displays, and the file that you chose is entered in the Source File field. To choose multiple files, press the Control key while clicking on the file name.
Step 6
Step 7
Step 8
Step 9
The New File dialog window displays, and the file name that you chose is entered in the Save Report As field.
Step 10
The data from the source file displays in the Report Table pane, the report name appears in the Workplace Views pane, and the status of the report displays in the Task Control and Status pane. See Figure 24-1.
Step 11
Step 12
Related Topics
•
•
•
•
•
•
Opening a Report
This section describes how to open a report that is already created. See Creating a Report.
Procedure
Step 1
The Open dialog window displays.
Step 2
Step 3
The data from the source file displays in the Report Table pane, the report name appears in the Workplace Views pane, and the status of the report displays in the Task Control and Status pane.
Related Topics
•
•
•
•
•
•
Printing a Report
This section describes how to print a report.
Procedure
Step 1
Tip
Step 2
The Print dialog window displays.
Tip
Step 3
Related Topics
•
•
•
•
•
•
Saving the Master Report
This section describes how to save the master report. The master report designates the report without any filtering criteria.
Procedure
Step 1
Step 2
Related Topics
•
•
•
•
•
•
Searching for Data in a Report
This section describes how to search for data (information) in a report.
Procedure
Step 1
Step 2
The Find window displays.
Step 3
Step 4
Step 5
The highlighted match displays.
Step 6
Step 7
Related Topics
•
•
•
•
•
Creating a Report with Multiple Views
A view designates a report that contains specific information used for troubleshooting. A report can contain multiple views that allow you to examine the trace information from different perspectives.
Configuration of Bulk Trace Analysis filtering criteria is similar to configuration of filtering criteria in the Trace Analysis tool (see the "Trace Analysis Configuration" section on page 7-1). You can choose the type of information (such as host name, IP address, or correlation tag) to include in a trace analysis.
The results you receive from choosing correlation tag filtering provides more information than when you do not choose correlation tag filtering. Correlation tag filtering shows the relation between one trace to another trace. See the following examples.
Example Using Correlation Tag
In a trace file, a user checks the Use Correlation Tag check box and chooses a filter of IP Address=172.21.10.555 and Trace type=Alarm. Bulk Trace Analysis looks for all trace records with this IP address and trace type and collects all trace records that have a correlation tag associated with the trace records. The correlation tag gets applied to all the trace records found and gets filtered again. The trace filter finds the following records:
•
•
•
•
Because Use Correlation Tag is checked the view displays record 1, record 2, and record 3.
Example Without Correlation Tag
In a trace file, a user does not check the Use Correlation Tag check box. The user chooses a filter of IP Address=172.21.10.555 and Trace type=Alarm. Bulk Trace Analysis looks for all trace records with this IP address and trace type and collects all trace records that have a correlation tag associated with the trace records. The correlation tag gets applied to all the trace records found and gets filtered again. The trace filter finds the following records:
•
•
•
•
Because Use Correlation Tag is not checked the view only displays record 1.
This section describes how to make the report contain specific information by choosing filtering criteria and saving it as another view.
Procedure
Step 1
Step 2
The Filter window displays.
Step 3
Step 4
Step 5
Step 6
The view with the specified criteria displays in the Report Table pane with a new view name (for example, View 2) displayed under the Task name in the Workspace Views pane.
Tip
Related Topics
•
•
•
•
•
Displaying View Information
If you need to find out the filter information for a particular view, you can display the information. This section describes how to display the filter information for a view.
Procedure
Step 1
The filter information window displays.
Step 2
Step 3
Step 4
Related Topics
•
•
•
•
•
•
Customizing the Report Table Headings
To view specific columns of information in the report, you can remove the columns of information that you do not want to see.
This section describes how to customize the Report Table headings.
Procedure
Step 1
Step 2
The Customize columns window displays.
Step 3
Step 4
Step 5
Step 6
Step 7
Step 8
Step 9
The report with the new heading arrangement displays in the Report Table pane.
Related Topics
•
•
•
•
•