Monitor Network Parameters Using Telemetry Data for Proactive Analysis
The use case illustrates how, with the dial-in mode, you can use telemetry data to stream various parameters about your network. You use this data for predictive analysis where you monitor patterns, and proactively troubleshoot issues. This use case describes the tools used in the open-sourced collection stack to store and analyse telemetry data.
 Note |
Watch this video to see how you configure model-driven telemetry to take advantage of data models, open source collectors, encodings and integrate into monitoring tools. |
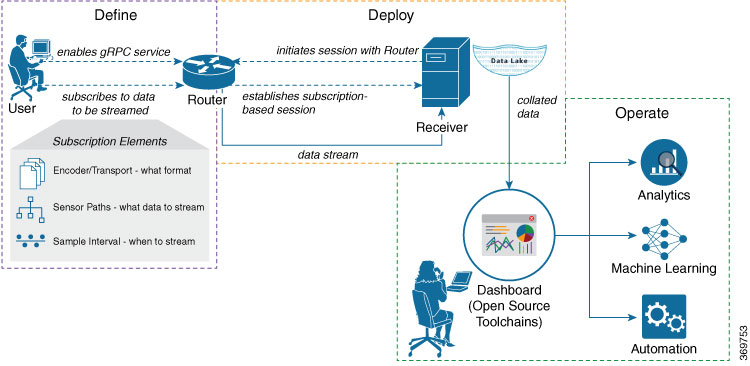
Telemetry involves the following workflow:
-
Define: You define a subscription to stream data from the router to the receiver. To define a subscription, you create a sensor-group.
-
Deploy: The receiver initiates a session with the router and establishes a subscription-based telemetry session. The router streams data to the receiver. You verify subscription deployment on the router.
-
Operate: You consume and analyse telemetry data using open-source tools, and take necessary actions based on the analysis.
Before you begin
-
Make sure you have L3 connectivity between the router and the receiver.
-
Enable gRPC server on the router to accept incoming connections from the receiver.
The port-number ranges from 57344 to 57999. If a port number is unavailable, an error is displayed.Router#configure Router(config)#grpc Router(config-grpc)#port <port-number> Router(config-grpc)#commit
Define a Subscription to Stream Data from Router to Receiver
Procedure
|
Step 1 |
Specify the subset of the data that you want to stream from the router using sensor paths. The sensor path represents the path in the hierarchy of a YANG data model. This example uses the native data model Example: |
||
|
Step 2 |
Subscribe to telemetry data that is streamed from a router. A subscription binds the sensor-group, and sets the streaming method. The streaming method can be cadence-driven or event-driven. Seperating the sensor-paths into different subscriptions enhances the efficiency of the router to retrieve operational data at scale. Example:
|
Verify Deployment of the Subscription
The receiver dials into the router to establish a dynamic session based on the subscription. After the session is established, the router streams data to the receiver to create a data lake.
You can verify the deployment of the subscription on the router.
Procedure
|
Verify the state of the subscription. An Example:The router streams data to the receiver using the subscription-based telemetry session and creates a data lake in the receiver. |
Operate on Telemetry Data for In-depth Analysis of the Network
You can start consuming and analyzing telemetry data from the data lake using an open-sourced collection stack. This use case uses the following tools from the collection stack:
-
Pipeline is a lightweight tool used to collect data. You can download Network Telemetry Pipeline from Github. You define how you want the collector to interact with routers, and where you want to send the processed data using
pipeline.conffile. -
Telegraph or InfluxDB is a time series database (TSDB) that stores telemetry data, which is retrieved by visualization tools. You can download InfluxDB from Github. You define what data you want to include into your TSDB using the
metrics.jsonfile. -
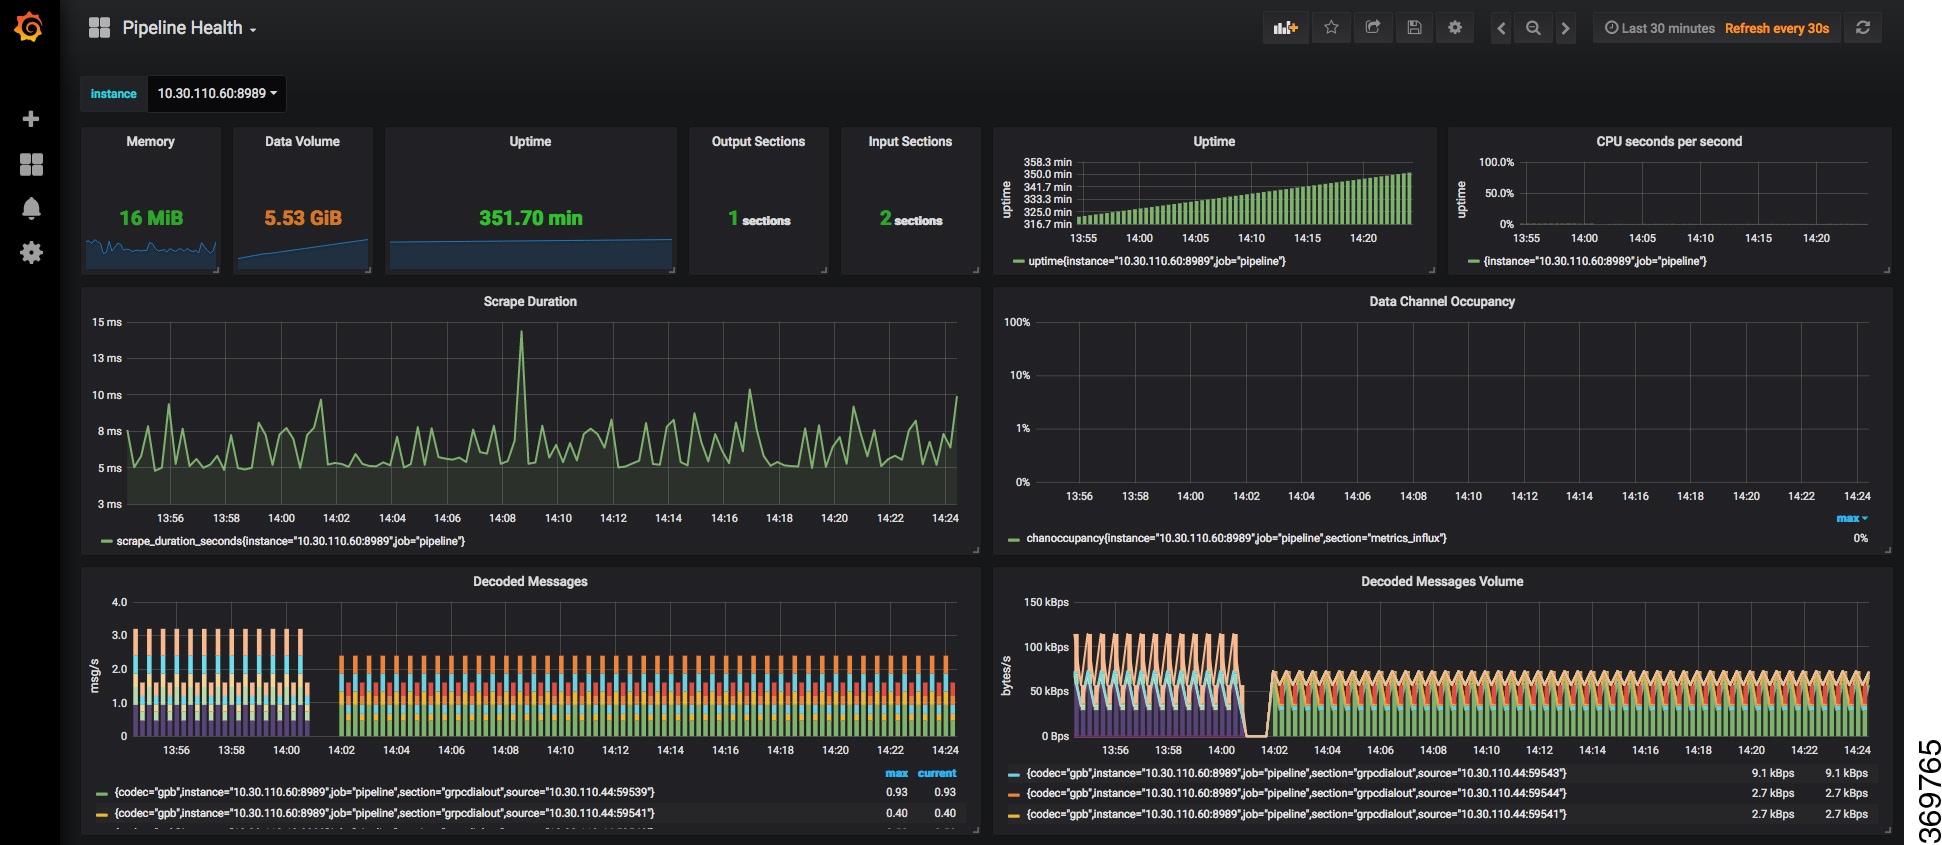
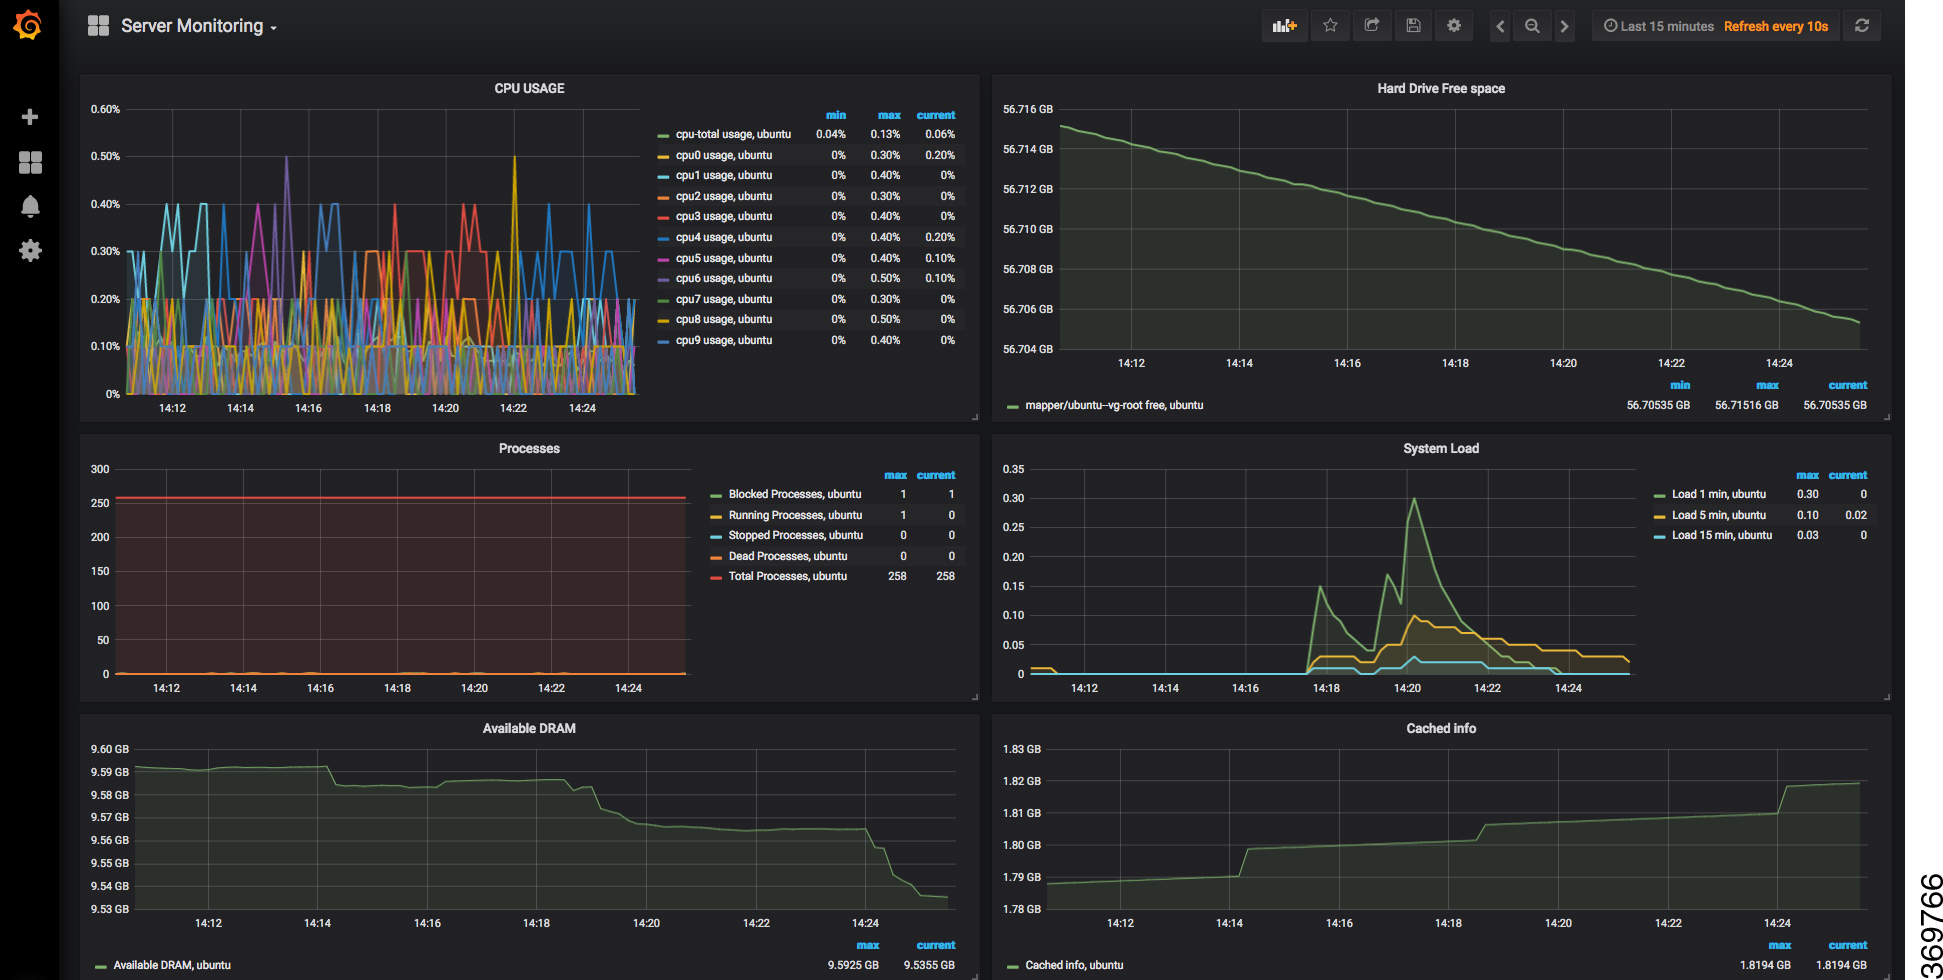
Grafana is a visualization tool that displays graphs and counters for data streamed from the router.
In summary, Pipeline accepts TCP and gRPC telemetry streams, converts data and pushes data to the InfluxDB database. Grafana uses the data from InfluxDB database to build dashboards and graphs. Pipeline and InfluxDB may run on the same server or on different servers.
Consider that the router is monitored for the following parameters:
-
Memory and CPU utilization
-
Interface counters and interface summary
-
Transmitter and receiver power levels from optic controllers
-
ISIS route counts and ISIS interfaces
-
BGP neighbours, path count, and prefix count
-
MPLS-TE tunnel summary
-
RSVP control messages and bandwidth allocation for each interface
Procedure
|
Step 1 |
Start Pipeline from the shell, and enter your router credentials. Example:The streamed telemetry data is stored in InfluxDB. |
|
Step 2 |
Use Grafana to create a dashboard and visualize the streamed data.   |

 Feedback