简介
本文档介绍如何测试围绕802.11ax的接入点的无线吞吐量以及期望的吞吐量。
先决条件
要求
本文档假设已使用802.11ax/Wi-Fi 6接入点(AP)进行正常运行的设置,从而提供客户端连接
使用的组件
本文档中的信息重点介绍802.11ax/Wi-Fi 6技术和速度。
本文档中的信息都是基于特定实验室环境中的设备编写的。本文档中使用的所有设备最初均采用原始(默认)配置。如果您的网络处于活动状态,请确保您了解所有命令的潜在影响。
了解协议演进
Wi-Fi 6可在多个频段上运行:2.4Ghz、5Ghz甚至6Ghz频段(根据Wi-Fi 6E认证)。
|
802.11ac(Wi-Fi 5)第2波 |
802.11ax(Wi-Fi 6/6E) |
| 通道宽度 |
20,40,80,80-80,160兆赫 |
20,40,80,80-80,160兆赫 |
| 最大空间流 |
8 |
8 |
| 最大调制 |
256-QAM(MCS9) |
1024-QAM(MCS11) |
| 最大理论数据速率 |
3.47Gbps(3个SS) — 6.9Gbps(8个SS) |
9.6 |
| 可实现的最大吞吐量(假设最高MCS数据速率的MAC效率为65%) |
1.5Gbps(3个空间流) |
1.5Gbps(2空间流客户端) |
802.11ac/Wi-Fi 5产生了两波浪潮。第二个波带来了160Mhz的信道支持,以及MU-MIMO和理论上的最多8个空间流。
这些数字只是标准中的理论数字,根据具体的AP数据表不同,这些数字会有所不同。
802.11ax/Wi-Fi 6并不直接在数据速率中定义,而是12个调制编码方案(MCS 0到MCS 11)、范围从20mhz(1个信道)到160Mhz(8个信道)的信道宽度和多个空间流的组合(通常为1到2,已经有大约3个空间流产品,但是它们越来越少)。
短、中或长保护间隔(GI)也增加了大约10%的修改。
以下表格用于在了解所有这些因素的情况下评估数据速率(以 Mbps 为单位):
|
空间流
|
VHT
MCS
索引
|
调制
|
编码率
|
20 MHz
数据速率 (Mb/s)
|
|
40 MHz
数据速率 (Mb/s)
|
|
80 MHz
数据速率 (Mb/s)
|
|
160 MHz / 80+80 MHz
数据传输速度
(Mb/s)
|
|
320兆赫
|
|
|
|
800ns GI
|
1600纳秒GI
|
3200ns GI
|
800ns GI
|
1600纳秒GI
|
3200ns GI
|
800ns GI
|
1600纳秒GI
|
3200ns GI
|
800ns GI
|
1600纳秒GI
|
3200ns GI
|
800ns GI
|
1600纳秒GI
|
3200ns GI
|
|
1
|
0
|
BPSK
|
1/2
|
8.6
|
8.1
|
7.3
|
17.2 |
16.3 |
14.6 |
36 |
34 |
30.6 |
72.1 |
68.1 |
61.3
|
144.1
|
136.1
|
122.5
|
|
1
|
QPSK
|
1/2
|
17.2 |
16.3 |
14.6 |
34.4 |
32.5 |
29.3 |
72.1 |
68.1 |
61.3 |
144.1 |
136.1 |
122.5
|
288.2
|
272.2
|
245
|
|
2
|
QPSK
|
3/4
|
25.8 |
24.4 |
21.9 |
51.6 |
48.8 |
43.9 |
108.1 |
102.1 |
91.9 |
216.2 |
204.2 |
183.8 |
432.4
|
408.3
|
367.5 |
|
3
|
16-QAM
|
1/2
|
34.4 |
32.5 |
29.3 |
68.8 |
65 |
58.5 |
144.1 |
136.1 |
122.5 |
288.2 |
272.2 |
245 |
576.5
|
544.4
|
490 |
|
4
|
16-QAM
|
3/4
|
51.6 |
48.8 |
43.9 |
103.2 |
97.5 |
87.8 |
216.2 |
204.2 |
183.8 |
432.4 |
408.3 |
367.5 |
864.7
|
816.7
|
735 |
|
5
|
64-QAM
|
2/3
|
68.8 |
65 |
58.5 |
137.6 |
130 |
117 |
288.2 |
272.2 |
245 |
576.5 |
544.4 |
490 |
1152.9
|
1088.9
|
980 |
|
6
|
64-QAM
|
3/4
|
77.4 |
73.1 |
65.8 |
154.9 |
146.3 |
131.6 |
324.3 |
306.3 |
275.6 |
648.5 |
612.5 |
551.3 |
1297.1
|
1225
|
1102.5 |
|
7
|
64-QAM
|
5/6
|
86 |
81.3 |
73.1 |
172.1 |
162.5 |
146.3 |
360.3 |
340.3 |
306.3 |
720.6 |
680.6 |
612.5 |
1441.2
|
1361.1
|
1225 |
|
8
|
256-QAM
|
3/4
|
103.2 |
97.5 |
87.8 |
206.5 |
195 |
175.5 |
432.4 |
408.3 |
367.5 |
864.7 |
816.7 |
735 |
1729.4
|
1633.3
|
1470 |
|
9
|
256-QAM
|
5/6
|
114.7 |
108.3 |
97.5 |
229.4 |
216.7 |
195 |
480.4 |
453.7 |
408.3 |
960.8 |
907.4 |
816.7 |
1921.6
|
1814.8
|
1633.3 |
|
10
|
1024-QAM
|
3/4
|
129 |
121.9 |
109.7 |
258.1 |
243.8 |
219.4 |
540.4 |
510.4 |
459.4 |
1080.9 |
1020.8 |
918.8 |
2161.8
|
2041.7
|
1837.5 |
|
11
|
1024-QAM
|
5/6
|
143.4 |
135.4 |
121.9 |
286.8 |
270.8 |
243.8 |
600.5 |
567.1 |
510.4 |
1201 |
1134.3 |
1020.8 |
2402
|
2268.5
|
2041.7 |
|
12
|
4096-QAM
|
3/4
|
154.9 |
146.3 |
131.6 |
309.7 |
295.5 |
263.3 |
648.5
|
612.5
|
551.3
|
1297.1
|
1225
|
1102
|
2594
|
2450
|
2205 |
|
13
|
4096-QAM
|
5/6
|
172.1 |
162.5 |
146.3 |
344.1 |
325 |
292.5 |
720.6
|
680.6
|
612.5
|
1441
|
1361
|
1225
|
2882
|
2722
|
2450 |
|
2
|
0
|
BPSK
|
1/2
|
7.2 |
16.3 |
14.6 |
34.4 |
32.5 |
29.3 |
72.1 |
68.1 |
61.3 |
144.1 |
136.1 |
122.5 |
288.2 |
272.2 |
245 |
|
1
|
QPSK
|
1/2
|
34.4 |
32.5 |
29.3 |
68.8 |
65 |
58.5 |
144.1 |
136.1 |
122.5 |
288.2 |
272.2 |
245 |
576.5 |
544.4 |
490 |
|
2
|
QPSK
|
3/4
|
51.6 |
48.8 |
43.9 |
103.2 |
97.5 |
87.8 |
216.2 |
204.2 |
183.8 |
432.4 |
408.3 |
367.5 |
864.7 |
816.7 |
735 |
|
3
|
16-QAM
|
1/2
|
68.8 |
65 |
58.5 |
137.6 |
130 |
117 |
288.2 |
272.2 |
245 |
576.5 |
544.4 |
490 |
1152.9 |
1088.9 |
980 |
|
4
|
16-QAM
|
3/4
|
103.2 |
97.5 |
87.8 |
206.5 |
195 |
175.5 |
432.4 |
408.3 |
367.5 |
864.7 |
816.7 |
735 |
1729.4 |
1633.3 |
1470 |
|
5
|
64-QAM
|
2/3
|
137.6 |
130 |
117 |
275.3 |
260 |
234 |
576.5 |
544.4 |
490 |
1152.9 |
1088.9 |
980 |
2305.9 |
2177.8 |
1960 |
|
6
|
64-QAM
|
3/4
|
154.9 |
146.3 |
131.6 |
309.7 |
292.5 |
263.3 |
648.5 |
612.5 |
551.3 |
1297.1 |
1225 |
1102.5 |
2594 |
2450 |
2205 |
|
7
|
64-QAM
|
5/6
|
172.1 |
162.5 |
146.3 |
344.1 |
325 |
292.5 |
720.6 |
680.6 |
612.5 |
1441.2 |
1361.1 |
1225 |
2882.4 |
2722.2 |
2450 |
|
8
|
256-QAM
|
3/4
|
206.5 |
195 |
175.5 |
412.9 |
390 |
351 |
864.7 |
816.7 |
735 |
1729.4 |
1633.3 |
1470 |
3458.8 |
3266.7 |
2940 |
|
9
|
256-QAM
|
5/6
|
229.4 |
216.7 |
195 |
458.8 |
433.3 |
390 |
960.8 |
907.4 |
816.7 |
1921.6 |
1814.8 |
1633.3 |
3843 |
3629.6 |
3266.7 |
|
10
|
1024-QAM
|
3/4
|
258.1 |
243.8 |
219.4 |
516.2 |
487.5 |
438.8 |
1080.9 |
1020.8 |
918.8 |
2161.8 |
2041.7 |
1837.5 |
4323.5 |
4083.3 |
3675 |
|
11
|
1024-QAM
|
5/6
|
286.8 |
270.8 |
243.8 |
573.5 |
541.7 |
487.5 |
1201 |
1134.3 |
1020.8 |
2402 |
2268.5 |
2041.7 |
4803.9 |
4537 |
4083.3 |
| |
12
|
4096-QAM
|
3/4
|
309.7 |
292.5 |
263.3 |
619.4 |
585 |
526.5 |
1297.1 |
1225 |
1102.5 |
2594.1 |
2450 |
2205 |
5188.2 |
4900 |
4410 |
| |
13
|
4096-QAM
|
5/6
|
344.1
|
325
|
292.5
|
688.2 |
650 |
585 |
1441.2 |
1361.1 |
1225 |
2882.4 |
2722.2 |
2450 |
5764.7 |
5444.4 |
4900 |
|
3
|
0
|
BPSK
|
1/2
|
25.8 |
24.4 |
21.9 |
51.6 |
48.8 |
43.9 |
108.1 |
102.1 |
91.9 |
216.2 |
204.2 |
183.8 |
432.4 |
408.3 |
367.5 |
|
1
|
QPSK
|
1/2
|
51.6 |
48.8 |
43.9 |
103.2 |
97.5 |
87.8 |
216.2 |
204.2 |
183.8 |
432.4 |
408.3 |
367.5 |
864.7 |
816.7 |
735 |
|
2
|
QPSK
|
3/4
|
77.4 |
73.1 |
65.8 |
154.9 |
146.3 |
131.6 |
324.3 |
306.3 |
275.6 |
648.5 |
612.5 |
551.3 |
1297.1 |
1225 |
1102.5 |
|
3
|
16-QAM
|
1/2
|
103.2 |
97.5 |
87.8 |
206.5 |
195 |
175.5 |
432.4 |
408.3 |
367.5 |
864.7 |
816.7 |
735 |
1729.4 |
1633.3 |
1470 |
|
4
|
16-QAM
|
3/4
|
154.9 |
146.3 |
131.6 |
309.7 |
292.5 |
263.3 |
648.5 |
612.5 |
551.3 |
1297.1 |
1225 |
1102.5 |
2594.1 |
2450 |
2205 |
|
5
|
64-QAM
|
2/3
|
206.5 |
195 |
175.5 |
412.9 |
390 |
351 |
864.7 |
816.7 |
735 |
1729.4 |
1633.3 |
1470 |
3458.8 |
3266.7 |
2940 |
|
6
|
64-QAM
|
3/4
|
232.3 |
219.4 |
197.4 |
464.6 |
438.8 |
394.9 |
972.8 |
918.8 |
826.9 |
1945.6 |
1837.5 |
1653.8 |
3891.2 |
3675 |
3307.5 |
|
7
|
64-QAM
|
5/6
|
258.1 |
243.8 |
219.4 |
516.2 |
487.5 |
438.8 |
1080.9 |
1020.8 |
918.8 |
2161.8 |
2041.7 |
1837.5 |
4323.5 |
4083.3 |
3675 |
|
8
|
256-QAM
|
3/4
|
309.7 |
292.5 |
263.3 |
619.4 |
585 |
526.5 |
1297.1 |
1225 |
1102.5 |
2594.1 |
2450 |
2205 |
5188.2 |
4900 |
4410 |
|
9
|
256-QAM
|
5/6
|
344.1 |
325 |
292.5 |
688.2 |
650 |
585 |
1441.2 |
1361.1 |
1225 |
2882.4 |
2722.2 |
2450 |
5764.7 |
5444.4 |
4900 |
|
10
|
1024-QAM
|
3/4
|
387.1 |
365.6 |
329.1 |
774.3 |
731.3 |
658.1 |
1621.3 |
1531.3 |
1378.1 |
3242.6 |
3062.5 |
2756.3 |
6485.3 |
6125 |
5512.5 |
|
11
|
1024-QAM
|
5/6
|
430.1 |
406.3 |
365.6 |
860.3 |
812.5 |
731.3 |
1801.5 |
1701.4 |
1531.3 |
3602.9 |
3402.8 |
3062.5 |
7205.9 |
6805 |
6125 |
有关更完整的表,请访问:https://mcsindex.com/
注意:数据速率不等于预期的可实现吞吐量。这与802.11标准的性质有关,该标准具有大量的管理开销(管理帧、争用、冲突、确认……),并且可能取决于链路SNR、RSSI和其他重要因素。
您可以使用以下用于802.11ax速度或数据速率的公式计算吞吐量:
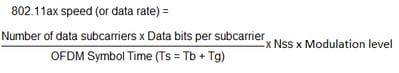
802.11ax速度或数据速率使用的等式
这是一条经验法则:
预期吞吐量 = 数据速率 x 0.7
以现实生活为例。Cisco 9120 AP,配备支持Wi-Fi 6的现代智能手机,支持2个空间流。如果我们处于使用20 Mhz通道的高密度环境中,则使用的最大数据速率介于240和280 Mbps之间,具体取决于保护间隔。这意味着,在清洁的环境和测试条件下,我们可以让一个客户端在160到200 Mbps之间传输数据(协议效率的65%到70%)。 这仅在执行实际的大传输或速度测试时有效,其中协议已针对最大数据吞吐量进行了优化。使用其他应用程序时,吞吐量会降低,因为延迟在协议中也会发挥作用,这些协议会执行数据包乒乓操作并等待确认,然后再继续执行。
另请注意,无线是共享环境,这意味着连接到AP的客户端数量在彼此之间共享有效吞吐量。如果执行速度测试的一个客户端可以达到160到200MBps,这意味着同时执行速度测试的两个客户端可以看到每个80到100Mbps。如果四个客户端同时执行速度测试,它们会看到40到50Mbps的速度,依此类推……
最重要的是,客户端越多,争用就越多,也不可避免地会有更多冲突。随着客户端数量的增加,覆盖信元的效率显着降低。因此,如果您不控制连接的客户端数量或它们在网络中执行的活动,那么在这样的位置设置任何类型的SLA吞吐量是不现实的。
Wi-Fi 7
Wi-Fi 7带来许多协议改进,可改善观察到的吞吐量。然而,通过添加MCS 12和13数据速率(虽然需要非常接近接入点)以及添加320Mhz信道宽度(在企业环境中使用可能是不现实的,因为它将许多信道捆绑在一起),最大速度得以提高。 对于本文档中介绍的测试方法而言,它并没有太大的变化。
Multi-Link Operation(MLO)是Wi-Fi 7的另一项改进,Wi-Fi 7通常用于夸大潜在数据速率。在现实生活中,大多数客户端将使用MLO连接多个频段,但大多数情况下使用单个频段(以节省电池寿命)。 5和6GHz频段也难以同时使用,因为无线电对彼此造成的干扰。验证客户端的连接方式,以便预测其可以合理达到的速度。
衡量
一般而言,当您执行吞吐量测试时,我们可能有两个场景:
- AP 处于本地模式或 FlexConnect 中心交换下
逐一考虑这些情景:
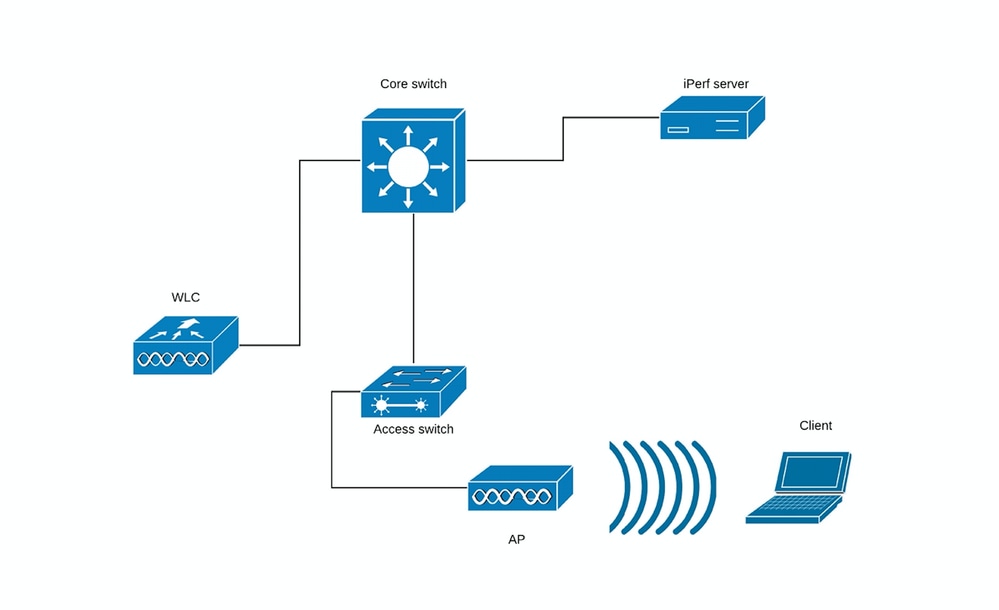
(图 1)
在图 1 的场景下,我们假设 AP 处于 FlexConnect 中心交换的本地模式下。
这意味着所有客户端流量均封装到 CAPWAP 隧道中,并在 WLC 上终止。

(图 2)
图 2 中的红线显示来自无线客户端的流量。
iPerf服务器必须尽可能接近流量终止点,最好插入与WLC本身相同的交换机并使用相同的VLAN。
如果使用Flexconnect本地交换,客户端流量在AP自身终止,并且考虑到iPerf服务器必须设置为接近无线客户端流量的终止点,将iPerf服务器插入到AP所插入的相同交换机和同一VLAN。
在本例中,这是接入交换机(图 3)。
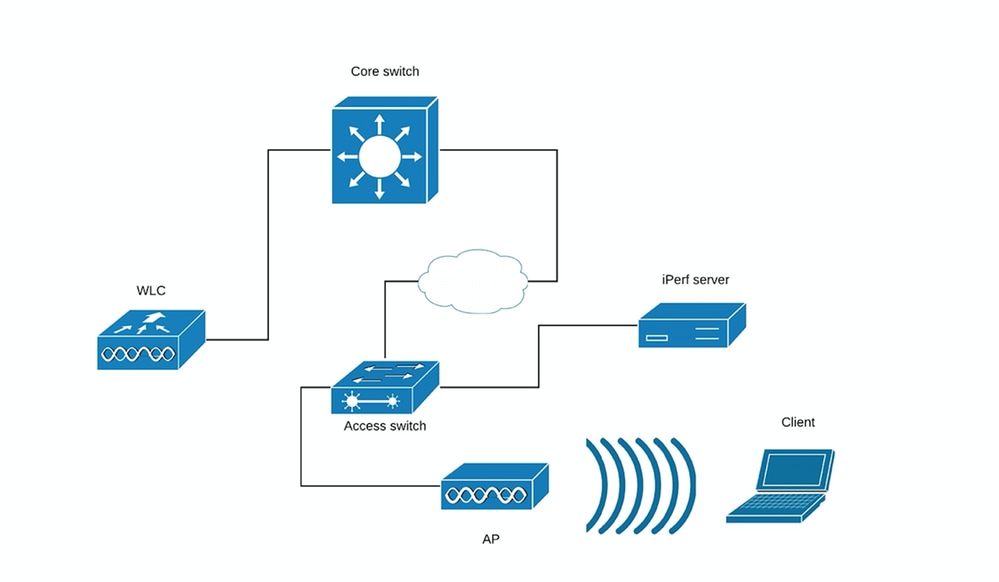
(图 3)
iPerf 测试可细分为两类: 上游测试和下游测试。
考虑到 iPerf 服务器正在侦听,而 iPerf 客户端正在生成流量,因此当 iPerf 服务器位于有线端时,该测试被视为上游测试。
无线客户端使用iPerf应用将流量推入网络。
下行测试反之亦然,这意味着iPerf服务器设置在无线客户端本身上,而iPerf客户端在有线端将流量推送到无线客户端,在此场景中,这被视为下行。
测试必须使用TCP和UDP完成。您可以使用以下命令执行测试:
iperf3 -s  <- this command starts iPerf server

iperf3 -c SERVER_ADDRESS -u -b700M <- this command initiates UDP iPerf test with bandwidth of 700 Mbps

iperf3 -c SERVER_ADDRESS <- this command initiates a simple TCP iPerf test

iperf3 -c SERVER_ADDRESS  -w WINDOW_SIZE  -P NUM_OF_PARALLEL_TCP_STREAMS <- this commands initiates a more complex  TCP iPerf test where you can adjust the window size as well the number of parallel TCP streams.
Please not that in this case you should consider the sum of all the streams as the result
iPerf3 输出示例:
TCP iPerf3:
[ ID] Interval           Transfer     Bandwidth
[  5]   0.00-10.06  sec  0.00 Bytes  0.00 bits/sec                  sender
[  5]   0.00-10.06  sec   188 MBytes   157 Mbits/sec                  receiver

[ ID] Interval           Transfer     Bandwidth
[  5]   0.00-10.05  sec  0.00 Bytes  0.00 bits/sec                  sender
[  5]   0.00-10.05  sec   304 MBytes   254 Mbits/sec                  receiver
   With 10 parallel TCP streams:
[ ID] Interval           Transfer     Bandwidth
[  5]   0.00-10.06  sec  0.00 Bytes  0.00 bits/sec                  sender
[  5]   0.00-10.06  sec  88.6 MBytes  73.9 Mbits/sec                  receiver
[  7]   0.00-10.06  sec  0.00 Bytes  0.00 bits/sec                  sender
[  7]   0.00-10.06  sec  79.2 MBytes  66.0 Mbits/sec                  receiver
[  9]   0.00-10.06  sec  0.00 Bytes  0.00 bits/sec                  sender
[  9]   0.00-10.06  sec  33.6 MBytes  28.0 Mbits/sec                  receiver
[ 11]   0.00-10.06  sec  0.00 Bytes  0.00 bits/sec                  sender
[ 11]   0.00-10.06  sec  48.7 MBytes  40.6 Mbits/sec                  receiver
[ 13]   0.00-10.06  sec  0.00 Bytes  0.00 bits/sec                  sender
[ 13]   0.00-10.06  sec  77.0 MBytes  64.2 Mbits/sec                  receiver
[ 15]   0.00-10.06  sec  0.00 Bytes  0.00 bits/sec                  sender
[ 15]   0.00-10.06  sec  61.8 MBytes  51.5 Mbits/sec                  receiver
[ 17]   0.00-10.06  sec  0.00 Bytes  0.00 bits/sec                  sender
[ 17]   0.00-10.06  sec  46.1 MBytes  38.4 Mbits/sec                  receiver
[ 19]   0.00-10.06  sec  0.00 Bytes  0.00 bits/sec                  sender
[ 19]   0.00-10.06  sec  43.9 MBytes  36.6 Mbits/sec                  receiver
[ 21]   0.00-10.06  sec  0.00 Bytes  0.00 bits/sec                  sender
[ 21]   0.00-10.06  sec  33.3 MBytes  27.8 Mbits/sec                  receiver
[ 23]   0.00-10.06  sec  0.00 Bytes  0.00 bits/sec                  sender
[ 23]   0.00-10.06  sec  88.8 MBytes  74.0 Mbits/sec                  receiver
[SUM]   0.00-10.06  sec  0.00 Bytes  0.00 bits/sec                  sender
[SUM]   0.00-10.06  sec   601 MBytes   501 Mbits/sec                  receiver
UDP iPerf3:
使用UDP时,必须确保数据包不会丢失。可能会看到非常高的吞吐量数字,但如果您有50%的数据包丢失,则实际上并未传输该数量的数据。
有时,iPerf 会出现行为异常,并且在 UDP 测试结束时不会提供平均带宽。
仍然可以汇总每秒的带宽,然后将其除以秒数:
Accepted connection from 192.168.240.38, port 49264
[  5] local 192.168.240.43 port 5201 connected to 192.168.240.38 port 51711
[ ID] Interval           Transfer     Bandwidth       Jitter    Lost/Total Datagrams
[  5]   0.00-1.00   sec  53.3 MBytes   447 Mbits/sec  0.113 ms  32/6840 (0.47%)
[  5]   1.00-2.00   sec  63.5 MBytes   533 Mbits/sec  0.129 ms  29/8161 (0.36%)
[  5]   2.00-3.00   sec  69.8 MBytes   586 Mbits/sec  0.067 ms  30/8968 (0.33%)
[  5]   3.00-4.00   sec  68.7 MBytes   577 Mbits/sec  0.071 ms  29/8827 (0.33%)
[  5]   4.00-5.00   sec  68.0 MBytes   571 Mbits/sec  0.086 ms  55/8736 (0.63%)
[  5]   5.00-6.00   sec  68.6 MBytes   576 Mbits/sec  0.076 ms  70/8854 (0.79%)
[  5]   6.00-7.00   sec  66.8 MBytes   561 Mbits/sec  0.073 ms  34/8587 (0.4%)
[  5]   7.00-8.00   sec  67.1 MBytes   563 Mbits/sec  0.105 ms  44/8634 (0.51%)
[  5]   8.00-9.00   sec  66.7 MBytes   559 Mbits/sec  0.183 ms  144/8603 (1.7%)
[  5]   9.00-10.00  sec  64.1 MBytes   536 Mbits/sec  0.472 ms  314/8415 (3.7%)
[  5]  10.00-10.05  sec   488 KBytes  76.0 Mbits/sec  0.655 ms  2/63 (3.2%)
- - - - - - - - - - - - - - - - - - - - - - - - -
[ ID] Interval           Transfer     Bandwidth       Jitter    Lost/Total Datagrams
[  5]   0.00-10.05  sec  0.00 Bytes  0.00 bits/sec  0.655 ms  783/84688 (0.92%)
[SUM]  0.0-10.1 sec  224 datagrams received out-of-order
注:与中心交换方案相比,Flexconnect本地交换的iPerf结果预计略好一些。
这是由于客户端流量被封装到 CAPWAP 中所致,这会增加流量的开销,而且通常 WLC 会成为瓶颈,因为它是所有无线客户端流量的汇聚点。
此外,预计UDP iPerf测试在干净环境中会提供更好的结果,因为它是连接可靠时最有效的传输方法。但是,TCP可以在严重分段(使用TCP Adjust MSS时)或不可靠连接时获胜
.
确认和验证
第一步是验证当前客户端配置。在Windows 11上,导航到Settings > Network & internet > Wi-Fi > Your_SSID_Name:
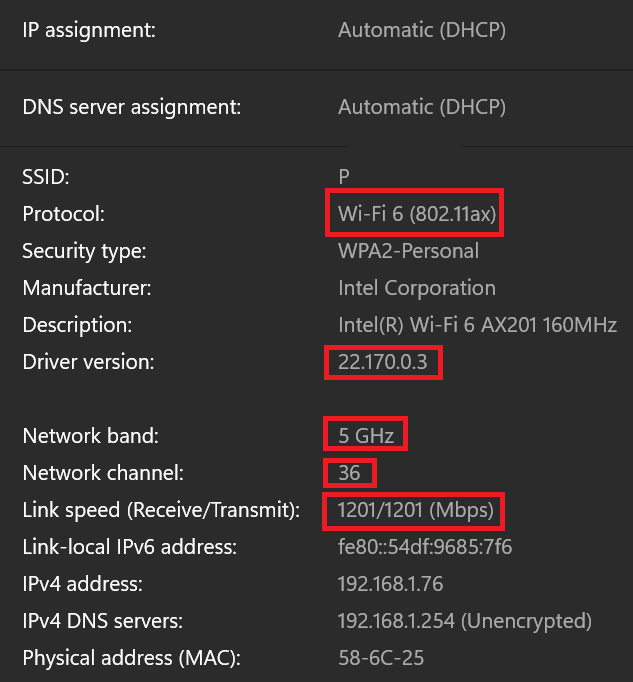 客户端上的Wi-Fi设置
您可以看到如何分配IP地址(本例中通过动态主机配置协议(DHCP)进程)、使用的协议、驱动程序版本、网络频带和信道以及链路速度。链路速度是客户端和AP之间的最大理论速度,这意味着实际速度可能较慢。

警告:验证您的驱动程序版本是否处于最新版本。未更新的驱动程序可能会影响网络性能/速度。
如果您没有达到预期速度,则可能是因为您的客户端没有连接到6GHz频段,并且只与其它频段保持连接。尽管有Wi-Fi 6E适配器,但有些笔记本电脑需要BIOS更新才能启用6Ghz功能。这还取决于测试所在的国家:某些基础设施AP在某些国家/地区禁用6GHz,在这些国家/地区尚不允许使用,而某些客户端笔记本电脑则经过硬编码后在特定国家/地区不使用6GHz。检查您的AP和客户端固件,了解与您进行测试的特定国家/地区的详细信息。
要检查客户端连接的数据速率,请在WLC CLI中发出以下命令:
WLC#show wireless client mac-address 72e6.81a1.XXXX detail
(...)
Current Rate..................................... m11 ss2 -> MCS 11 (m11) index on 2 spatial streams (ss2)
(...)
Radio Signal Strength Indicator............ -46 dBm
      Signal to Noise Ratio...................... 49 dB
您可以看到此特定客户端按以下速率连接:
当前速率……....................... m10 ss2
这意味着客户端在2个空间流(ss2)上使用MCS 10(m10)索引
通过“show wireless client mac <MAC> det”命令,无法查看客户端是否连接在20/40/80 MHz信道绑定上。
此操作可以直接在 AP 上完成:
9164示例:
#show controllers dot11Radio 2 client E8:8D:A6:B0:3B:CA
              mac radio vap aid state       encr  Maxrate Assoc   Cap is_wgb_wired      wgb_mac_addr
E8:8D:A6:B0:3B:CA     2   0  33   FWD AES_CCM128 MCS112SS HE-6E HE-6E        false 00:00:00:00:00:00
Configured rates for client E8:8D:A6:B0:3B:CA
Legacy Rates(Mbps): 6 9 12 18 24 36 48 54
HE Rates: 1SS:M0-11 2SS:M0-11
HT:yes     VHT:no     HE:yes     40MHz:no     80MHz:yes     80+80MHz:no     160MHz:yes
11w:yes     MFP:no     11h:no     session_timeout: 79950     encrypt_policy: 4
_wmm_enabled:yes     qos_capable:yes     WME(11e):no     WMM_MIXED_MODE:no
short_preamble:no     short_slot_time:no     short_hdr:no     SM_dyn:no
short_GI_20M:no     short_GI_40M:no     short_GI_80M:no     LDPC:no     AMSDU:yes     AMSDU_long:no
su_mimo_capable:no     mu_mimo_capable:no     is_wgb_wired:no     is_wgb:no
HE_DL-MIMO:yes     HE_UL-MIMO:yes     HE_DL-OFDMA:yes     HE_UL-OFDMA:yes     HE_TWT_CAPABLE:no

Additional info for client E8:8D:A6:B0:3B:CA
RSSI: -52
SNR: 41
PS  : Legacy (Sleeping)
Tx Rate: 1297100 Kbps
Rx Rate: 1921600 Kbps
VHT_TXMAP: 0
CCX Ver: 0
Rx Key-Index Errs: 0

Statistics for client E8:8D:A6:B0:3B:CA
              mac   intf TxData TxMgmt TxUC TxBytes TxFail TxDcrd TxCumRetries RxData RxMgmt RxBytes RxErr                      TxRt(Mbps) RxRt(Mbps) idle_counter stats_ago expirat
ion
E8:8D:A6:B0:3B:CA apr2v0    391      4  391  129127      0      0           97    559      4   74055     0 HE-160,2SS,MCS6,GI0.8 ,BF(1297)         12          295  8.674000      79
950

Per TID packet statistics for client E8:8D:A6:B0:3B:CA
Priority Rx Pkts Tx Pkts Rx(last 5 s) Tx (last 5 s)
       0     539     383           84            28
       1       0       0            0             0
       2       0       2            0             0
       3       0       0            0             0
       4       0       0            0             0
       5       0       0            0             0
       6      20       3            5             1
       7       0       3            0             0

 Rate Statistics:
Rate-Index    Rx-Pkts    Tx-Pkts Tx-Retries
         0        176          3          0
         5          0         62          0
         6          4        178         21
         7        250        152         52
         8        100          2         22
         9         51          0          0
        10          1          0          0
        11          0          0          2
webauth done: true
Pre-WebAuth ACLs:
Post-Auth ACLs:
Acl name Quota Bytes left In bytes Out bytes In pkts Out pkts Drops-in Drops-out
iPSK TAG: \<0000000000000000>
              MAC Allow HIT iPSK tag
E8:8D:A6:B0:3B:CA  true   0      \<>
检查连接速率的最后一个选项是 OTA 捕获。在数据包的无线电信息中,可以找到必要的信息:
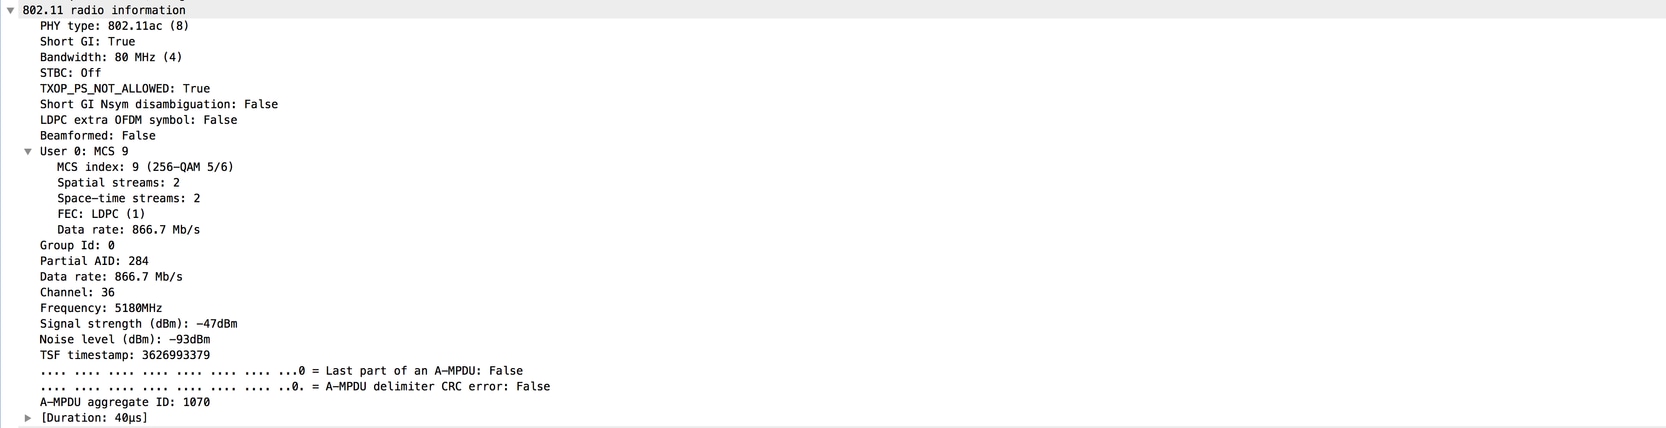
此 OTA 捕获是使用 11ac macbook 客户端进行的。
故障排除
如果在测试过程中没有获得预期结果,在提交 TAC 支持案例之前,有几种方法可以解决问题并收集必要的信息。
故障排除问题可能是由以下原因引起的:
- 客户端
- 无线接入点
- 有线路径(交换相关问题)
- WLC
客户端故障排除
- 第一步是将无线客户端设备上的驱动程序更新为最新版本
- 第二步是对具有不同无线适配器的客户端执行iPerf测试,以查看您是否获得相同结果
-
如果在线会议视频“冻结”或音频质量较差,请配置QoS(Wi-Fi服务质量)。 IP语音(VoIP)、在线游戏、企业视频会议等依赖于实时音频和视频的服务,在延迟和抖动方面有着强烈的要求才能提供优质体验。QoS管理拥塞问题,降低发生冲突的概率,从一开始就避免拥塞。实时应用不会利用高吞吐量,并且不会与网络中的低速度进行比较。它们更多与实时数据包传输的可靠性有关。
使用配置文件在WLC上部署QoS设置:语音、访客、企业、Fastlane。这些配置文件在策略配置文件下配置。WLC还提供四个预配置的QoS配置文件:白金级、金级、银级和铜级(金属QoS策略)。 铜牌用于后台或最低优先级流量,银牌用于尽力而为,金牌用于视频应用,白金用于语音应用。
AP 故障排除
当AP丢弃流量、某些帧或其他行为不当时,可能会出现这种情况。
为了更深入地了解这一点,需要在AP交换机端口上进行空中传输(OTA)捕获+ span会话(span必须在连接AP的交换机上完成)
OTA捕获和SPAN必须在测试期间完成,使用开放式SSID才能看到流向AP的流量和AP流向客户端的流量,反之亦然。
此行为存在几个已知漏洞:
CSCvg07438:AP3800:分段和非分段数据包中 AP 中的丢包导致低吞吐量
CSCva58429:Cisco 1532i AP:低吞吐量(FlexConnect 本地交换 + EoGRE)
有线路径故障排除
交换机本身可能存在一些问题,您需要检查接口上的丢弃量,以及在测试期间丢弃量是否增加。
尝试使用交换机上的另一个端口连接 AP 或 WLC。
另一个选项是将客户端插入同一交换机(客户端终止点 [AP/WLC] 所连接的交换机)并将其置于同一 VLAN,然后在同一 VLAN 上运行有线至有线的测试,以查看有线路径中是否存在任何问题。
WLC 故障排除
可能是因为 WLC 正在丢弃来自客户端的流量(当 AP 处于本地模式时)。
您可以将 AP 置于 FlexConnect 模式,并将 WLAN 置于本地交换模式,然后运行测试。
如果您发现本地模式(中心交换)下的吞吐量与 FlexConnect 本地交换相比有显著差异,并且连接到 WLC 的交换机没有问题,则很可能是 WLC 正在丢弃流量。
要解决此问题,请应用行动计划:
- WLC交换机端口上的SPAN捕获(必须在交换机上完成)
- 在 AP 端口上进行 SPAN 捕获
- 对客户端进行 OTA 捕获
通过执行此故障排除并向TAC提供结果,可加速故障排除过程。
相关信息
 反馈
反馈