排除vEdge双向转发检测和数据平面连接问题
下载选项
非歧视性语言
此产品的文档集力求使用非歧视性语言。在本文档集中,非歧视性语言是指不隐含针对年龄、残障、性别、种族身份、族群身份、性取向、社会经济地位和交叉性的歧视的语言。由于产品软件的用户界面中使用的硬编码语言、基于 RFP 文档使用的语言或引用的第三方产品使用的语言,文档中可能无法确保完全使用非歧视性语言。 深入了解思科如何使用包容性语言。
关于此翻译
思科采用人工翻译与机器翻译相结合的方式将此文档翻译成不同语言,希望全球的用户都能通过各自的语言得到支持性的内容。 请注意:即使是最好的机器翻译,其准确度也不及专业翻译人员的水平。 Cisco Systems, Inc. 对于翻译的准确性不承担任何责任,并建议您总是参考英文原始文档(已提供链接)。
简介
本文档介绍控制平面连接后的vEdge数据平面连接问题,但是站点之间没有数据平面连接。
先决条件
要求
思科建议了解解决方Cisco Software Defined Wide Area Network (SDWAN)案。
使用的组件
本文档不限于特定的软件和硬件版本。 本文档重点介绍vEdge平台。
本文档中的信息都是基于特定实验室环境中的设备编写的。本文档中使用的所有设备最初均采用原始(默认)配置。如果您的网络处于活动状态,请确保您了解所有命令的潜在影响。
对于思科边缘路由器(控制器模式下的Cisco IOS® XE路由器),请阅读。
控制平面信息
检查控制本地属性
要检查vEdge上接口Wide Area Network (WAN)的状态,请使用命令show control local-properties wan-interface-list。
在此输出中,您可以看到RFC 4787 Network Address Translation (NAT) Type。
当vEdge位于NAT设备(防火墙、路由器等)后面时,使用公有和私有IPv4地址、公有和私有源端口来构建数据平面隧User Datagram Protocol (UDP)道。
您还可以找到隧道接口的状态、颜色和已配置的最大控制连接数。
vEdge1# show control local-properties wan-interface-list

 NAT TYPE: E -- indicates End-point independent mapping
           A -- indicates Address-port dependent mapping
           N -- indicates Not learned
           Requires minimum two vbonds to learn the NAT type

           PUBLIC          PUBLIC PRIVATE         PRIVATE          PRIVATE                           MAX   RESTRICT/           LAST        SPI TIME   NAT  VM
INTERFACE  IPv4            PORT   IPv4            IPv6             PORT    VS/VM COLOR        STATE CNTRL  CONTROL/   LR/LB   CONNECTION   REMAINING  TYPE CON
                                                                                                            STUN                                           PRF
---------------------------------------------------------------------------------------------------------------------------------------------------------------
ge0/0      203.0.113.225   4501   10.19.145.2     ::               12386    1/1  gold           up    2    no/yes/no   No/No  7:02:55:13   0:09:02:29  N    5
ge0/1      10.20.67.10     12426  10.20.67.10     ::               12426    0/0  mpls           up    2    yes/yes/no  No/No  0:00:00:01   0:11:40:16  N    5
通过此数据,您可以确定关于必须如何构建数据隧道以及形成数据隧道时可以预期(从路由器的角度)使用哪些端口的特定信息。
检查控制连接
必须确保未形成数据平面隧道的颜色与重叠中的控制器建立了控制连接。
否则,vEdge不会将信Transport Locator (TLOC)息发送到vSmart通Overlay Management Protocol (OMP)道。
您可以使用命令验证它是否可show control connections用,并查找状connect态。
vEdge1# show control connections
                                                                                       PEER                                          PEER                                              CONTROLLER
PEER    PEER PEER            SITE       DOMAIN PEER                                    PRIV  PEER                                    PUB                                               GROUP
TYPE    PROT SYSTEM IP       ID         ID     PRIVATE IP                              PORT  PUBLIC IP                               PORT  LOCAL COLOR     STATE           UPTIME      ID
--------------------------------------------------------------------------------------------------------------------------------------------------------------------------------------------------
vsmart  dtls 10.1.0.3         3          1      203.0.113.13                          12446 203.0.113.13                          12446 gold            up              7:03:18:31  0
vbond   dtls -                0          0      203.0.113.12                          12346 203.0.113.12                          12346 mpls            connect                     0
vmanage dtls 10.1.0.1         1          0      203.0.113.14                          12646 203.0.113.14                          12646 gold            up              7:03:18:31  0
如果接口(不形成数据隧道)尝试连接,请通过使用该颜色成功启动控制连接来解决问题。
或者,在tunnel interfacemax-control-connections 0部分下方的所选接口中设置的。
vpn 0
 interface ge0/1
  ip address 10.20.67.10/24
  tunnel-interface
   encapsulation ipsec
   color mpls restrict
   max-control-connections 0
   no allow-service bgp
   allow-service dhcp
   allow-service dns
   allow-service icmp
   no allow-service sshd
   no allow-service netconf
   no allow-service ntp
   no allow-service ospf
   no allow-service stun
  !
  no shutdown
 !
注意:有时,您可以使用命no control-connections令来实现相同的目标。但是,该命令不会建立最大数量的控制连接。此命令从版本15.4开始已弃用,在较新的软件上不再使用。
重叠管理协议
验证是否已从vEdge通告OMP TLOC
无法发送OMP TLOC,因为接口尝试通过该颜色形成控制连接,并且无法访问控制器。
检查颜色(数据隧道)是否将该特定颜色的TLOC发送到vSmarts。
使用命show omp tlocs advertised令检查发送到OMP对等体的TLOC。
示例:颜色mpls和gold色。未将TLOC发送到vSmart以实现彩色MPLS。
vEdge1# show omp tlocs advertised
C   -> chosen
I   -> installed
Red -> redistributed
Rej -> rejected
L   -> looped
R   -> resolved
S   -> stale
Ext -> extranet
Stg -> staged
Inv -> invalid

                                                                                                                                                PUBLIC           PRIVATE
ADDRESS                                                                      PSEUDO                   PUBLIC                   PRIVATE  PUBLIC  IPV6    PRIVATE  IPV6     BFD
FAMILY   TLOC IP          COLOR            ENCAP  FROM PEER        STATUS    KEY     PUBLIC IP        PORT    PRIVATE IP       PORT     IPV6    PORT    IPV6     PORT     STATUS
----------------------------------------------------------------------------------------------------------------------------------------------------------------------------------
ipv4     10.1.0.5         gold             ipsec  0.0.0.0          C,Red,R   1       203.0.113.225    4501    10.19.145.2      12386    ::      0       ::       0        up
         10.1.0.2         mpls             ipsec  10.1.0.3          C,I,R     1       10.20.67.20      12386   10.20.67.20      12386    ::      0       ::       0        down
         10.1.0.2         blue             ipsec  10.1.0.3          C,I,R     1       198.51.100.187   12406   10.19.146.2      12406    ::      0       ::       0        up
         10.1.0.30         mpls             ipsec  10.1.0.3          C,I,R     1       10.20.67.30      12346   10.20.67.30      12346    ::      0       ::       0        down
         10.1.0.30         gold             ipsec  10.1.0.3          C,I,R     1       192.0.2.129      12386   192.0.2.129      12386    ::      0       ::       0        up
         10.1.0.4         mpls             ipsec  10.1.0.3          C,I,R     1       10.20.67.40      12426   10.20.67.40      12426    ::      0       ::       0        down
         10.1.0.4         gold             ipsec  10.1.0.3          C,I,R     1       203.0.113.226    12386   203.0.113.226    12386    ::      0       ::       0        up
示例:颜色mpls和gold色。为两种颜色发送TLOC。
vEdge2# show omp tlocs advertised
C   -> chosen
I   -> installed
Red -> redistributed
Rej -> rejected
L   -> looped
R   -> resolved
S   -> stale
Ext -> extranet
Stg -> staged
Inv -> invalid

                                                                                                                                                PUBLIC           PRIVATE
ADDRESS                                                                      PSEUDO                   PUBLIC                   PRIVATE  PUBLIC  IPV6    PRIVATE  IPV6     BFD
FAMILY   TLOC IP          COLOR            ENCAP  FROM PEER        STATUS    KEY     PUBLIC IP        PORT    PRIVATE IP       PORT     IPV6    PORT    IPV6     PORT     STATUS
----------------------------------------------------------------------------------------------------------------------------------------------------------------------------------
ipv4     10.1.0.5         gold             ipsec  10.1.0.3          C,I,R     1       203.0.113.225    4501    10.19.145.2      12386    ::      0       ::       0        up
         10.1.0.2         mpls             ipsec  0.0.0.0          C,Red,R   1       10.20.67.20      12386   10.20.67.20      12386    ::      0       ::       0        up
         10.1.0.2         blue             ipsec  0.0.0.0          C,Red,R   1       198.51.100.187   12406   10.19.146.2      12406    ::      0       ::       0        up
         10.1.0.30         mpls             ipsec  10.1.0.3          C,I,R     1       10.20.67.30      12346   10.20.67.30      12346    ::      0       ::       0        up
         10.1.0.30         gold             ipsec  10.1.0.3          C,I,R     1       192.0.2.129      12386   192.0.2.129      12386    ::      0       ::       0        up
         10.1.0.4         mpls             ipsec  10.1.0.3          C,I,R     1       10.20.67.40      12426   10.20.67.40      12426    ::      0       ::       0        up
10.1.0.4 gold ipsec 10.1.0.3 C,I,R 1 203.0.113.226 12386 203.0.113.226 12386 :: 0 :: 0 up 注意:对于任何本地生成的控制平面信息,“FROM PEER”字段设置为0.0.0.0。当您查找本地生成的信息时,请确保基于此值进行匹配。
验证vSmart接收和通告TLOC
TLOC现在通告给vSmart。确认它从正确的对等体接收TLOC并将其通告给其他vEdge。
示例:vSmart接收来自10.1.0.2 vEdge1的TLOC。
vSmart1# show omp tlocs received
C   -> chosen
I   -> installed
Red -> redistributed
Rej -> rejected
L   -> looped
R   -> resolved
S   -> stale
Ext -> extranet
Stg -> staged
Inv -> invalid

                                                                                                                                                PUBLIC           PRIVATE
ADDRESS                                                                      PSEUDO                   PUBLIC                   PRIVATE  PUBLIC  IPV6    PRIVATE  IPV6     BFD
FAMILY   TLOC IP          COLOR            ENCAP  FROM PEER        STATUS    KEY     PUBLIC IP        PORT    PRIVATE IP       PORT     IPV6    PORT    IPV6     PORT     STATUS
----------------------------------------------------------------------------------------------------------------------------------------------------------------------------------
ipv4     10.1.0.5         gold             ipsec  10.1.0.5         C,I,R     1       203.0.113.225  4501    10.19.145.2      12386    ::      0       ::       0        -
         10.1.0.2         mpls             ipsec  10.1.0.2         C,I,R     1       10.20.67.20      12386   10.20.67.20      12386    ::      0       ::       0        -
         10.1.0.2         blue             ipsec  10.1.0.2         C,I,R     1       198.51.100.187   12406   10.19.146.2      12406    ::      0       ::       0        -
         10.1.0.30        mpls             ipsec  10.1.0.30         C,I,R     1       10.20.67.30      12346   10.20.67.30      12346    ::      0       ::       0        -
         10.1.0.30        gold             ipsec  10.1.0.30         C,I,R     1       192.0.2.129      12386   192.0.2.129      12386    ::      0       ::       0        -
         10.1.0.4         mpls             ipsec  10.1.0.4         C,I,R     1       10.20.67.40      12426   10.20.67.40      12426    ::      0       ::       0        -
         10.1.0.4         gold             ipsec  10.1.0.4         C,I,R     1       203.0.113.226    12386   203.0.113.226    12386    ::      0       ::       0        -
如果您未看到TLOC或在此处看到任何其他代码,请检查以下项:
vSmart-vIPtela-MEX# show omp tlocs received
C   -> chosen
I   -> installed
Red -> redistributed
Rej -> rejected
L   -> looped
R   -> resolved
S   -> stale
Ext -> extranet
Stg -> staged
Inv -> invalid

                                                                                                                                                PUBLIC           PRIVATE
ADDRESS                                                                      PSEUDO                   PUBLIC                   PRIVATE  PUBLIC  IPV6    PRIVATE  IPV6     BFD
FAMILY   TLOC IP          COLOR            ENCAP  FROM PEER        STATUS    KEY     PUBLIC IP        PORT    PRIVATE IP       PORT     IPV6    PORT    IPV6     PORT     STATUS
----------------------------------------------------------------------------------------------------------------------------------------------------------------------------------
ipv4     10.1.0.5         gold             ipsec  10.1.0.5         C,I,R     1       203.0.113.225    4501    10.19.145.2      12386    ::      0       ::       0        -
         10.1.0.2         mpls             ipsec  10.1.0.2         C,I,R     1       10.20.67.20      12386   10.20.67.20      12386    ::      0       ::       0        -
         10.1.0.2         blue             ipsec  10.1.0.2         Rej,R,Inv 1       198.51.100.187   12406   10.19.146.2      12406    ::      0       ::       0        -
         10.1.0.30         mpls             ipsec  10.1.0.30         C,I,R     1       10.20.67.30      12346   10.20.67.30      12346    ::      0       ::       0        -
         10.1.0.30         gold             ipsec  10.1.0.30         C,I,R     1       192.0.2.129      12386   192.0.2.129      12386    ::      0       ::       0        -
         10.1.0.4         mpls             ipsec  10.1.0.4         C,I,R     1       10.20.67.40      12426   10.20.67.40      12426    ::      0       ::       0        -
         10.1.0.4         gold             ipsec  10.1.0.4         C,I,R     1       203.0.113.226    12386   203.0.113.226    12386    ::      0       ::       0        -
确认没有阻止TLOC的策略。
show run policy control-policy — 查找在vSmart中拒绝您的TLOC的任advertised何receivedtloc-list。
vSmart1(config-policy)# sh config
policy
 lists
  tloc-list SITE20
   tloc 10.1.0.2 color blue encap ipsec
  !
 !
 control-policy SDWAN
  sequence 10
   match tloc
    tloc-list SITE20
   !
   action reject ----> here we are rejecting the TLOC 10.1.0.2,blue,ipsec
   !
  !
  default-action accept
 !
apply-policy
 site-list SITE20
  control-policy SDWAN in -----> the policy is applied to control traffic coming IN the vSmart, it will filter the tlocs before adding it to the OMP table.
注意:如果TLOC是或Rejected,Invalid则不会通告给其他vEdge。
确保策略在从vSmart通告时不会过滤TLOC。您可以看到在vSmart上收到TLOC,但在另一个vEdge上看不到它。
示例 1:vSmart,在C、I、R中使用TLOC
vSmart1# show omp tlocs
C   -> chosen
I   -> installed
Red -> redistributed
Rej -> rejected
L   -> looped
R   -> resolved
S   -> stale
Ext -> extranet
Stg -> staged
Inv -> invalid

                                                                                                                                                PUBLIC           PRIVATE
ADDRESS                                                                      PSEUDO                   PUBLIC                   PRIVATE  PUBLIC  IPV6    PRIVATE  IPV6     BFD
FAMILY   TLOC IP          COLOR            ENCAP  FROM PEER        STATUS    KEY     PUBLIC IP        PORT    PRIVATE IP       PORT     IPV6    PORT    IPV6     PORT     STATUS
----------------------------------------------------------------------------------------------------------------------------------------------------------------------------------
ipv4     10.1.0.5         mpls             ipsec  10.1.0.5         C,I,R     1       10.20.67.10      12406   10.20.67.10      12406    ::      0       ::       0        -
         10.1.0.5         gold             ipsec  10.1.0.5         C,I,R     1       203.0.113.225    4501    10.19.145.2      12386    ::      0       ::       0        -
         10.1.0.2         mpls             ipsec  10.1.0.2         C,I,R     1       10.20.67.20      12386   10.20.67.20      12386    ::      0       ::       0        -
         10.1.0.2         blue             ipsec  10.1.0.2         C,I,R     1       198.51.100.187   12426   10.19.146.2      12426    ::      0       ::       0        -
         10.1.0.30         mpls             ipsec  10.1.0.30         C,I,R     1       10.20.67.30      12346   10.20.67.30      12346    ::      0       ::       0        -
         10.1.0.30         gold             ipsec  10.1.0.30         C,I,R     1       192.0.2.129      12386   192.0.2.129      12386    ::      0       ::       0        -
         10.1.0.4         mpls             ipsec  10.1.0.4         C,I,R     1       10.20.67.40      12426   10.20.67.40      12426    ::      0       ::       0        -
         10.1.0.4         gold             ipsec  10.1.0.4         C,I,R     1       203.0.113.226    12386   203.0.113.226    12386    ::      0       ::       0        -
示例 2:vEdge1无法看到来自vEdge2的蓝色的TLOC。它只能看到MPLS TLOC。
vEdge1# show omp tlocs
C   -> chosen
I   -> installed
Red -> redistributed
Rej -> rejected
L   -> looped
R   -> resolved
S   -> stale
Ext -> extranet
Stg -> staged
Inv -> invalid

                                                                                                                                                PUBLIC           PRIVATE
ADDRESS                                                                      PSEUDO                   PUBLIC                   PRIVATE  PUBLIC  IPV6    PRIVATE  IPV6     BFD
FAMILY   TLOC IP          COLOR            ENCAP  FROM PEER        STATUS    KEY     PUBLIC IP        PORT    PRIVATE IP       PORT     IPV6    PORT    IPV6     PORT     STATUS
----------------------------------------------------------------------------------------------------------------------------------------------------------------------------------
ipv4     10.1.0.5         mpls             ipsec  0.0.0.0          C,Red,R   1       10.20.67.10      12406   10.20.67.10      12406    ::      0       ::       0        up
         10.1.0.5         gold             ipsec  0.0.0.0          C,Red,R   1       203.0.113.225    4501    10.19.145.2      12386    ::      0       ::       0        up
         10.1.0.2         mpls             ipsec  10.1.0.3          C,I,R     1       10.20.67.20      12386   10.20.67.20      12386    ::      0       ::       0        up
         10.1.0.30         mpls             ipsec  10.1.0.3          C,I,R     1       10.20.67.30      12346   10.20.67.30      12346    ::      0       ::       0        up
         10.1.0.30         gold             ipsec  10.1.0.3          C,I,R     1       192.0.2.129      12386   192.0.2.129      12386    ::      0       ::       0        up
         10.1.0.4         mpls             ipsec  10.1.0.3          C,I,R     1       10.20.67.40      12426   10.20.67.40      12426    ::      0       ::       0        up
         10.1.0.4         gold             ipsec  10.1.0.3          C,I,R     1       203.0.113.226    12386   203.0.113.226    12386    ::      0       ::       0        up
当您选中该策略时,您可以看到为什么TLOC没有出现在vEdge1上。
vSmart1# show running-config policy
policy
 lists
  tloc-list SITE20
   tloc 10.1.0.2 color blue encap ipsec
  !
  site-list SITE10
   site-id 10
  !
 !
 control-policy SDWAN
  sequence 10
   match tloc
    tloc-list SITE20
   !
   action reject
   !
  !
  default-action accept
 !
apply-policy
 site-list SITE10
  control-policy SDWAN out
 !
!
双向转发检测
了解show bfd sessions命令
以下是输出中要查找的关键内容:
vEdge-2# show bfd sessions
                                      SOURCE TLOC      REMOTE TLOC                                      DST PUBLIC                      DST PUBLIC         DETECT      TX
SYSTEM IP        SITE ID  STATE       COLOR            COLOR            SOURCE IP                       IP                              PORT        ENCAP  MULTIPLIER  INTERVAL(msec) UPTIME          TRANSITIONS
-------------------------------------------------------------------------------------------------------------------------------------------------------------------------------------------------------------
10.1.0.5         10       down        blue             gold             10.19.146.2                     203.0.113.225                   4501        ipsec  7           1000           NA              7
10.1.0.30         30       up          blue             gold             10.19.146.2                     192.0.2.129                     12386       ipsec  7           1000           0:00:00:22      2
10.1.0.4         40       up          blue             gold             10.19.146.2                     203.0.113.226                   12386       ipsec  7           1000           0:00:00:22      1
10.1.0.4         40       up          mpls             mpls             10.20.67.10                     10.20.67.40                     12426       ipsec  7           1000           0:00:10:11      0
SYSTEM IP:Peers system-ipSOURCE and REMOTE TLOC COLOR:这有助于了解预期接收和发送的TLOC。SOURCE IP:它是源privateIP。如果您位于NAT后面,则此信息显示在此处(使用时可以看到show control local-properties)。DST PUBLIC IP:无论是否在NAT之后,vEdge都将Data Plane其用作形成隧道的目标。(示例:直接连接到Internet的边缘或链Multi-Protocol Label Switching (MPLS)路)DST PUBLIC PORTvEdge使用的公共NAT转换端口,用于形成到远Data Plane程vEdge的隧道。TRANSITIONS:BFD会话状态从更改为(反之亦然)NA的UP次数。
命令show tunnel statistics
可以show tunnel statistics显示有关数据平面隧道的信息。您可以确定是否为vEdge之间的特定IPSEC隧道发送或接收数据包。
这有助于您了解数据包是否到达每一端,并隔离节点之间的连接问题。
在本例中,当多次运行该命令时,可注意到或中的增量或不增tx-pkts量rx-pkts。
提示:如果您的tx-pkts计数器增加,则向对等体传输数据。如果rx-pkts不增加,则表示未从对等设备接收数据。在这种情况下,请检查另一端并确认tx-pkts是否增加。
                                                                                                                                                       TCP
vEdge2# show tunnel statistics

TUNNEL                                   SOURCE  DEST                                                  TUNNEL                                          MSS
PROTOCOL  SOURCE IP      DEST IP         PORT    PORT   SYSTEM IP    LOCAL COLOR      REMOTE COLOR     MTU     tx-pkts  tx-octets  rx-pkts  rx-octets  ADJUST
---------------------------------------------------------------------------------------------------------------------------------------------------------------
ipsec     172.16.16.147  10.88.244.181   12386   12406  10.1.0.5     public-internet  default          1441    38282    5904968    38276    6440071    1361
ipsec     172.16.16.147  10.152.201.104  12386   63364  10.1.0.0  public-internet  default          1441    33421    5158814    33416    5623178    1361
ipsec     172.16.16.147  10.152.204.31   12386   58851  10.1.0.7     public-internet  public-internet  1441    12746    1975022    12744    2151926    1361
ipsec     172.24.90.129  10.88.244.181   12426   12406  10.1.0.5     biz-internet     default          1441    38293    5906238    38288    6454580    1361
ipsec     172.24.90.129  10.152.201.104  12426   63364  10.1.0.0  biz-internet     default          1441    33415    5157914    33404    5621168    1361
ipsec     172.24.90.129  10.152.204.31   12426   58851  10.1.0.7     biz-internet     public-internet  1441    12750    1975622    12747    2152446    1361

TUNNEL                                   SOURCE  DEST                                                  TUNNEL                                          MSS
PROTOCOL  SOURCE IP      DEST IP         PORT    PORT   SYSTEM IP    LOCAL COLOR      REMOTE COLOR     MTU     tx-pkts  tx-octets  rx-pkts  rx-octets  ADJUST
---------------------------------------------------------------------------------------------------------------------------------------------------------------
ipsec     172.16.16.147  10.88.244.181   12386   12406  10.1.0.5     public-internet  default          1441    39028    6020779    39022    6566326    1361
ipsec     172.16.16.147  10.152.201.104  12386   63364  10.1.0.0  public-internet  default          1441    34167    5274625    34162    5749433    1361
ipsec     172.16.16.147  10.152.204.31   12386   58851  10.1.0.7     public-internet  public-internet  1441    13489    2089069    13487    2276382    1361
ipsec     172.24.90.129  10.88.244.181   12426   12406  10.1.0.5     biz-internet     default          1441    39039    6022049    39034    6580835    1361
ipsec     172.24.90.129  10.152.201.104  12426   63364  10.1.0.0  biz-internet     default          1441    34161    5273725    34149    5747259    1361
ipsec     172.24.90.129  10.152.204.31   12426   58851  10.1.0.7     biz-internet     public-internet  1441    13493    2089669    13490    2276902    1361
另一个有用的命show tunnel statistics bfd令可用于检查特定数据平面隧道内发送和接收的BFD数据包的数量:
vEdge1# show tunnel statistics bfd

                                                                                               BFD   BFD   BFD     BFD
                                                       BFD      BFD                            PMTU  PMTU  PMTU    PMTU
TUNNEL                                  SOURCE  DEST   ECHO TX  ECHO RX  BFD ECHO   BFD ECHO   TX    RX    TX      RX
PROTOCOL  SOURCE IP      DEST IP        PORT    PORT   PKTS     PKTS     TX OCTETS  RX OCTETS  PKTS  PKTS  OCTETS  OCTETS
---------------------------------------------------------------------------------------------------------------------------
ipsec     192.168.109.4  192.168.109.5  4500    4500   0        0        0          0          0     0     0       0
ipsec     192.168.109.4  192.168.109.5  12346   12366  1112255  1112253  186302716  186302381  487   487   395939  397783
ipsec     192.168.109.4  192.168.109.7  12346   12346  1112254  1112252  186302552  186302210  487   487   395939  397783
ipsec     192.168.109.4  192.168.110.5  12346   12366  1112255  1112253  186302716  186302381  487   487   395939  397783
访问列表
查看输出后,访问列表是一个非常有用的必要步show bfd sessions骤。
现在私有和公共IP和端口已知,您可以创建一个与SRC_PORT、DST_PORT、SRC_IP、DST_IP匹配的端Access Control List (ACL)口。
这有助于验证已发送和已接收的BFD消息。
您可以在此处找到ACL配置的示例:
policy
 access-list checkbfd-out
  sequence 10
   match
    source-ip        192.168.0.92/32
    destination-ip   198.51.100.187/32
    source-port      12426
    destination-port 12426
   !
   action accept
    count bfd-out-to-dc1-from-br1
   !
  !
  default-action accept
 !
 access-list checkbfd-in
  sequence 20
   match
    source-ip        198.51.100.187/32
    destination-ip   192.168.0.92/32
    source-port      12426
    destination-port 12426
   !
   action accept
    count bfd-in-from-dc1-to-br1
   !
  !
  default-action accept
 !
vpn 0
 interface ge0/0
   access-list checkbfd-in in
   access-list checkbfd-out out
  !
 !
!
在本例中,此ACL使用两个序列。序列10匹配从此vEdge发送到对等体的BFD消息。序列20则相反。
它与源(Private)端口和目标(Public)端口匹配。如果vEdge使用NAT,请确保检查正确的源端口和目标端口。
要检查每个序列计数器的命中数,请发出 show policy access-list counters
vEdge1# show policy access-list-counters

NAME      COUNTER NAME               PACKETS  BYTES
-----------------------------------------------------
checkbfd  bfd-out-to-dc1-from-br1    10       2048
          bfd-in-from-dc1-to-br1        0        0
网络地址转换
如何使用工具stun-client检测NAT映射和过滤器。
如果您已完成所有步骤,并且已支持NAT,下一步是识别行UDP NAT Traversal (RFC 4787) Map and Filter为。
当vEdge位于NAT设备后面时,此工具用于发现本地vEdge外部IP地址。
此命令获取设备的端口映射,并可以选择性地发现本地设备和服务器(公共服务器:例如google stun server)。
注意:有关更多详细信息,请访问:
vEdge1# tools stun-client vpn 0 options "--mode full --localaddr 192.168.12.100 12386 --verbosity 2 stun.l.google.com 19302" stunclient --mode full --localaddr 192.168.12.100 stun.l.google.com in VPN 0 Binding test: success
Local address: 192.168.12.100:12386
Mapped address: 203.0.113.225:4501
Behavior test: success
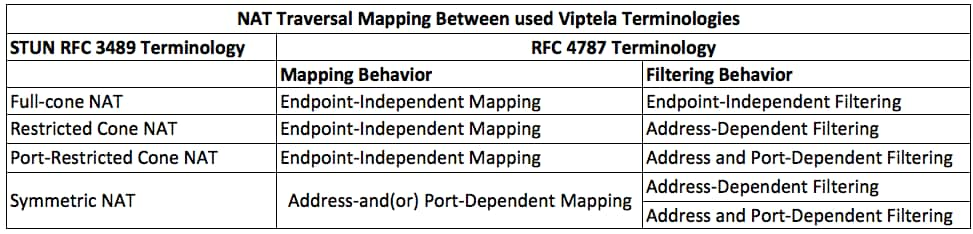
Nat behavior: Address Dependent Mapping
Filtering test: success
Nat filtering: Address and Port Dependent Filtering
在软件的较新版本中,语法可能会略有不同:
vEdge1# tools stun-client vpn 0 options "--mode full --localaddr 192.168.12.100 --localport 12386 --verbosity 2 stun.l.google.com 19302"
在本示例中,您使用连接到Google STUN服务器的UDP源端口12386执行完整的NAT检测测试。
此命令的输出为您提供了NAT行为以及基于RFC 4787的NAT过滤器类型。
注意:使用时,tools stun切记在隧道接口中允许STUN服务,否则它不起作用。使allow-service stun 用以允许stun数据通过。
vEdge1# show running-config vpn 0 interface ge0/0
vpn 0
 interface ge0/0
  ip address 10.19.145.2/30
  !
  tunnel-interface
   encapsulation ipsec
   color gold
   max-control-connections 1
   no allow-service bgp
   allow-service dhcp
   allow-service dns
   no allow-service icmp
   no allow-service sshd
   no allow-service netconf
   no allow-service ntp
   no allow-service ospf
   allow-service stun
  !
  no shutdown
 !
!
这显示了STUN术语(全锥NAT)与RFC 4787(UDP的NAT行为)之间的映射。
CLI中使用的数据平面隧道支持的NAT类型“发送”
在大多数情况下,您的公共颜色(如商业Internet或公共Internet)可以直接连接到Internet。
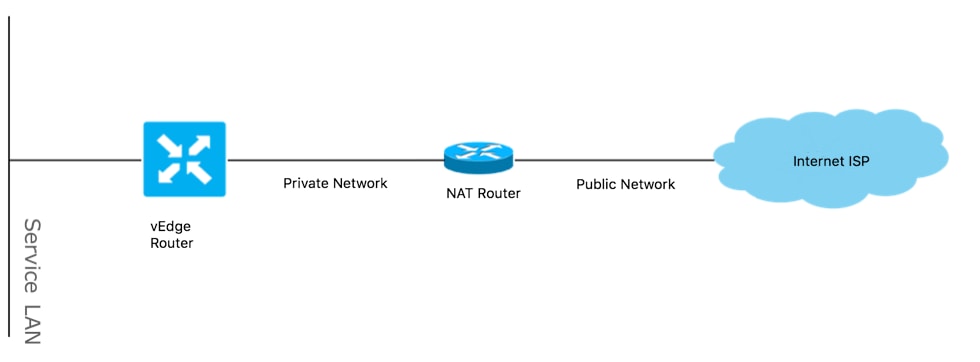
在其他情况下,vEdge WAN接口和实际互联网服务提供商后面有一个NAT设备。
通过这种方式,vEdge可以具有私有IP,而其它设备(路由器、防火墙等)可以是具有面向公有IP地址的设备。
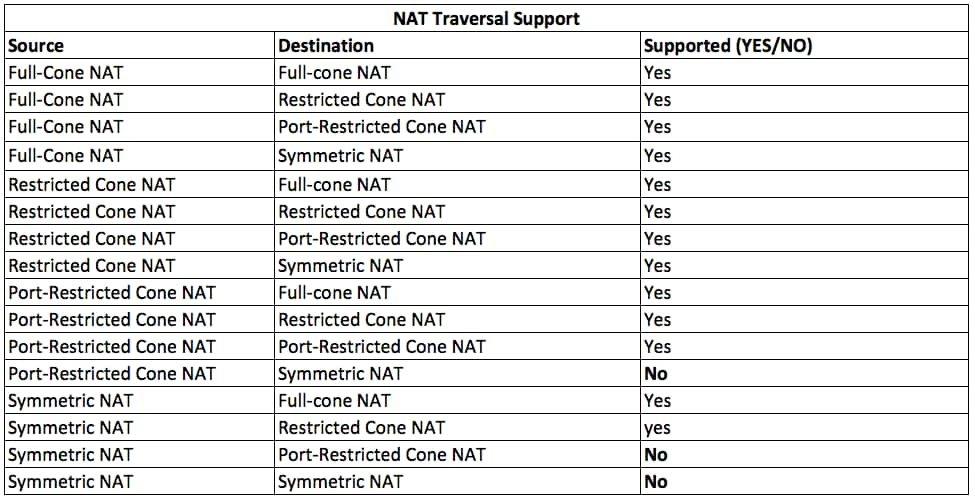
如果您的NAT类型不正确,则可能是不允许形成数据平面隧道的最常见原因之一。以下是支持的NAT类型。
防火墙
如果您已选中NAT及其不在不受支持的Source和Destination类型中,则防火墙可能会阻止用于形成隧道的端Data Plane口。
确保在用于数据平面连接的防火墙中打开以下端口:vEdge to vEdge Data Plane:
UDP12346到13156
对于从vEdge到控制器的控制连接:
UDP12346到13156
TCP 23456到24156
确保打开这些端口,以便成功连接数据平面隧道。
当您检查用于数据平面隧道的源端口和目标端口时,可以使用show tunnel statistics或,show bfd sessions | tab但不能使show bfd sessions用。
它不显示任何源端口,只显示目标端口,如您所见:
vEdge1# show bfd sessions
                                      SOURCE TLOC      REMOTE TLOC                                      DST PUBLIC                      DST PUBLIC         DETECT      TX
SYSTEM IP        SITE ID  STATE       COLOR            COLOR            SOURCE IP                       IP                              PORT        ENCAP  MULTIPLIER  INTERVAL(msec) UPTIME          TRANSITIONS
-------------------------------------------------------------------------------------------------------------------------------------------------------------------------------------------------------------
192.168.30.105   50       up          biz-internet     biz-internet     192.168.109.181                 192.168.109.182                 12346       ipsec  7           1000           1:21:28:05      10
192.168.30.105   50       up          private1         private1         192.168.110.181                 192.168.110.182                 12346       ipsec  7           1000           1:21:26:13      2

vEdge1# show bfd sessions | tab

                                         SRC    DST                    SITE                                     DETECT      TX
SRC IP           DST IP           PROTO  PORT   PORT   SYSTEM IP       ID    LOCAL COLOR   COLOR         STATE  MULTIPLIER  INTERVAL  UPTIME      TRANSITIONS
---------------------------------------------------------------------------------------------------------------------------------------------------------------
192.168.109.181  192.168.109.182  ipsec  12346  12346  192.168.30.105  50    biz-internet  biz-internet  up     7           1000      1:21:28:05  10
192.168.110.181  192.168.110.182  ipsec  12346  12346  192.168.30.105  50    private1      private1      up     7           1000      1:21:26:13  2
注意:有关使用的SD-WAN防火墙端口的详细信息,请访问。
安全
如果观察ACL计数器增加入站和出站流量,请检查几个迭代 show system statistics diff and ensure there are no drops.
vEdge1# show policy access-list-counters

NAME      COUNTER NAME               PACKETS  BYTES
-----------------------------------------------------
checkbfd  bfd-out-to-dc1-from-br1    55       9405
bfd-in-from-dc1-to-br1 54 8478 在此输出中rx_replay_integrity_drops,随着的每个迭代增加 show system statistics diff command.
vEdge1#show system statistics diff

 rx_pkts : 5741427
 ip_fwd : 5952166
 ip_fwd_arp : 3
 ip_fwd_to_egress : 2965437
 ip_fwd_null_mcast_group : 26
 ip_fwd_null_nhop : 86846
 ip_fwd_to_cpu : 1413393
 ip_fwd_from_cpu_non_local : 15
 ip_fwd_rx_ipsec : 1586149
 ip_fwd_mcast_pkts : 26
 rx_bcast : 23957
 rx_mcast : 304
 rx_mcast_link_local : 240
 rx_implicit_acl_drops : 12832
 rx_ipsec_decap : 21
 rx_spi_ipsec_drops : 16
 rx_replay_integrity_drops : 1586035
 port_disabled_rx : 2
 rx_invalid_qtags : 212700
 rx_non_ip_drops : 1038073
 pko_wred_drops : 3
 bfd_tx_record_changed : 23
 rx_arp_non_local_drops : 19893
 rx_arp_reqs : 294
 rx_arp_replies : 34330
 arp_add_fail : 263
 tx_pkts : 4565384
 tx_mcast : 34406
 port_disabled_tx : 3
 tx_ipsec_pkts : 1553753
 tx_ipsec_encap : 1553753
 tx_pre_ipsec_pkts : 1553753
 tx_pre_ipsec_encap : 1553753
 tx_arp_replies : 377
 tx_arp_reqs : 34337
 tx_arp_req_fail : 2
 bfd_tx_pkts : 1553675
 bfd_rx_pkts : 21
 bfd_tx_octets : 264373160
 bfd_rx_octets : 3600
 bfd_pmtu_tx_pkts : 78
 bfd_pmtu_tx_octets : 53052
 rx_icmp_echo_requests : 48
 rx_icmp_network_unreach : 75465
 rx_icmp_other_types : 47
 tx_icmp_echo_requests : 49655
 tx_icmp_echo_replies : 48
 tx_icmp_network_unreach : 86849
 tx_icmp_other_types : 7
vEdge1# show system statistics diff

 rx_pkts : 151
 ip_fwd : 157
 ip_fwd_to_egress : 75
 ip_fwd_null_nhop : 3
 ip_fwd_to_cpu : 43
 ip_fwd_rx_ipsec : 41
 rx_bcast : 1
 rx_replay_integrity_drops : 41
 rx_invalid_qtags : 7
 rx_non_ip_drops : 21
 rx_arp_non_local_drops : 2
 tx_pkts : 114
 tx_ipsec_pkts : 40
 tx_ipsec_encap : 40
 tx_pre_ipsec_pkts : 40
 tx_pre_ipsec_encap : 40
 tx_arp_reqs : 1
 bfd_tx_pkts : 40
 bfd_tx_octets : 6800
 tx_icmp_echo_requests : 1
vEdge1# show system statistics diff

 rx_pkts : 126
 ip_fwd : 125
 ip_fwd_to_egress : 58
 ip_fwd_null_nhop : 3
 ip_fwd_to_cpu : 33
 ip_fwd_rx_ipsec : 36
 rx_bcast : 1
 rx_implicit_acl_drops : 1
 rx_replay_integrity_drops : 35
 rx_invalid_qtags : 6
 rx_non_ip_drops : 22
 rx_arp_replies : 1
 tx_pkts : 97
 tx_mcast : 1
 tx_ipsec_pkts : 31
 tx_ipsec_encap : 31
 tx_pre_ipsec_pkts : 31
 tx_pre_ipsec_encap : 31
 bfd_tx_pkts : 32
 bfd_tx_octets : 5442
 rx_icmp_network_unreach : 3
 tx_icmp_echo_requests : 1
 tx_icmp_network_unreach : 3
vEdge1# show system statistics diff

 rx_pkts : 82
 ip_fwd : 89
 ip_fwd_to_egress : 45
 ip_fwd_null_nhop : 3
 ip_fwd_to_cpu : 24
 ip_fwd_rx_ipsec : 22
 rx_bcast : 1
 rx_implicit_acl_drops : 1
 rx_replay_integrity_drops : 24
 rx_invalid_qtags : 2
 rx_non_ip_drops : 14
 rx_arp_replies : 1
 tx_pkts : 62
 tx_mcast : 1
 tx_ipsec_pkts : 24
 tx_ipsec_encap : 24
 tx_pre_ipsec_pkts : 24
 tx_pre_ipsec_encap : 24
 tx_arp_reqs : 1
 bfd_tx_pkts : 23
 bfd_tx_octets : 3908
 rx_icmp_network_unreach : 3
 tx_icmp_echo_requests : 1
 tx_icmp_network_unreach : 3
vEdge1# show system statistics diff

 rx_pkts : 80
 ip_fwd : 84
 ip_fwd_to_egress : 39
 ip_fwd_to_cpu : 20
 ip_fwd_rx_ipsec : 24
 rx_replay_integrity_drops : 22
 rx_invalid_qtags : 3
 rx_non_ip_drops : 12
 tx_pkts : 66
 tx_ipsec_pkts : 21
 tx_ipsec_encap : 21
 tx_pre_ipsec_pkts : 21
 tx_pre_ipsec_encap : 21
 bfd_tx_pkts : 21
 bfd_tx_octets : 3571
首先,在vEdgerequest security ipsec-rekey上执行。然后,浏览的几个show system statistics diff迭代并查看是否仍看rx_replay_integrity_drops到。
如果是,请检查安全配置。
vEdge1# show running-config security
security
 ipsec
 authentication-type sha1-hmac ah-sha1-hmac
 !
!
DSCP标记流量的ISP问题
默认情况下,从vEdge路由器到控制器的所有控制和管理流量通过DTLS或TLS连接传输,并标有DSCP值CS6(48个十进制)。
对于数据位置隧道流量,vEdge路由器使用IPsec或GRE封装来相互发送数据流量。
为了进行数据平面故障检测和性能测量,路由器会定期相互发送BFD数据包。
这些BFD数据包还使用DSCP值CS6(48个十进制)进行标记。
从ISP的角度来看,此类流量被视为具有DSCP值CS6的UDP流量,因为vEdge路由器和SD-WAN控制器会复制默认情况下标记为外部IP报头的DSCP。
以下是tcpdump在传输ISP路由器上运行时的外观:
14:27:15.993766 IP (tos 0xc0, ttl 64, id 44063, offset 0, flags [DF], proto UDP (17), length 168)
    192.168.109.5.12366 > 192.168.20.2.12346: [udp sum ok] UDP, length 140
14:27:16.014900 IP (tos 0xc0, ttl 63, id 587, offset 0, flags [DF], proto UDP (17), length 139)
    192.168.20.2.12346 > 192.168.109.5.12366: [udp sum ok] UDP, length 111
14:27:16.534117 IP (tos 0xc0, ttl 63, id 0, offset 0, flags [DF], proto UDP (17), length 157)
    192.168.109.5.12366 > 192.168.110.6.12346: [no cksum] UDP, length 129
14:27:16.534289 IP (tos 0xc0, ttl 62, id 0, offset 0, flags [DF], proto UDP (17), length 150)
    192.168.110.6.12346 > 192.168.109.5.12366: [no cksum] UDP, length 122
如图所示,所有数据包都标有TOS字节0xc0,也称为DS字段(等于十进制192或二进制的110 000 00。
前6个高位对应于DSCP位值(十进制或CS6为48)。
输出中的前2个数据包对应于控制平面隧道,其余2个数据包对应于数据平面隧道流量。
根据数据包长度和TOS标记,它可以高把握地断定是BFD数据包(RX和TX方向)。 这些数据包也使用CS6进行标记。
有时,一些服务提供商(尤其是MPLS L3 VPN/MPLS L2 VPN服务提供商)维护不同的SLA,并且可以根据DSCP标记以不同方式处理不同类别的流量。
例如,如果您有高级服务来优先处理DSCP EF和CS6语音和信令流量。
由于优先级流量几乎始终受到管制,即使不超出上行链路的总带宽,这种类型的流量数据包丢失也会出现,因此BFD会话也会出现抖动。
在某些情况下,如果服务提供商路由器上的专用优先级队列不足,您不会看到正常流量有任何丢弃(例如,当您从vEdge路由器运行简单ping时)。
这是因为此类流量使用默认DSCP值0进行标记,如下所示(TOS字节):
15:49:22.268044 IP (tos 0x0, ttl 62, id 0, offset 0, flags [DF], proto UDP (17), length 142)
    192.168.110.5.12366 > 192.168.109.7.12346: [no cksum] UDP, length 114
15:49:22.272919 IP (tos 0x0, ttl 62, id 0, offset 0, flags [DF], proto UDP (17), length 142)
    192.168.110.5.12366 > 192.168.109.7.12346: [no cksum] UDP, length 114
15:49:22.277660 IP (tos 0x0, ttl 62, id 0, offset 0, flags [DF], proto UDP (17), length 142)
    192.168.110.5.12366 > 192.168.109.7.12346: [no cksum] UDP, length 114
15:49:22.314821 IP (tos 0x0, ttl 62, id 0, offset 0, flags [DF], proto UDP (17), length 142)
    192.168.110.5.12366 > 192.168.109.7.12346: [no cksum] UDP, length 114
但与此同时,您的BFD会话会摆动:
show bfd history
                                                       DST PUBLIC       DST PUBLIC                                  RX      TX
SYSTEM IP        SITE ID  COLOR            STATE       IP               PORT        ENCAP  TIME                     PKTS    PKTS    DEL
---------------------------------------------------------------------------------------------------------------------------------------
192.168.30.4     13       public-internet  up          192.168.109.4    12346       ipsec  2019-05-01T03:54:23+0200 127     135     0
192.168.30.4     13       public-internet  up          192.168.109.4    12346       ipsec  2019-05-01T03:54:23+0200 127     135     0
192.168.30.4     13       public-internet  down        192.168.109.4    12346       ipsec  2019-05-01T03:55:28+0200 140     159     0
192.168.30.4     13       public-internet  down        192.168.109.4    12346       ipsec  2019-05-01T03:55:28+0200 140     159     0
192.168.30.4     13       public-internet  up          192.168.109.4    12346       ipsec  2019-05-01T03:55:40+0200 361     388     0
192.168.30.4     13       public-internet  up          192.168.109.4    12346       ipsec  2019-05-01T03:55:40+0200 361     388     0
192.168.30.4     13       public-internet  down        192.168.109.4    12346       ipsec  2019-05-01T03:57:38+0200 368     421     0
192.168.30.4     13       public-internet  down        192.168.109.4    12346       ipsec  2019-05-01T03:57:38+0200 368     421     0
192.168.30.4     13       public-internet  up          192.168.109.4    12346       ipsec  2019-05-01T03:58:05+0200 415     470     0
192.168.30.6     13       public-internet  up          192.168.109.4    12346       ipsec  2019-05-01T03:58:05+0200 415     470     0
192.168.30.6     13       public-internet  down        192.168.109.4    12346       ipsec  2019-05-01T03:58:25+0200 464063  464412  0
此处nping非常方便进行故障排除:
vedge2# tools nping vpn 0 options "--tos 0x0c --icmp --icmp-type echo --delay 200ms -c 100 -q" 192.168.109.7
Nping in VPN 0

Starting Nping 0.6.47 ( http://nmap.org/nping ) at 2019-05-07 15:58 CEST
Max rtt: 200.305ms | Min rtt: 0.024ms | Avg rtt: 151.524ms
Raw packets sent: 100 (2.800KB) | Rcvd: 99 (4.554KB) | Lost: 1 (1.00%)
Nping done: 1 IP address pinged in 19.83 seconds
调试BFD
如果需要更深入的调查,请在vEdge路由器上运行BFD调试。
转发流量管理器(FTM)负责vEdge路由器上的BFD操作,因此您需要debug ftm bfd它。
所有调试输出都存储/var/log/tmplog/vdebug在文件中,如果您希望控制台上出现这些消息(类似于Cisco IOS行为),terminal monitor则可以使用monitor start /var/log/tmplog/vdebug。
要停止日志记录,您可以使用 monitor stop /var/log/tmplog/vdebug
以下是输出如何查找由于超时而关闭的BFD会话(IP地址为192.168.110.6的远程TLOC无法再访问):
log:local7.debug: May  7 16:23:09 vedge2 FTMD[674]: bfdmgr_session_update_state[1008]: BFD-session TNL 192.168.110.5:12366->192.168.110.6:12346,l-tloc(32771)->r-tloc(32772),TLOC 192.168.30.5:biz-internet->192.168.30.6:public-internet IPSEC: BFD Session STATE update, New_State :- DOWN, Reason :- LOCAL_TIMEOUT_DETECT Observed latency :- 7924, bfd_record_index :- 8, Hello timer :- 1000, Detect Multiplier :- 7
log:local7.debug: May  7 16:23:09 vedge2 FTMD[674]: ftm_proc_tunnel_public_tloc_msg[252]: tun_rec_index 13 tloc_index 32772 public tloc 0.0.0.0/0
log:local7.debug: May  7 16:23:09 vedge2 FTMD[674]: ftm_increment_wanif_bfd_flap[2427]: BFD-session TNL 192.168.110.5:12366->192.168.110.6:12346, : Increment the WAN interface counters by 1
log:local7.debug: May  7 16:23:09 vedge2 FTMD[674]: bfdmgr_session_update_state[1119]: BFD-session TNL 192.168.110.5:12366->192.168.110.6:12346,l-tloc(32771)->r-tloc(32772),TLOC 192.168.30.5:biz-internet->192.168.30.6:public-internet IPSEC BFD session history update, old state 3 new state 1 current  flap count 1 prev_index 1 current 2
log:local7.debug: May  7 16:23:09 vedge2 FTMD[674]: ftm_tloc_add[1140]: Attempting to add TLOC : from_ttm 0 origin remote tloc-index 32772 pub 192.168.110.6:12346 pub v6 :::0 system_ip 192.168.30.6 color 5 spi 333
log:local7.debug: May  7 16:23:09 vedge2 FTMD[674]: bfdmgr_session_set_del_marker_internal[852]: (32771:32772) proto 50 src 192.168.110.5:12366 dst 192.168.110.6:12346 ref_count 1
log:local7.debug: May  7 16:23:09 vedge2 FTMD[674]: bfdmgr_session_set_del_marker_internal[852]: (32770:32772) proto 50 src 192.168.109.5:12366 dst 192.168.110.6:12346 ref_count 1
log:local7.debug: May  7 16:23:09 vedge2 FTMD[674]: bfdmgr_session_create[238]: Attempting BFD session creation. Remote-tloc: tloc-index 32772, system-ip 192.168.30.6, color 5 encap 2from local WAN Interface ge0_0
log:local7.debug: May  7 16:23:09 vedge2 FTMD[674]: bfdmgr_session_clear_delete_marker[828]: (32771:32772) proto 50 src 192.168.110.5:12366 dst 192.168.110.6:12346 ref_count 1
log:local7.debug: May  7 16:23:09 vedge2 FTMD[674]: bfdmgr_session_create[238]: Attempting BFD session creation. Remote-tloc: tloc-index 32772, system-ip 192.168.30.6, color 5 encap 2from local WAN Interface ge0_1
log:local7.debug: May  7 16:23:09 vedge2 FTMD[674]: bfdmgr_session_clear_delete_marker[828]: (32770:32772) proto 50 src 192.168.109.5:12366 dst 192.168.110.6:12346 ref_count 1
log:local7.debug: May  7 16:23:09 vedge2 FTMD[674]: bfdmgr_session_update_sa[1207]: BFD-session TNL 192.168.110.5:12366->192.168.110.6:12346,l-tloc(32771)->r-tloc(32772),TLOC 192.168.30.5:biz-internet->192.168.30.6:public-internet IPSEC: session sa index changed from 484 to 484
log:local7.debug: May  7 16:23:09 vedge2 FTMD[674]: ftm_tloc_add[1653]: BFD (32771:32772) src 192.168.110.5:12366 dst 192.168.110.6:12346 record index 8 ref-count 1 sa-idx 484
log:local7.debug: May  7 16:23:09 vedge2 FTMD[674]: bfdmgr_session_update_sa[1207]: BFD-session TNL 192.168.109.5:12366->192.168.110.6:12346,l-tloc(32770)->r-tloc(32772),TLOC 192.168.30.5:public-internet->192.168.30.6:public-internet IPSEC: session sa index changed from 485 to 485
log:local7.debug: May  7 16:23:09 vedge2 FTMD[674]: ftm_tloc_add[1653]: BFD (32770:32772) src 192.168.109.5:12366 dst 192.168.110.6:12346 record index 9 ref-count 1 sa-idx 485
log:local7.debug: May  7 16:23:09 vedge2 FTMD[674]: bfdmgr_session_update_state[1008]: BFD-session TNL 192.168.109.5:12366->192.168.110.6:12346,l-tloc(32770)->r-tloc(32772),TLOC 192.168.30.5:public-internet->192.168.30.6:public-internet IPSEC: BFD Session STATE update, New_State :- DOWN, Reason :- LOCAL_TIMEOUT_DETECT Observed latency :- 7924, bfd_record_index :- 9, Hello timer :- 1000, Detect Multiplier :- 7
log:local7.debug: May  7 16:23:09 vedge2 FTMD[674]: ftm_proc_tunnel_public_tloc_msg[252]: tun_rec_index 14 tloc_index 32772 public tloc 0.0.0.0/0
log:local7.debug: May  7 16:23:09 vedge2 FTMD[674]: ftm_increment_wanif_bfd_flap[2427]: BFD-session TNL 192.168.109.5:12366->192.168.110.6:12346, : Increment the WAN interface counters by 1
log:local7.debug: May  7 16:23:09 vedge2 FTMD[674]: bfdmgr_session_update_state[1119]: BFD-session TNL 192.168.109.5:12366->192.168.110.6:12346,l-tloc(32770)->r-tloc(32772),TLOC 192.168.30.5:public-internet->192.168.30.6:public-internet IPSEC BFD session history update, old state 3 new state 1 current  flap count 1 prev_index 1 current 2
log:local7.debug: May  7 16:23:09 vedge2 FTMD[674]: ftm_tloc_add[1140]: Attempting to add TLOC : from_ttm 0 origin remote tloc-index 32772 pub 192.168.110.6:12346 pub v6 :::0 system_ip 192.168.30.6 color 5 spi 333
log:local7.debug: May  7 16:23:09 vedge2 FTMD[674]: bfdmgr_session_set_del_marker_internal[852]: (32771:32772) proto 50 src 192.168.110.5:12366 dst 192.168.110.6:12346 ref_count 1
log:local7.debug: May  7 16:23:09 vedge2 FTMD[674]: bfdmgr_session_set_del_marker_internal[852]: (32770:32772) proto 50 src 192.168.109.5:12366 dst 192.168.110.6:12346 ref_count 1
log:local7.debug: May  7 16:23:09 vedge2 FTMD[674]: bfdmgr_session_create[238]: Attempting BFD session creation. Remote-tloc: tloc-index 32772, system-ip 192.168.30.6, color 5 encap 2from local WAN Interface ge0_0
log:local7.debug: May  7 16:23:09 vedge2 FTMD[674]: bfdmgr_session_clear_delete_marker[828]: (32771:32772) proto 50 src 192.168.110.5:12366 dst 192.168.110.6:12346 ref_count 1
log:local7.debug: May  7 16:23:09 vedge2 FTMD[674]: bfdmgr_session_create[238]: Attempting BFD session creation. Remote-tloc: tloc-index 32772, system-ip 192.168.30.6, color 5 encap 2from local WAN Interface ge0_1
log:local7.debug: May  7 16:23:09 vedge2 FTMD[674]: bfdmgr_session_clear_delete_marker[828]: (32770:32772) proto 50 src 192.168.109.5:12366 dst 192.168.110.6:12346 ref_count 1
log:local7.debug: May  7 16:23:09 vedge2 FTMD[674]: bfdmgr_session_update_sa[1207]: BFD-session TNL 192.168.110.5:12366->192.168.110.6:12346,l-tloc(32771)->r-tloc(32772),TLOC 192.168.30.5:biz-internet->192.168.30.6:public-internet IPSEC: session sa index changed from 484 to 484
log:local7.debug: May  7 16:23:09 vedge2 FTMD[674]: ftm_tloc_add[1653]: BFD (32771:32772) src 192.168.110.5:12366 dst 192.168.110.6:12346 record index 8 ref-count 1 sa-idx 484
log:local7.debug: May  7 16:23:09 vedge2 FTMD[674]: bfdmgr_session_update_sa[1207]: BFD-session TNL 192.168.109.5:12366->192.168.110.6:12346,l-tloc(32770)->r-tloc(32772),TLOC 192.168.30.5:public-internet->192.168.30.6:public-internet IPSEC: session sa index changed from 485 to 485
log:local7.debug: May  7 16:23:09 vedge2 FTMD[674]: ftm_tloc_add[1653]: BFD (32770:32772) src 192.168.109.5:12366 dst 192.168.110.6:12346 record index 9 ref-count 1 sa-idx 485
log:local7.debug: May  7 16:23:09 vedge2 FTMD[674]: ftm_send_bfd_msg[499]: Sending BFD notification Down notification to TLOC id 32772
log:local7.debug: May  7 16:23:09 vedge2 FTMD[674]: ftm_tloc_add[1140]: Attempting to add TLOC : from_ttm 1 origin remote tloc-index 32772 pub 192.168.110.6:12346 pub v6 :::0 system_ip 192.168.30.6 color 5 spi 333
log:local7.debug: May  7 16:23:09 vedge2 FTMD[674]: bfdmgr_session_set_del_marker_internal[852]: (32771:32772) proto 50 src 192.168.110.5:12366 dst 192.168.110.6:12346 ref_count 1
log:local7.debug: May  7 16:23:09 vedge2 FTMD[674]: bfdmgr_session_set_del_marker_internal[852]: (32770:32772) proto 50 src 192.168.109.5:12366 dst 192.168.110.6:12346 ref_count 1
log:local7.debug: May  7 16:23:09 vedge2 FTMD[674]: ftm_tloc_add[1285]: UPDATE local tloc
log:local7.debug: May  7 16:23:09 vedge2 FTMD[674]: bfdmgr_session_create[238]: Attempting BFD session creation. Remote-tloc: tloc-index 32772, system-ip 192.168.30.6, color 5 encap 2from local WAN Interface ge0_0
log:local7.debug: May  7 16:23:09 vedge2 FTMD[674]: bfdmgr_session_clear_delete_marker[828]: (32771:32772) proto 50 src 192.168.110.5:12366 dst 192.168.110.6:12346 ref_count 1
log:local7.debug: May  7 16:23:09 vedge2 FTMD[674]: bfdmgr_session_create[238]: Attempting BFD session creation. Remote-tloc: tloc-index 32772, system-ip 192.168.30.6, color 5 encap 2from local WAN Interface ge0_1
log:local7.debug: May  7 16:23:09 vedge2 FTMD[674]: bfdmgr_session_clear_delete_marker[828]: (32770:32772) proto 50 src 192.168.109.5:12366 dst 192.168.110.6:12346 ref_count 1
log:local7.debug: May  7 16:23:09 vedge2 FTMD[674]: bfdmgr_session_update_sa[1207]: BFD-session TNL 192.168.110.5:12366->192.168.110.6:12346,l-tloc(32771)->r-tloc(32772),TLOC 192.168.30.5:biz-internet->192.168.30.6:public-internet IPSEC: session sa index changed from 484 to 484
log:local7.debug: May  7 16:23:09 vedge2 FTMD[674]: ftm_tloc_add[1653]: BFD (32771:32772) src 192.168.110.5:12366 dst 192.168.110.6:12346 record index 8 ref-count 1 sa-idx 484
log:local7.debug: May  7 16:23:09 vedge2 FTMD[674]: bfdmgr_session_update_sa[1207]: BFD-session TNL 192.168.109.5:12366->192.168.110.6:12346,l-tloc(32770)->r-tloc(32772),TLOC 192.168.30.5:public-internet->192.168.30.6:public-internet IPSEC: session sa index changed from 485 to 485
log:local7.debug: May  7 16:23:09 vedge2 FTMD[674]: ftm_tloc_add[1653]: BFD (32770:32772) src 192.168.109.5:12366 dst 192.168.110.6:12346 record index 9 ref-count 1 sa-idx 485
log:local7.info: May  7 16:23:09 vedge2 FTMD[674]: %Viptela-vedge2-ftmd-6-INFO-1400002: Notification: 5/7/2019 14:23:9 bfd-state-change severity-level:major host-name:"vedge2" system-ip:192.168.30.5 src-ip:192.168.110.5 dst-ip:192.168.110.6 proto:ipsec src-port:12366 dst-port:12346 local-system-ip:192.168.30.5 local-color:"biz-internet" remote-system-ip:192.168.30.6 remote-color:"public-internet" new-state:down deleted:false flap-reason:timeout
log:local7.info: May  7 16:23:09 vedge2 FTMD[674]: %Viptela-vedge2-ftmd-6-INFO-1400002: Notification: 5/7/2019 14:23:9 bfd-state-change severity-level:major host-name:"vedge2" system-ip:192.168.30.5 src-ip:192.168.109.5 dst-ip:192.168.110.6 proto:ipsec src-port:12366 dst-port:12346 local-system-ip:192.168.30.5 local-color:"public-internet" remote-system-ip:192.168.30.6 remote-color:"public-internet" new-state:down deleted:false flap-reason:timeout
要启用的另一个有价值的调试Tunnel Traffic Manager (TTM)是事件debugdebug ttm events。
从TTM的角BFD DOWN度来看,事件如下所示:
log:local7.debug: May  7 16:58:19 vedge2 TTMD[683]: ttm_debug_announcement[194]: Received TTM Msg LINK_BFD, Client: ftmd, AF: LINK
log:local7.debug: May  7 16:58:19 vedge2 TTMD[683]: ttm_debug_announcement[413]:     Remote-TLOC: 192.168.30.6 : public-internet : ipsec, Local-TLOC: 192.168.30.5 : biz-internet : ipsec, Status: DOWN, Rec Idx: 13 MTU: 1441, Loss: 77, Latency: 0, Jitter: 0
log:local7.debug: May  7 16:58:19 vedge2 TTMD[683]: ttm_debug_announcement[194]: Received TTM Msg LINK_BFD, Client: ftmd, AF: LINK
log:local7.debug: May  7 16:58:19 vedge2 TTMD[683]: ttm_debug_announcement[413]:     Remote-TLOC: 192.168.30.6 : public-internet : ipsec, Local-TLOC: 192.168.30.5 : public-internet : ipsec, Status: DOWN, Rec Idx: 14 MTU: 1441, Loss: 77, Latency: 0, Jitter: 0
log:local7.debug: May  7 16:58:19 vedge2 TTMD[683]: ttm_debug_announcement[194]: Received TTM Msg BFD, Client: ftmd, AF: TLOC-IPV4
log:local7.debug: May  7 16:58:19 vedge2 TTMD[683]: ttm_debug_announcement[402]:     TLOC: 192.168.30.6 : public-internet : ipsec, Status: DOWN
log:local7.debug: May  7 16:58:19 vedge2 TTMD[683]: ttm_af_tloc_db_bfd_status[234]:   BFD message: I SAY WHAT WHAT tloc 192.168.30.6 : public-internet : ipsec status is 0
log:local7.debug: May  7 16:58:19 vedge2 TTMD[683]: ttm_debug_announcement[194]: Sent TTM Msg TLOC_ADD, Client: ompd, AF: TLOC-IPV4
log:local7.debug: May  7 16:58:19 vedge2 TTMD[683]: ttm_debug_announcement[213]:     TLOC: 192.168.30.6 : public-internet : ipsec, Index: 32772, Origin: REMOTE, Status: DOWN, LR enabled: 0, LR hold time: 0
log:local7.debug: May  7 16:58:19 vedge2 TTMD[683]: ttm_debug_announcement[217]:       Attributes: GROUP PREF WEIGHT GEN-ID VERSION TLOCv4-PUB TLOCv4-PRI TLOCv6-PUB TLOCv6-PRI SITE-ID CARRIER ENCAP RESTRICT
log:local7.debug: May  7 16:58:19 vedge2 TTMD[683]: ttm_debug_announcement[220]:         Preference: 0
log:local7.debug: May  7 16:58:19 vedge2 TTMD[683]: ttm_debug_announcement[223]:         Weight: 1
log:local7.debug: May  7 16:58:19 vedge2 TTMD[683]: ttm_debug_announcement[226]:         Gen-ID: 2147483661
log:local7.debug: May  7 16:58:19 vedge2 TTMD[683]: ttm_debug_announcement[229]:         Version: 2
log:local7.debug: May  7 16:58:19 vedge2 TTMD[683]: ttm_debug_announcement[232]:         Site-ID: 13
log:local7.debug: May  7 16:58:19 vedge2 TTMD[683]: ttm_debug_announcement[235]:         Carrier: 4
log:local7.debug: May  7 16:58:19 vedge2 TTMD[683]: ttm_debug_announcement[241]:         Restrict: 0
log:local7.debug: May  7 16:58:19 vedge2 TTMD[683]: ttm_debug_announcement[249]:         Group: Count: 1
log:local7.debug: May  7 16:58:19 vedge2 TTMD[683]: ttm_debug_announcement[262]:         Groups: 0
log:local7.debug: May  7 16:58:19 vedge2 TTMD[683]: ttm_debug_announcement[269]:         TLOCv4-Public: 192.168.110.6:12346
log:local7.debug: May  7 16:58:19 vedge2 TTMD[683]: ttm_debug_announcement[273]:         TLOCv4-Private: 192.168.110.6:12346
log:local7.debug: May  7 16:58:19 vedge2 TTMD[683]: ttm_debug_announcement[277]:         TLOCv6-Public: :::0
log:local7.debug: May  7 16:58:19 vedge2 TTMD[683]: ttm_debug_announcement[281]:         TLOCv6-Private: :::0
log:local7.debug: May  7 16:58:19 vedge2 TTMD[683]: ttm_debug_announcement[285]:         TLOC-Encap: ipsec-tunnel
log:local7.debug: May  7 16:58:19 vedge2 TTMD[683]: ttm_debug_announcement[295]:           Authentication: unknown(0x98) Encryption: aes256(0xc) SPI 334 Proto ESP
log:local7.debug: May  7 16:58:19 vedge2 TTMD[683]: ttm_debug_announcement[312]:           SPI 334, Flags 0x1e           Integrity: 1, encrypt-keys: 1 auth-keys: 1
log:local7.debug: May  7 16:58:19 vedge2 TTMD[683]: ttm_debug_announcement[317]:           Number of protocols 0
log:local7.debug: May  7 16:58:19 vedge2 TTMD[683]: ttm_debug_announcement[328]:           Number of encrypt types: 2
log:local7.debug: May  7 16:58:19 vedge2 TTMD[683]: ttm_debug_announcement[333]:           Encrypt type[0] AES256-GCM
log:local7.debug: May  7 16:58:19 vedge2 TTMD[683]: ttm_debug_announcement[333]:           Encrypt type[1] AES256-CBC
log:local7.debug: May  7 16:58:19 vedge2 TTMD[683]: ttm_debug_announcement[339]:           Number of integrity types: 1
log:local7.debug: May  7 16:58:19 vedge2 TTMD[683]: ttm_debug_announcement[344]:           integrity type[0] HMAC_SHA1
log:local7.debug: May  7 16:58:19 vedge2 TTMD[683]: ttm_debug_announcement[349]:       #Paths: 0
log:local7.debug: May  7 16:58:19 vedge2 TTMD[683]: ttm_debug_announcement[194]: Sent TTM Msg TLOC_ADD, Client: ftmd, AF: TLOC-IPV4
log:local7.debug: May  7 16:58:19 vedge2 TTMD[683]: ttm_debug_announcement[213]:     TLOC: 192.168.30.6 : public-internet : ipsec, Index: 32772, Origin: REMOTE, Status: DOWN, LR enabled: 0, LR hold time: 0
log:local7.debug: May  7 16:58:19 vedge2 TTMD[683]: ttm_debug_announcement[217]:       Attributes: GROUP PREF WEIGHT GEN-ID VERSION TLOCv4-PUB TLOCv4-PRI TLOCv6-PUB TLOCv6-PRI SITE-ID CARRIER ENCAP RESTRICT
log:local7.debug: May  7 16:58:19 vedge2 TTMD[683]: ttm_debug_announcement[220]:         Preference: 0
log:local7.debug: May  7 16:58:19 vedge2 TTMD[683]: ttm_debug_announcement[223]:         Weight: 1
log:local7.debug: May  7 16:58:19 vedge2 TTMD[683]: ttm_debug_announcement[226]:         Gen-ID: 2147483661
log:local7.debug: May  7 16:58:19 vedge2 TTMD[683]: ttm_debug_announcement[229]:         Version: 2
log:local7.debug: May  7 16:58:19 vedge2 TTMD[683]: ttm_debug_announcement[232]:         Site-ID: 13
log:local7.debug: May  7 16:58:19 vedge2 TTMD[683]: ttm_debug_announcement[235]:         Carrier: 4
log:local7.debug: May  7 16:58:19 vedge2 TTMD[683]: ttm_debug_announcement[241]:         Restrict: 0
log:local7.debug: May  7 16:58:19 vedge2 TTMD[683]: ttm_debug_announcement[249]:         Group: Count: 1
log:local7.debug: May  7 16:58:19 vedge2 TTMD[683]: ttm_debug_announcement[262]:         Groups: 0
log:local7.debug: May  7 16:58:19 vedge2 TTMD[683]: ttm_debug_announcement[269]:         TLOCv4-Public: 192.168.110.6:12346
log:local7.debug: May  7 16:58:19 vedge2 TTMD[683]: ttm_debug_announcement[273]:         TLOCv4-Private: 192.168.110.6:12346
log:local7.debug: May  7 16:58:19 vedge2 TTMD[683]: ttm_debug_announcement[277]:         TLOCv6-Public: :::0
log:local7.debug: May  7 16:58:19 vedge2 TTMD[683]: ttm_debug_announcement[281]:         TLOCv6-Private: :::0
log:local7.debug: May  7 16:58:19 vedge2 TTMD[683]: ttm_debug_announcement[285]:         TLOC-Encap: ipsec-tunnel
log:local7.debug: May  7 16:58:19 vedge2 TTMD[683]: ttm_debug_announcement[295]:           Authentication: unknown(0x98) Encryption: aes256(0xc) SPI 334 Proto ESP
log:local7.debug: May  7 16:58:19 vedge2 TTMD[683]: ttm_debug_announcement[312]:           SPI 334, Flags 0x1e           Integrity: 1, encrypt-keys: 1 auth-keys: 1
log:local7.debug: May  7 16:58:19 vedge2 TTMD[683]: ttm_debug_announcement[317]:           Number of protocols 0
log:local7.debug: May  7 16:58:19 vedge2 TTMD[683]: ttm_debug_announcement[328]:           Number of encrypt types: 2
log:local7.debug: May  7 16:58:19 vedge2 TTMD[683]: ttm_debug_announcement[333]:           Encrypt type[0] AES256-GCM
log:local7.debug: May  7 16:58:19 vedge2 TTMD[683]: ttm_debug_announcement[333]:           Encrypt type[1] AES256-CBC
log:local7.debug: May  7 16:58:19 vedge2 TTMD[683]: ttm_debug_announcement[339]:           Number of integrity types: 1
log:local7.debug: May  7 16:58:19 vedge2 TTMD[683]: ttm_debug_announcement[344]:           integrity type[0] HMAC_SHA1
log:local7.debug: May  7 16:58:19 vedge2 TTMD[683]: ttm_debug_announcement[349]:       #Paths: 0
log:local7.debug: May  7 16:58:19 vedge2 TTMD[683]: ttm_debug_announcement[194]: Sent TTM Msg TLOC_ADD, Client: fpmd, AF: TLOC-IPV4
log:local7.debug: May  7 16:58:19 vedge2 TTMD[683]: ttm_debug_announcement[213]:     TLOC: 192.168.30.6 : public-internet : ipsec, Index: 32772, Origin: REMOTE, Status: DOWN, LR enabled: 0, LR hold time: 0
log:local7.debug: May  7 16:58:19 vedge2 TTMD[683]: ttm_debug_announcement[217]:       Attributes: GROUP PREF WEIGHT GEN-ID VERSION TLOCv4-PUB TLOCv4-PRI TLOCv6-PUB TLOCv6-PRI SITE-ID CARRIER ENCAP RESTRICT
log:local7.debug: May  7 16:58:19 vedge2 TTMD[683]: ttm_debug_announcement[220]:         Preference: 0
log:local7.debug: May  7 16:58:19 vedge2 TTMD[683]: ttm_debug_announcement[223]:         Weight: 1
log:local7.debug: May  7 16:58:19 vedge2 TTMD[683]: ttm_debug_announcement[226]:         Gen-ID: 2147483661
log:local7.debug: May  7 16:58:19 vedge2 TTMD[683]: ttm_debug_announcement[229]:         Version: 2
log:local7.debug: May  7 16:58:19 vedge2 TTMD[683]: ttm_debug_announcement[232]:         Site-ID: 13
log:local7.debug: May  7 16:58:19 vedge2 TTMD[683]: ttm_debug_announcement[235]:         Carrier: 4
log:local7.debug: May  7 16:58:19 vedge2 TTMD[683]: ttm_debug_announcement[241]:         Restrict: 0
log:local7.debug: May  7 16:58:19 vedge2 TTMD[683]: ttm_debug_announcement[249]:         Group: Count: 1
log:local7.debug: May  7 16:58:19 vedge2 TTMD[683]: ttm_debug_announcement[262]:         Groups: 0
log:local7.debug: May  7 16:58:19 vedge2 TTMD[683]: ttm_debug_announcement[269]:         TLOCv4-Public: 192.168.110.6:12346
log:local7.debug: May  7 16:58:19 vedge2 TTMD[683]: ttm_debug_announcement[273]:         TLOCv4-Private: 192.168.110.6:12346
log:local7.debug: May  7 16:58:19 vedge2 TTMD[683]: ttm_debug_announcement[277]:         TLOCv6-Public: :::0
log:local7.debug: May  7 16:58:19 vedge2 TTMD[683]: ttm_debug_announcement[281]:         TLOCv6-Private: :::0
log:local7.debug: May  7 16:58:19 vedge2 TTMD[683]: ttm_debug_announcement[285]:         TLOC-Encap: ipsec-tunnel
log:local7.debug: May  7 16:58:19 vedge2 TTMD[683]: ttm_debug_announcement[295]:           Authentication: unknown(0x98) Encryption: aes256(0xc) SPI 334 Proto ESP
log:local7.debug: May  7 16:58:19 vedge2 TTMD[683]: ttm_debug_announcement[312]:           SPI 334, Flags 0x1e           Integrity: 1, encrypt-keys: 1 auth-keys: 1
log:local7.debug: May  7 16:58:19 vedge2 TTMD[683]: ttm_debug_announcement[317]:           Number of protocols 0
log:local7.debug: May  7 16:58:19 vedge2 TTMD[683]: ttm_debug_announcement[328]:           Number of encrypt types: 2
log:local7.debug: May  7 16:58:19 vedge2 TTMD[683]: ttm_debug_announcement[333]:           Encrypt type[0] AES256-GCM
log:local7.debug: May  7 16:58:19 vedge2 TTMD[683]: ttm_debug_announcement[333]:           Encrypt type[1] AES256-CBC
log:local7.debug: May  7 16:58:19 vedge2 TTMD[683]: ttm_debug_announcement[339]:           Number of integrity types: 1
log:local7.debug: May  7 16:58:19 vedge2 TTMD[683]: ttm_debug_announcement[344]:           integrity type[0] HMAC_SHA1
log:local7.debug: May  7 16:58:19 vedge2 TTMD[683]: ttm_debug_announcement[349]:       #Paths: 0
log:local7.debug: May  7 16:58:19 vedge2 TTMD[683]: ttm_debug_announcement[194]: Sent TTM Msg DATA_DEVICE_ADD, Client: pimd, AF: DATA-DEVICE-IPV4
log:local7.debug: May  7 16:58:19 vedge2 TTMD[683]: ttm_debug_announcement[431]:     Device: 192.168.30.6, Status: 2
log:local7.info: May  7 16:58:19 vedge2 FTMD[674]: %Viptela-vedge2-ftmd-6-INFO-1400002: Notification: 5/7/2019 14:58:19 bfd-state-change severity-level:major host-name:"vedge2" system-ip:192.168.30.5 src-ip:192.168.110.5 dst-ip:192.168.110.6 proto:ipsec src-port:12366 dst-port:12346 local-system-ip:192.168.30.5 local-color:"biz-internet" remote-system-ip:192.168.30.6 remote-color:"public-internet" new-state:down deleted:false flap-reason:timeout
log:local7.info: May  7 16:58:20 vedge2 FTMD[674]: %Viptela-vedge2-ftmd-6-INFO-1400002: Notification: 5/7/2019 14:58:19 bfd-state-change severity-level:major host-name:"vedge2" system-ip:192.168.30.5 src-ip:192.168.109.5 dst-ip:192.168.110.6 proto:ipsec src-port:12366 dst-port:12346 local-system-ip:192.168.30.5 local-color:"public-internet" remote-system-ip:192.168.30.6 remote-color:"public-internet" new-state:down deleted:false flap-reason:timeout
使用数据包跟踪捕获BFD数据包(20.5及更高版本)
20.5.1及更高版本软件中引入的另一个有用工具是vEdge的数据包跟踪。
由于BFD会话使用相同的标准端口(通常为12346),因此基于对等IP地址进行过滤最简单。
例如:
vedge# show bfd sessions
                                      SOURCE TLOC      REMOTE TLOC                                      DST PUBLIC                      DST PUBLIC         DETECT      TX
SYSTEM IP        SITE ID  STATE       COLOR            COLOR            SOURCE IP                       IP                              PORT        ENCAP  MULTIPLIER  INTERVAL(msec) UPTIME          TRANSITIONS
-------------------------------------------------------------------------------------------------------------------------------------------------------------------------------------------------------------
10.4.4.1         101      up          default          default          192.168.16.29                   192.168.22.103                  12386       ipsec  7           1000           0:03:23:34      0
10.4.4.2         102      up          default          default          192.168.16.29                   192.168.29.39                   12346       ipsec  7           1000           0:03:21:24      1
将配置packet-trace:
vedge# debug packet-trace condition ingress-if ge0/0 vpn 0 source-ip 192.168.29.39
vedge# debug packet-trace condition start
vedge# debug packet-trace condition stop
使用下面注解的show命令可以显示结果。对于入口数据包,BFD流量有一个“isBFD”标志,设置为“1”(true)。
vedge# show packet-trace statistics
packet-trace statistics 0
 source-ip             192.168.29.39
 source-port           12346
 destination-ip        192.168.16.29
 destination-port      12346
 source-interface      ge0_0
 destination-interface loop0.1
 decision              FORWARD
 duration              25
packet-trace statistics 1
 source-ip             192.168.29.39
 source-port           12346
 destination-ip        192.168.16.29
 destination-port      12346
 source-interface      ge0_0
 destination-interface loop0.1
 decision              FORWARD
 duration              14
packet-trace statistics 2
 source-ip             192.168.29.39
 source-port           12346
 destination-ip        192.168.16.29
 destination-port      12346
 source-interface      ge0_0
 destination-interface loop0.1
 decision              FORWARD
 duration              14

vedge# show packet-trace detail 0
==========================================================================================================================
Pkt-id           src_ip(ingress_if)            dest_ip(egress_if)           Duration           Decision           Protocol
==========================================================================================================================
0         192.168.29.39:12346 (ge0_0)    192.168.16.29:12346 (loop0.1)        25 us             FORWARD              17
INGRESS_PKT:
00 50 56 84 79 be 00 50 56 84 3c b5 08 00 45 c0 00 96 ab 40 40 00 3f 11 e0 c1 c0 a8 1d 27 c0
a8 10 1d 30 3a 30 3a 00 82 00 00 a0 00 01 02 00 00 0e 3f 4b 65 07 bc 61 03 38 71 93 53 58
88 d8 08 41 95 7c 1a ff 8b cc b4 d0 d8 61 44 40 67 cc 1a 01 fd 1f c4 45 95 ea 7e 15 c9 08
2e b6 63 84 00
EGRESS_PKT:
a1 5e fe 11 00 00 00 00 00 00 00 00 00 00 04 00 0c 04 00 41 01 02 00 00 00 00 00 00 00 00 00
00 00 00 00 00 00 04 00 00 00 00 00 00 00 02 00 3a 30 3a 30 1d 10 a8 c0 00 00 00 00 00 00
00 00 00 00 00 00 01 00 00 00 27 1d a8 c0 00 00 00 00 00 00 00 00 00 00 00 00 01 00 00 00
a4 00 01 00 00
Feature Data
------------------------------------
TOUCH : fp_proc_packet
core_id: 2
DSCP: 48
------------------------------------
TOUCH : fp_proc_packet2
core_id: 2
DSCP: 48
------------------------------------
TOUCH : fp_ip_forward
core_id: 2
DSCP: 48
------------------------------------
TOUCH : fp_ipsec_decrypt
core_id: 2
DSCP: 48
------------------------------------
FP_TRACE_FEAT_IPSEC_DATA:
src_ip : 192.168.29.39
src_port : 3784
dst_ip : 192.168.16.29
dst_port : 3784
isBFD : 1
core_id: 2
DSCP: 48
------------------------------------
TOUCH : fp_send_pkt
core_id: 2
DSCP: 48
------------------------------------
TOUCH : fp_hw_x86_pkt_free
core_id: 2
DSCP: 48
------------------------------------
TOUCH : fp_proc_remote_bfd_
core_id: 2
DSCP: 48
------------------------------------
TOUCH : BFD_ECHO_REPLY
core_id: 2
DSCP: 48
------------------------------------
TOUCH : fp_hw_x86_pkt_free
core_id: 2
DSCP: 48
以类似方式捕获出口BFD数据包。这些结果可标识特定类型,无论是回应请求还是应答。
vedge# debug packet-trace condition vpn 0 destination-ip 192.168.29.39
vedge# debug packet-trace condition start
vedge# debug packet-trace condition stop
vedge# show packet-trace statistics
packet-trace statistics 0
 source-ip             192.168.16.29
 source-port           3784
 destination-ip        192.168.29.39
 destination-port      3784
 source-interface      loop0.0
 destination-interface ge0_0
 decision              FORWARD
 duration              15
packet-trace statistics 1
 source-ip             192.168.16.29
 source-port           3784
 destination-ip        192.168.29.39
 destination-port      3784
 source-interface      loop0.0
 destination-interface ge0_0
 decision              FORWARD
 duration              66
packet-trace statistics 2
 source-ip             192.168.16.29
 source-port           3784
 destination-ip        192.168.29.39
 destination-port      3784
 source-interface      loop0.0
 destination-interface ge0_0
 decision              FORWARD
 duration              17

vedge# show packet-trace details 0
==========================================================================================================================
Pkt-id           src_ip(ingress_if)            dest_ip(egress_if)           Duration           Decision           Protocol
==========================================================================================================================
0         192.168.16.29:3784 (loop0.0)   192.168.29.39:3784 (ge0_0)           15 us             FORWARD              17
INGRESS_PKT:
45 c0 00 4f 00 00 40 00 ff 11 cc 48 c0 a8 10 1d c0 a8 1d 27 0e c8 0e c8 00 3b 00 00 80 c0 07
00 00 00 00 01 00 00 00 01 00 0f 42 40 00 0f 42 40 00 0f 42 40 01 00 0c 01 00 00 1d 3b b1
c9 89 d7 03 00 0f c0 a8 10 1d 30 3a c0 a8 1d 27 30 3a a3 96 07 3b 47 1c 60 d1 d5 76 4c 72
78 1f 9a 0d 00
EGRESS_PKT:
00 50 56 84 3c b5 00 50 56 84 79 be 08 00 45 c0 00 96 ab 40 40 00 3f 11 e0 c1 c0 a8 10 1d c0
a8 1d 27 30 3a 30 3a 00 82 00 00 a0 00 01 01 00 00 5c 3d 88 9a c7 28 23 1b e6 18 ea fe 73
1b b9 e3 79 bf d9 f4 72 41 96 c1 47 07 44 56 77 5a a2 fb 43 59 c1 97 59 47 62 21 77 d4 f4
47 8b 30 b0 00
Feature Data
------------------------------------
TOUCH : fp_send_bfd_pkt
core_id: 0
DSCP: 48
------------------------------------
TOUCH : BFD_ECHO_REPLY
core_id: 0
DSCP: 48
------------------------------------
TOUCH : fp_ipsec_loopback_f
core_id: 0
DSCP: 48
------------------------------------
TOUCH : fp_send_pkt
core_id: 0
DSCP: 48
------------------------------------
TOUCH : fp_ip_forward
core_id: 2
DSCP: 48
------------------------------------
TOUCH : fp_send_ip_packet
core_id: 2
DSCP: 48
------------------------------------
TOUCH : fp_send_pkt
core_id: 2
DSCP: 48
------------------------------------
TOUCH : fp_hw_x86_pkt_free
core_id: 2
DSCP: 48
vedge# show packet-trace details 1
==========================================================================================================================
Pkt-id           src_ip(ingress_if)            dest_ip(egress_if)           Duration           Decision           Protocol
==========================================================================================================================
1         192.168.16.29:3784 (loop0.0)   192.168.29.39:3784 (ge0_0)           66 us             FORWARD              17
INGRESS_PKT:
45 c0 00 56 00 00 40 00 ff 11 cc 41 c0 a8 10 1d c0 a8 1d 27 0e c8 0e c8 00 42 00 00 80 c0 07
00 00 00 00 01 00 00 00 01 00 0f 42 40 00 0f 42 40 00 0f 42 40 01 00 0c 00 00 00 1d b8 35
a8 09 88 03 00 0f c0 a8 10 1d 30 3a c0 a8 1d 27 30 3a 04 00 07 01 00 05 a6 38 ff 7e 06 1e
da 23 19 d5 00
EGRESS_PKT:
00 50 56 84 3c b5 00 50 56 84 79 be 08 00 45 c0 00 9d ab 40 40 00 3f 11 e0 ba c0 a8 10 1d c0
a8 1d 27 30 3a 30 3a 00 89 00 00 a0 00 01 01 00 00 5c 3e 2d 3b 9e 81 aa 10 26 54 7f 47 5c
d8 81 4f 23 2e 3c 39 1e 94 b2 f4 fb a4 ba 98 54 73 99 8f 2e 95 d7 69 fb 91 41 96 93 03 5b
a4 e4 e8 82 00
Feature Data
------------------------------------
TOUCH : fp_send_bfd_pkt
core_id: 0
DSCP: 48
------------------------------------
TOUCH : BFD_ECHO_REQUEST
core_id: 0
DSCP: 48
------------------------------------
TOUCH : fp_ipsec_loopback_f
core_id: 0
DSCP: 48
------------------------------------
TOUCH : fp_send_pkt
core_id: 0
DSCP: 48
------------------------------------
TOUCH : fp_ip_forward
core_id: 2
DSCP: 48
------------------------------------
TOUCH : fp_send_ip_packet
core_id: 2
DSCP: 48
------------------------------------
TOUCH : fp_send_pkt
core_id: 2
DSCP: 48
------------------------------------
TOUCH : fp_hw_x86_pkt_free
core_id: 2
DSCP: 48
相关信息
修订历史记录
| 版本 | 发布日期 | 备注 |
|---|---|---|
2.0 |
28-Sep-2022
|
首次公开发布 |
1.0 |
13-Jun-2019
|
初始版本 |
 反馈
反馈