Cisco Traffic Anomaly Detector Module Web-Based Manager コンフィギュレーション ガイド Software Release 6.1 and 6.1-XG
偏向のない言語
この製品のマニュアルセットは、偏向のない言語を使用するように配慮されています。このマニュアルセットでの偏向のない言語とは、年齢、障害、性別、人種的アイデンティティ、民族的アイデンティティ、性的指向、社会経済的地位、およびインターセクショナリティに基づく差別を意味しない言語として定義されています。製品ソフトウェアのユーザーインターフェイスにハードコードされている言語、RFP のドキュメントに基づいて使用されている言語、または参照されているサードパーティ製品で使用されている言語によりドキュメントに例外が存在する場合があります。シスコのインクルーシブランゲージに対する取り組みの詳細は、こちらをご覧ください。
翻訳について
このドキュメントは、米国シスコ発行ドキュメントの参考和訳です。リンク情報につきましては、日本語版掲載時点で、英語版にアップデートがあり、リンク先のページが移動/変更されている場合がありますことをご了承ください。あくまでも参考和訳となりますので、正式な内容については米国サイトのドキュメントを参照ください。
- Updated:
- 2017年6月14日
章のタイトル: Detector モジュール とゾーンの動作の 監視
Detector モジュールとゾーンの動作の監視
この章では、Cisco Traffic Anomaly Detector Module(Detector モジュール)とそのゾーンのステータスを監視する方法、およびゾーンのトラフィック フローに関連する問題を診断する方法について説明します。
Detector の要約画面の表示
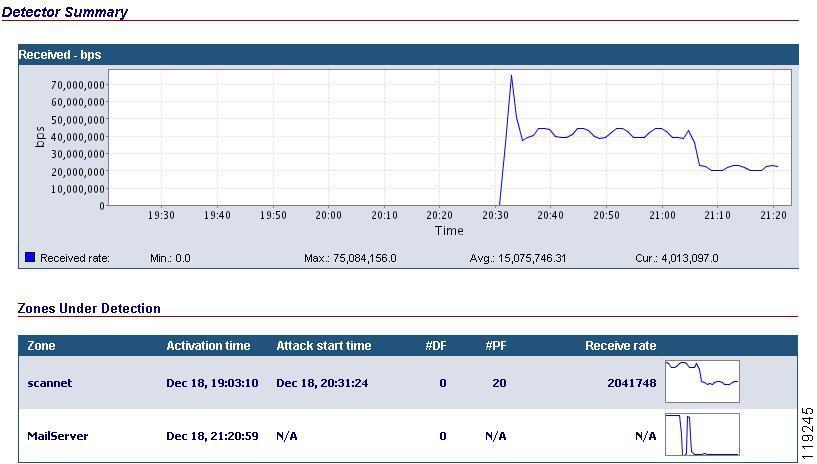
Detector の要約画面(図10-1 を参照)には、現在の Detector モジュール アクティビティの要約が表示されます。これは、Detector モジュールの WBM に接続したときに最初に表示される画面です。この画面は、インターフェイス内の次の場所から表示できます。
•![]() ナビゲーション ペインで Detector Summary をクリックする。
ナビゲーション ペインで Detector Summary をクリックする。
Detector の要約画面には、次の 2 つの領域があります。
•![]() Detector Summary:最近 2 時間に Detector モジュールが処理した受信トラフィック レートの要約をビット/秒(bps)単位でグラフに示します。
Detector Summary:最近 2 時間に Detector モジュールが処理した受信トラフィック レートの要約をビット/秒(bps)単位でグラフに示します。
表10-1 に、グラフの下に表示される情報の説明を示します。
|
|
|
|---|---|
•![]() Zones Under Detection:Detector モジュールが現在トラフィックの異常を監視しているゾーンのステータス情報を示します。ゾーン情報は、次の異常検出モードのどちらをアクティブにするかによって異なります。
Zones Under Detection:Detector モジュールが現在トラフィックの異常を監視しているゾーンのステータス情報を示します。ゾーン情報は、次の異常検出モードのどちらをアクティブにするかによって異なります。
–![]() Detect:ゾーンが攻撃を受けている場合、および通常のトラフィック状態にある場合に、ゾーン情報を表示します。
Detect:ゾーンが攻撃を受けている場合、および通常のトラフィック状態にある場合に、ゾーン情報を表示します。
–![]() Detect and Learn:ゾーンが攻撃を受けている場合にのみ、ゾーン情報を表示します。
Detect and Learn:ゾーンが攻撃を受けている場合にのみ、ゾーン情報を表示します。
Detector モジュールでは、ゾーンは攻撃を受けた順にリスト表示されます(最後に攻撃を受けたゾーンがリストの最上部に表示されます)。各行の Detector モジュールに表示される情報をクリックすると、関連付けられているゾーンの要約画面を表示できます。
表10-2 に、検出実行中のゾーンに含まれているフィールドの説明を示します。
|
|
|
|---|---|
動的フィルタの数。Detector モジュールが動的フィルタを作成するのは異常を検出した場合だけであるため、#DF 値が 0 より大きい場合は、ゾーンに対する攻撃を示します。 |
|
保留動的フィルタの数。インタラクティブ保護モードではなく、自動保護モードでゾーンを実行している場合、画面に N/A と表示されます。 |
|
Detector モジュールのグローバル診断ツールの使用
Detector モジュールでは、グローバル イベントの監視およびトラブルシューティングに役立つ診断情報が提供されます。この項は、次の内容で構成されています。
グローバル カウンタの表示
Counters 画面には、Detector モジュールが Detector モジュールの要約画面に表示するカウンタ情報の詳細な分析が提供されます。Counters 画面から、Detector モジュールがトラフィック レートのグラフに表示する情報をフィルタできます。
Detector モジュールのカウンタを表示するには、次の手順を実行します。
ステップ 1![]() ナビゲーション ペインの Detector Summary をクリックします。Detector の要約メニューが表示されます。
ナビゲーション ペインの Detector Summary をクリックします。Detector の要約メニューが表示されます。
ステップ 2![]() Detector の要約メニューで、 Diagnostics > Counters > Device Counters を選択します。Counters 画面が表示されます。
Detector の要約メニューで、 Diagnostics > Counters > Device Counters を選択します。Counters 画面が表示されます。
デフォルトでは、トラフィック レートのグラフには、最近 2 時間に記録した、bps 単位で測定されたカウンタ情報が表示されます。
ステップ 3![]() (オプション)Detector モジュールがトラフィック レートのグラフで使用する測定単位を変更します。Graph Type ドロップダウン リストで測定単位を選択します。
(オプション)Detector モジュールがトラフィック レートのグラフで使用する測定単位を変更します。Graph Type ドロップダウン リストで測定単位を選択します。
ステップ 4![]() Update Graph をクリックします。Detector モジュールにより、グラフがアップデートされます。
Update Graph をクリックします。Detector モジュールにより、グラフがアップデートされます。
ステップ 5![]() (オプション)Detector モジュールのカウンタをクリアするには、 Clear Counters をクリックします。Detector モジュールが現在のカウンタとトラフィック レートをクリアします。カウンタにテスト セッションの情報だけが含まれるようにテストを実行する場合は、Detector モジュールのカウンタをクリアできます。
(オプション)Detector モジュールのカウンタをクリアするには、 Clear Counters をクリックします。Detector モジュールが現在のカウンタとトラフィック レートをクリアします。カウンタにテスト セッションの情報だけが含まれるようにテストを実行する場合は、Detector モジュールのカウンタをクリアできます。
受信パケットのカウンタは、Detector モジュールが受信して分析したパケットの総数を示します。
表10-3 に、受信パケットのカウンタに含まれているフィールドの説明を示します。
|
|
|
|---|---|
Detector モジュールのカウンタのクリア
カウンタにテスト セッションの情報だけが含まれるようにテストを実行する場合は、Detector モジュールのカウンタをクリアできます。
Detector モジュールのカウンタをクリアするには、次の手順を実行します。
ステップ 1![]() ナビゲーション ペインの Detector Summary をクリックします。Detector の要約メニューが表示されます。
ナビゲーション ペインの Detector Summary をクリックします。Detector の要約メニューが表示されます。
ステップ 2![]() Detector の要約メニューで、 Diagnostics > Counters > Device Counters を選択します。Counters 画面が表示されます。
Detector の要約メニューで、 Diagnostics > Counters > Device Counters を選択します。Counters 画面が表示されます。
ステップ 3![]() Clear Counters をクリックします。Detector モジュールが現在のカウンタとトラフィック レートをクリアします。
Clear Counters をクリックします。Detector モジュールが現在のカウンタとトラフィック レートをクリアします。
グローバル受信カウンタのリアルタイムでの表示
Detector モジュールでは、受信パケットのカウンタ情報をリアルタイムで表示できます。受信パケットのカウンタは、Detector モジュールが受信して分析したパケットの総数を示します。

(注) カウンタ情報をリアルタイムに表示するには、クライアントに Java Runtime Environment(JRE)をインストールしておく必要があります(第1章「製品の概要」の「Java 2 Runtime Environment のインストール」の項を参照)。
カウンタをリアルタイムで表示するには、次の手順を実行します。
ステップ 1![]() ナビゲーション ペインの Detector Summary をクリックします。Detector の要約メニューが表示されます。
ナビゲーション ペインの Detector Summary をクリックします。Detector の要約メニューが表示されます。
ステップ 2![]() Detector の要約メニューで Diagnostics > Counters > Real time counters を選択します。Real Time Counters 画面が表示されます。
Detector の要約メニューで Diagnostics > Counters > Real time counters を選択します。Real Time Counters 画面が表示されます。
ステップ 3![]() (オプション)トラフィック レートのグラフで Detector モジュールが使用する測定単位を変更するには、次のいずれかの Graph Type オプションを選択します。
(オプション)トラフィック レートのグラフで Detector モジュールが使用する測定単位を変更するには、次のいずれかの Graph Type オプションを選択します。
Detector モジュールにより、トラフィック レートのグラフがアップデートされます。
イベント ログの表示
Detector モジュールは、検出されているゾーンおよび Detector モジュールの動作に関連するシステム アクティビティとイベントを自動的に記録します。Detector モジュールのログを表示して、Detector モジュールのアクティビティを確認および追跡できます。
表10-4 に、イベントの重大度レベルの説明を示します。
|
|
|
|---|---|
(注) イベント ログに表示されるのは、ゾーンに関係するイベントとその重大度レベル(Emergency、Alert、Critical、Error、Warning、または Notification)のみです。ゾーンのイベント ログの詳細については、「ゾーンのイベント ログの表示」の項を参照してください。
ステップ 1![]() ナビゲーション ペインの Detector Summary をクリックします。Detector の要約メニューが表示されます。
ナビゲーション ペインの Detector Summary をクリックします。Detector の要約メニューが表示されます。
ステップ 2![]() Detector の要約メニューで、 Diagnostics > Event log を選択します。Events 画面が表示されます。イベント テーブルの上にあるナビゲーション ツールを使用して、イベントをスクロールします。
Detector の要約メニューで、 Diagnostics > Event log を選択します。Events 画面が表示されます。イベント テーブルの上にあるナビゲーション ツールを使用して、イベントをスクロールします。
ステップ 3![]() (オプション)次のオプションのいずれかを選択し、イベント テーブルに表示するイベントを制御します。
(オプション)次のオプションのいずれかを選択し、イベント テーブルに表示するイベントを制御します。
•![]() Show all Events :すべての重大度レベルのイベントを表示します。
Show all Events :すべての重大度レベルのイベントを表示します。
•![]() Show events with severity level :選択した重大度レベルのイベントだけを表示します( 表10-4 を参照)。
Show events with severity level :選択した重大度レベルのイベントだけを表示します( 表10-4 を参照)。
ステップ 4![]() Filter Events をクリックします。Detector モジュールにより、イベント テーブルがアップデートされます。
Filter Events をクリックします。Detector モジュールにより、イベント テーブルがアップデートされます。
デバイス リソースの監視
Detector モジュールがシステム ステータスの分析と監視に使用しているリソースの概要を表示できます。
Detector モジュールのリソースのリストを表示するには、次の手順を実行します。
ステップ 1![]() ナビゲーション ペインで Detector Summary をクリックします。Detector の要約メニューが表示されます。
ナビゲーション ペインで Detector Summary をクリックします。Detector の要約メニューが表示されます。
ステップ 2![]() Detector の要約メニューで、 Diagnostics > Device Resources を選択します。Detector モジュールの Device Resources 画面が表示されます。
Detector の要約メニューで、 Diagnostics > Device Resources を選択します。Detector モジュールの Device Resources 画面が表示されます。
表10-5 に、Device Resources 画面に含まれるフィールドの説明を示します。
|
|
|
|---|---|
CPU1 が user mode、system mode、niced tasks、および idle になっている CPU 時間の割合。niced tasks はシステム時間とユーザ時間にもカウントされるので、CPU 使用率合計は 100 % を超えることがあります。 |
|
Detector モジュールが使用している割り当て済みフラッシュ スペースの割合。 フラッシュ スペースの使用率がディスクの最大キャパシティの約 75 % に達すると、Detector モジュールはシステム ログに警告メッセージを表示し、トラップを送信します。 フラッシュの使用率がディスクの最大キャパシティの 80 % に達すると、Detector モジュールは情報を消去して、使用しているディスク スペースを約 75 % まで削減します。 Detector モジュールのレコードをネットワーク サーバに定期的に保存して、古いレコードを削除することをお勧めします。 フラッシュ スペースの使用率が 80 % に達した場合、ゾーン攻撃レポートをネットワーク サーバにエクスポートしてから、古い攻撃レポートを削除できます(「攻撃レポートのエクスポート」および「攻撃レポートの削除」の項を参照)。 |
|
| アクセラレータ カードのメモリ使用率が 85 % を超える場合、Detector モジュールは SNMP トラップを生成します。大きな値は、Detector モジュールが大量のトラフィックを監視していることを示す場合があります。 |
|
| アクセラレータ カードの CPU 使用率が 85 % を超える場合、Detector モジュールは SNMP トラップを生成します。大きな値は、Detector モジュールが大量のトラフィックを監視していることを示す場合があります。 |
|
Detector モジュールの統計エンジンが使用するメモリの割合を指定します。異常検出エンジンのメモリ使用率は、アクティブなゾーンの数、各ゾーンが監視するサービスの数、Detector モジュールが監視している非スプーフィング トラフィックの量の影響を受けます。 |
|
すべてのゾーンでアクティブになっている動的フィルタの総数。Detector モジュールは、アクティブな動的フィルタの数と、Detector モジュールがサポートしている総数 150,000 の動的フィルタのうちアクティブな動的フィルタの割合を表示します。アクティブな動的フィルタの数が 150,000 に達した場合、Detector モジュールは重大度レベル EMERGENCY の SNMP トラップを生成します。アクティブな動的フィルタの数が 135,000 に達した場合、Detector モジュールは重大度レベル WARNING の SNMP トラップを生成します。 |
|
ゾーンのステータス画面の表示
ゾーンのステータス画面(図10-2 を参照)には、ゾーン動作のステータスの要約が示されます。この画面には、次の方法で移動できます。
•![]() ナビゲーション ペインの All Zones リストでゾーン名をクリックする。
ナビゲーション ペインの All Zones リストでゾーン名をクリックする。
•![]() ゾーンの異常検出が現在イネーブルの場合は、ナビゲーション ペインの Under Detection リストからゾーン名をクリックする。
ゾーンの異常検出が現在イネーブルの場合は、ナビゲーション ペインの Under Detection リストからゾーン名をクリックする。
•![]() ゾーンの特定の画面のナビゲーション パスで、 Zone をクリックする。
ゾーンの特定の画面のナビゲーション パスで、 Zone をクリックする。
•![]() ゾーンのリスト( Detector Summary > Zones > Zone list )でゾーン名をクリックする。
ゾーンのリスト( Detector Summary > Zones > Zone list )でゾーン名をクリックする。
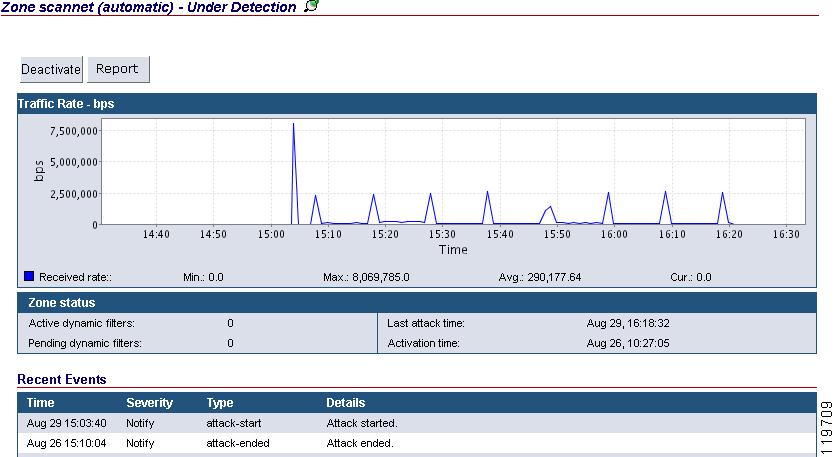
ゾーンのステータス画面は 4 つの領域(ゾーンのステータス バー、ゾーンのトラフィック レートのグラフ、ゾーンのステータス テーブル、ゾーンの最近のイベント テーブル)に分割されています。次の項で説明します。
ゾーンのステータス画面には、機能ボタンがあります。WBM では、ゾーンの現在の動作モードに応じて、異なる機能ボタンが表示されます。
•![]() Detect & Learn:Detect and Learn 機能をアクティブにします。この機能により、Detector モジュールはラーニング プロセスのしきい値調整フェーズの実行中に、ゾーン トラフィックの異常を検出できます。このボタンを使用することは、ゾーンのメイン メニューで Detection > Detect を選択し、 Learning > Tune Thresholds を選択する(この順序は重要でありません)のと同じです。
Detect & Learn:Detect and Learn 機能をアクティブにします。この機能により、Detector モジュールはラーニング プロセスのしきい値調整フェーズの実行中に、ゾーン トラフィックの異常を検出できます。このボタンを使用することは、ゾーンのメイン メニューで Detection > Detect を選択し、 Learning > Tune Thresholds を選択する(この順序は重要でありません)のと同じです。
•![]() Detect:ゾーンの異常検出をアクティブにします。このボタンを使用することは、ゾーンのメイン メニューで Detection > Detect を選択するのと同じです。
Detect:ゾーンの異常検出をアクティブにします。このボタンを使用することは、ゾーンのメイン メニューで Detection > Detect を選択するのと同じです。
ゾーンの異常検出または Detect and Learn 機能が現在イネーブルの場合、次の機能ボタンが表示されます。
•![]() Deactivate:ゾーン保護を非アクティブにします。このボタンを使用することは、ゾーンのメイン メニューで Detection > Deactivate を選択するのと同じです。
Deactivate:ゾーン保護を非アクティブにします。このボタンを使用することは、ゾーンのメイン メニューで Detection > Deactivate を選択するのと同じです。
Detect and Learn 機能がイネーブルの場合、 Deactivate をクリックすると、ゾーン異常検出、ラーニング、またはその両方の操作を非アクティブにするオプションを使用できます。
•![]() Report:現在の攻撃レポートへのリンクを提供します。このボタンを使用することは、ゾーンのメイン メニューで Diagnostics > Attack reports > Attack Summary を選択し、現在の攻撃(識別番号(#)が Curr になっている攻撃)をクリックするのと同じです。Report ボタンは、進行中の攻撃がある場合のみ使用できます。詳細については、「攻撃レポートの詳細について」の項を参照してください。
Report:現在の攻撃レポートへのリンクを提供します。このボタンを使用することは、ゾーンのメイン メニューで Diagnostics > Attack reports > Attack Summary を選択し、現在の攻撃(識別番号(#)が Curr になっている攻撃)をクリックするのと同じです。Report ボタンは、進行中の攻撃がある場合のみ使用できます。詳細については、「攻撃レポートの詳細について」の項を参照してください。
ゾーンのステータス バーについて
ゾーンのステータス バーは、ゾーンのステータス画面の最上部に表示され、現在操作しているゾーンのステータスをすばやく参照することができます。ゾーンのステータス バーでは、次の情報が提供されます。
•![]() Detector モジュールがゾーンの異常検出を実行するモード:Detector モジュールがゾーンに対して自動検出モードで動作するか、インタラクティブ検出モードで動作するかを示します。ゾーンの動作モード設定の詳細については、 第9章「異常の検出のアクティブ化」 の「自動動作モードとインタラクティブ動作モード」および「自動検出モードまたはインタラクティブ検出モードのアクティブ化」の項を参照してください。
Detector モジュールがゾーンの異常検出を実行するモード:Detector モジュールがゾーンに対して自動検出モードで動作するか、インタラクティブ検出モードで動作するかを示します。ゾーンの動作モード設定の詳細については、 第9章「異常の検出のアクティブ化」 の「自動動作モードとインタラクティブ動作モード」および「自動検出モードまたはインタラクティブ検出モードのアクティブ化」の項を参照してください。
•![]() ゾーンの動作状態:ゾーンの現在の動作状態を示します。動作ステータスは、Under Detection、Under Detection/Tuning Thresholds、Inactive、Constructing Policy、または Tuning Thresholds です。
ゾーンの動作状態:ゾーンの現在の動作状態を示します。動作ステータスは、Under Detection、Under Detection/Tuning Thresholds、Inactive、Constructing Policy、または Tuning Thresholds です。
•![]() 新しい推奨事項:新しい動的フィルタの推奨事項が利用可能になっており、推奨事項を受け入れるか、無視するか、自動アクティべーションに誘導するかを確認し、決定できることを示します。この通知が利用可能なのは、ゾーンの動作モードがインタラクティブに設定されている場合のみです。
新しい推奨事項:新しい動的フィルタの推奨事項が利用可能になっており、推奨事項を受け入れるか、無視するか、自動アクティべーションに誘導するかを確認し、決定できることを示します。この通知が利用可能なのは、ゾーンの動作モードがインタラクティブに設定されている場合のみです。
ゾーンのトラフィック レートのグラフについて
ゾーンのトラフィック レートのグラフには、最近 2 時間に受信した、bps 単位で測定されたトラフィックのレートが表示されます。
表10-6 に、ゾーンのトラフィック レートのグラフの下に表示されるフィールドの説明を示します。
|
|
|
|---|---|
ゾーンのステータス テーブルについて
ゾーンのステータス テーブルでは、ゾーンの現在の動作に関する情報が提供されます。このテーブルには次の情報が含まれています。
•![]() Active Dynamic filters:アクティブになっている動的フィルタの数。Detector モジュールがゾーンのトラフィックに異常を検出した場合、アクティブな動的フィルタの数は 1 より大きくなります。
Active Dynamic filters:アクティブになっている動的フィルタの数。Detector モジュールがゾーンのトラフィックに異常を検出した場合、アクティブな動的フィルタの数は 1 より大きくなります。
Dynamic Filters 画面を表示するには、 Active Dynamic filters をクリックします。動的フィルタの使用の詳細については、 第9章「異常の検出のアクティブ化」 の「動的フィルタの管理」の項を参照してください。
•![]() Pending dynamic filters:保留動的フィルタの数。保留動的フィルタの数は、ゾーンがインタラクティブ検出モードになっていて新しい推奨事項がある場合は、1 より大きくなります。
Pending dynamic filters:保留動的フィルタの数。保留動的フィルタの数は、ゾーンがインタラクティブ検出モードになっていて新しい推奨事項がある場合は、1 より大きくなります。
Recommendations 画面を表示するには、Pending Dynamic filters をクリックします。Detector モジュールの推奨事項の詳細については、 第9章「異常の検出のアクティブ化」 の「動的フィルタに対する Detector モジュールの推奨事項の管理」の項を参照してください。
ゾーンの最近のイベント テーブルについて
最近のイベント テーブルには、 notify 以上の重大度を持つ、報告されるゾーン イベントが表示されます。また、Detector モジュールは、ゾーンのイベント ログおよび Detector モジュールのイベント ログにもイベントを記録します。
ゾーンの診断ツールの使用
Detector モジュールでは、ゾーン イベントの監視およびトラブルシューティングに役立つ診断情報が提供されます。この項は、次の内容で構成されています。
•![]() トラフィック フローを分析するためのゾーンのカウンタの使用
トラフィック フローを分析するためのゾーンのカウンタの使用
ゾーンのカウンタの表示
ゾーンのカウンタを利用すると、ゾーン固有のトラフィック情報を分析してゾーンのステータスを確認し、ゾーンの異常の検出が適切に機能しているかどうかを判断できます。ゾーンのカウンタのグラフ表示の期間を変更すると、ゾーン保護がどのように進行しているかを確認できます。
ステップ 1![]() ナビゲーション ペインでゾーンを選択します。ゾーンのメイン メニューが表示されます。
ナビゲーション ペインでゾーンを選択します。ゾーンのメイン メニューが表示されます。
ステップ 2![]() ゾーンのメイン メニューで、 Diagnostics > Counters > Zone Counters を選択します。ゾーンの Counters 画面が表示されます。
ゾーンのメイン メニューで、 Diagnostics > Counters > Zone Counters を選択します。ゾーンの Counters 画面が表示されます。
ステップ 3![]() (オプション)グラフに表示する期間を変更します。Graph Period ドロップダウン リストで期間を選択し、 Update Graph をクリックします。Detector モジュールにより、グラフがアップデートされます。
(オプション)グラフに表示する期間を変更します。Graph Period ドロップダウン リストで期間を選択し、 Update Graph をクリックします。Detector モジュールにより、グラフがアップデートされます。
デフォルトでは、トラフィック レートのグラフには、最近 2 時間に記録したカウンタ情報が表示されます。
ステップ 4![]() (オプション)トラフィック レートのグラフで Detector モジュールが使用する測定単位を変更するには、Graph Type ドロップダウン リストで測定単位を選択します。
(オプション)トラフィック レートのグラフで Detector モジュールが使用する測定単位を変更するには、Graph Type ドロップダウン リストで測定単位を選択します。
ステップ 5![]() Update Graph をクリックします。Detector モジュールにより、グラフがアップデートされます。
Update Graph をクリックします。Detector モジュールにより、グラフがアップデートされます。
ステップ 6![]() (オプション)Detector モジュールのカウンタをクリアするには、 Clear Counters をクリックします。Detector モジュールが現在のカウンタとトラフィック レートをクリアします。カウンタにテスト セッションの情報だけが含まれるようにテストを実行する場合は、ゾーンのカウンタをクリアできます。
(オプション)Detector モジュールのカウンタをクリアするには、 Clear Counters をクリックします。Detector モジュールが現在のカウンタとトラフィック レートをクリアします。カウンタにテスト セッションの情報だけが含まれるようにテストを実行する場合は、ゾーンのカウンタをクリアできます。
Zone Current Counters/Rates テーブルには、次の情報が表示されます。
•![]() Packets:Detector モジュールが最後にリロードされた後に、ゾーンが宛先として指定されたパケットの総数。
Packets:Detector モジュールが最後にリロードされた後に、ゾーンが宛先として指定されたパケットの総数。
•![]() Bits:Detector モジュールが最後にリロードされた後に、ゾーンが宛先として指定されたビットの総数。
Bits:Detector モジュールが最後にリロードされた後に、ゾーンが宛先として指定されたビットの総数。
•![]() pps:ゾーンが宛先となっているトラフィックの現在のレート(パケット/秒単位)。
pps:ゾーンが宛先となっているトラフィックの現在のレート(パケット/秒単位)。
•![]() bps:ゾーンが宛先となっているトラフィックの現在のレート(ビット/秒単位)。
bps:ゾーンが宛先となっているトラフィックの現在のレート(ビット/秒単位)。
トラフィック レートのグラフの下には、カウンタを識別するための凡例が表示されます。また、選択した期間における各カウンタの最小レート、最大レート、および平均レートが表示されます。
トラフィック フローを分析するためのゾーンのカウンタの使用
トラフィックがアクティブなゾーンに適切に送信されているかどうかを判断するには、トラフィック フローの分析が重要です。次の情報では、トラフィック フローの分析方法、発生する可能性のある問題の認識方法、およびその解決策について説明しています。
•![]() 受信パケットの数が 0 より大きい場合は、トラフィック フローがゾーンに適切に送信されていることを示します。
受信パケットの数が 0 より大きい場合は、トラフィック フローがゾーンに適切に送信されていることを示します。
•![]() 受信パケットの数が 0 の場合は、次の状況のいずれかに該当している可能性があります。
受信パケットの数が 0 の場合は、次の状況のいずれかに該当している可能性があります。
–![]() Detector モジュールまたは他のゾーンで受信したパケットの現在のレート(pps または bps)も 0 の場合は、トラフィックのキャプチャの設定に問題があるか、1 つまたは複数のゾーンが宛先となっているトラフィックが Detector モジュールがインストールされたスイッチまたはルータに到達する前にブロックされている可能性があります。
Detector モジュールまたは他のゾーンで受信したパケットの現在のレート(pps または bps)も 0 の場合は、トラフィックのキャプチャの設定に問題があるか、1 つまたは複数のゾーンが宛先となっているトラフィックが Detector モジュールがインストールされたスイッチまたはルータに到達する前にブロックされている可能性があります。
–![]() Detector モジュールまたは他のゾーンで受信したパケットの現在のレート(pps または bps)が 0 より大きい場合は、ゾーンにバイパス フィルタが定義されていないことを確認してください。
Detector モジュールまたは他のゾーンで受信したパケットの現在のレート(pps または bps)が 0 より大きい場合は、ゾーンにバイパス フィルタが定義されていないことを確認してください。
ゾーンのカウンタのクリア
カウンタにテスト セッションの情報だけが含まれるようにテストを実行する場合は、ゾーンのカウンタをクリアできます。
ステップ 1![]() ナビゲーション ペインでゾーンを選択します。ゾーンのメイン メニューが表示されます。
ナビゲーション ペインでゾーンを選択します。ゾーンのメイン メニューが表示されます。
ステップ 2![]() ゾーンのメイン メニューで、 Diagnostics > Counters > Zone Counters を選択します。ゾーンの Counters 画面が表示されます。
ゾーンのメイン メニューで、 Diagnostics > Counters > Zone Counters を選択します。ゾーンの Counters 画面が表示されます。
ステップ 3![]() Clear Counters をクリックします。Detector モジュールが現在のゾーンのカウンタとトラフィック レートをクリアします。
Clear Counters をクリックします。Detector モジュールが現在のゾーンのカウンタとトラフィック レートをクリアします。
ゾーンのカウンタのリアルタイムでの表示
Detector モジュールでは、ゾーンのカウンタ情報をリアルタイムで表示できます。
(注) カウンタ情報をリアルタイムに表示するには、クライアントに JRE をインストールしておく必要があります(第1章「製品の概要」の「Java 2 Runtime Environment のインストール」の項を参照)。
ゾーンのカウンタ情報をリアルタイムに表示するには、次の手順を実行します。
ステップ 1![]() ナビゲーション ペインでゾーンを選択します。ゾーンのメイン メニューが表示されます。
ナビゲーション ペインでゾーンを選択します。ゾーンのメイン メニューが表示されます。
ステップ 2![]() ゾーンのメイン メニューで、 Diagnostics > Counters > Real Time Counters を選択します。ゾーンの Real time counters/Rates 画面が表示されます。
ゾーンのメイン メニューで、 Diagnostics > Counters > Real Time Counters を選択します。ゾーンの Real time counters/Rates 画面が表示されます。
ステップ 3![]() (オプション)トラフィック レートのグラフで Detector モジュールが使用する測定単位を変更するには、次のいずれかの Graph Type オプションを選択します。
(オプション)トラフィック レートのグラフで Detector モジュールが使用する測定単位を変更するには、次のいずれかの Graph Type オプションを選択します。
Detector モジュールにより、トラフィック レートのグラフがアップデートされます。
ゾーン トラフィックを分析するためのカウンタ情報の使用については、「トラフィック フローを分析するためのゾーンのカウンタの使用」の項を参照してください。
ゾーンのイベント ログの表示
Detector モジュールは、システム アクティビティとイベントを自動的に記録します。Detector モジュールのログを表示して、Detector モジュールのアクティビティを確認および追跡できます。
ゾーンのイベント ログの内容を表示するには、次の手順を実行します。
ステップ 1![]() ナビゲーション ペインでゾーンを選択します。ゾーンのメイン メニューが表示されます。
ナビゲーション ペインでゾーンを選択します。ゾーンのメイン メニューが表示されます。
ステップ 2![]() ゾーンのメイン メニューで、 Diagnostics > Event log を選択します。ゾーンの Events 画面が表示されます。
ゾーンのメイン メニューで、 Diagnostics > Event log を選択します。ゾーンの Events 画面が表示されます。
ステップ 3![]() (オプション)次のオプションのいずれかを選択し、イベント テーブルに表示するイベントを制御します。
(オプション)次のオプションのいずれかを選択し、イベント テーブルに表示するイベントを制御します。
•![]() Show all Events :各重大度レベルのイベントを表示します(使用可能なイベントのレベルのリストは 表10-4 を参照)。
Show all Events :各重大度レベルのイベントを表示します(使用可能なイベントのレベルのリストは 表10-4 を参照)。
•![]() Show events with severity level :選択した重大度レベルのイベントだけを表示します。
Show events with severity level :選択した重大度レベルのイベントだけを表示します。
ステップ 4![]() Filter Events をクリックします。Detector モジュールにより、イベント テーブルがアップデートされます。
Filter Events をクリックします。Detector モジュールにより、イベント テーブルがアップデートされます。
攻撃の要約レポートの表示
Detector モジュールでは、ゾーンで Detector モジュールが検出した攻撃を分析できるようにするために、ゾーンごとの高レベルな要約レポートを提供しています。このレポートは、ユーザが定義した期間中にゾーンが受けた DDoS 攻撃を要約したものです。Detector モジュールは、攻撃の進行中に情報を記録し、そのデータをカテゴリ別に編成します。このレポートには、攻撃の総数および強さに関する詳細、および各攻撃の簡単な要約が示されます。Detector モジュールは、攻撃のデータをグラフ形式でも表示します。
ゾーン攻撃の要約レポートを表示するには、次の手順を実行します。
ステップ 1![]() ナビゲーション ペインでゾーンを選択します。ゾーンのメイン メニューが表示されます。
ナビゲーション ペインでゾーンを選択します。ゾーンのメイン メニューが表示されます。
ステップ 2![]() ゾーンのメイン メニューで、 Diagnostics > Attack Reports > Attack Summary を選択します。Attacks Summary 画面が表示されます。デフォルトでは、レポートに先月分の攻撃情報が表示されます。
ゾーンのメイン メニューで、 Diagnostics > Attack Reports > Attack Summary を選択します。Attacks Summary 画面が表示されます。デフォルトでは、レポートに先月分の攻撃情報が表示されます。
ステップ 3![]() (オプション)攻撃レポートの期間を変更します。表示する期間の日付を Period from および to に入力し、 Get Reports をクリックします。日付は手動で入力することも、各フィールドの右側にあるカレンダー アイコンをクリックし、カレンダー ポップアップ ウィンドウから選択することもできます。
(オプション)攻撃レポートの期間を変更します。表示する期間の日付を Period from および to に入力し、 Get Reports をクリックします。日付は手動で入力することも、各フィールドの右側にあるカレンダー アイコンをクリックし、カレンダー ポップアップ ウィンドウから選択することもできます。
Attack Summary Report 画面は、次の領域で構成されています。
•![]() 検出のグラフ:ユーザが定義した期間中に発生した攻撃の要約がグラフ形式で提示されます。
検出のグラフ:ユーザが定義した期間中に発生した攻撃の要約がグラフ形式で提示されます。
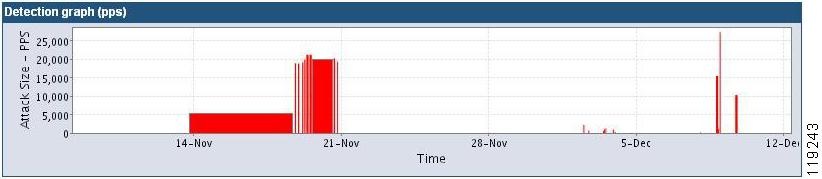
X 軸は、攻撃が発生した期間を表示しています。Y 軸は、平均の攻撃レートをパケット/秒(pps)単位で表示しています。各攻撃は 1 つのバーで表されています。マウス カーソルをいずれかの攻撃バーの上に数秒間置いておくと、平均の攻撃レートが表示されます。
攻撃の詳細を表示するには、グラフで攻撃バーをクリックし、攻撃レポートを開きます(「攻撃レポートの詳細の表示」の項を参照)。
•![]() 攻撃に関する統計情報のテーブル:ゾーンに対する攻撃の数、およびユーザが定義した期間中に発生した攻撃の集計情報が示されます。
攻撃に関する統計情報のテーブル:ゾーンに対する攻撃の数、およびユーザが定義した期間中に発生した攻撃の集計情報が示されます。
表10-7 に、攻撃に関する統計情報のテーブルに含まれるフィールドの説明を示します。
|
|
|
|---|---|
•![]() 攻撃ごとの要約テーブル:定義した期間中にゾーンが受けた DDoS 攻撃のリストがテーブルで示されます。攻撃ごとの要約テーブルに現在表示されている情報を削除(「攻撃レポートの削除」の項を参照)、または攻撃レポートの内容をエクスポート(「攻撃レポートのエクスポート」の項を参照)できます。
攻撃ごとの要約テーブル:定義した期間中にゾーンが受けた DDoS 攻撃のリストがテーブルで示されます。攻撃ごとの要約テーブルに現在表示されている情報を削除(「攻撃レポートの削除」の項を参照)、または攻撃レポートの内容をエクスポート(「攻撃レポートのエクスポート」の項を参照)できます。
表10-8 に、攻撃ごとの要約テーブルのカラムに含まれるフィールドの説明を示します。
(注) 攻撃の詳細を表示するには、攻撃ごとの要約テーブルのいずれかの行をクリックします(「攻撃レポートの詳細の表示」の項を参照)。
攻撃レポートの詳細の表示
Detector モジュールでは、Attacks Summary 画面に一覧表示される攻撃レポートの詳細を表示できます。攻撃レポートには、最初の動的フィルタが作成された時点からユーザによる指示があるまで、または新しい動的フィルタが追加されないように定義された期間が終了するまでの、攻撃の詳細が示されています。
Detector モジュールは、攻撃の進行中に情報を記録し、そのデータをカテゴリ別に編成します。過去および現在の攻撃の詳細を表示できます。
ステップ 1![]() ナビゲーション ペインでゾーンを選択します。ゾーンのメイン メニューが表示されます。
ナビゲーション ペインでゾーンを選択します。ゾーンのメイン メニューが表示されます。
ステップ 2![]() ゾーンのメイン メニューで、 Diagnostics > Attack Reports > Attack Summary を選択します。Attacks Summary 画面が表示されます。
ゾーンのメイン メニューで、 Diagnostics > Attack Reports > Attack Summary を選択します。Attacks Summary 画面が表示されます。
ステップ 3![]() (オプション)攻撃レポートの期間を変更するには、表示する期間の日付を Period from および to に入力し、 Get Reports をクリックします。日付は手動で入力することも、各フィールドの右側にあるカレンダー アイコンをクリックし、カレンダー ポップアップ ウィンドウから選択することもできます。
(オプション)攻撃レポートの期間を変更するには、表示する期間の日付を Period from および to に入力し、 Get Reports をクリックします。日付は手動で入力することも、各フィールドの右側にあるカレンダー アイコンをクリックし、カレンダー ポップアップ ウィンドウから選択することもできます。
ステップ 4![]() 検出グラフで攻撃バーをクリックします。Attack Report 画面が表示されます。
検出グラフで攻撃バーをクリックします。Attack Report 画面が表示されます。
攻撃ごとの要約テーブルに含まれている、攻撃のいずれかのフィールドもクリックできます。
Detector モジュールは、進行中の攻撃の識別番号(#)に Curr という値を表示します。
ゾーンへの攻撃が進行中である場合、Detector モジュールでは、攻撃を受けているゾーンのステータス画面に、Report ボタンが表示されます。 Report ボタンをクリックすると、Detector モジュールが現在の攻撃に関して収集している情報が表示されます。
攻撃レポートの詳細について
攻撃レポートには、次のセクションにまとめられたデータ フィールドとデータ テーブルがあります。
•![]() 一般的な攻撃情報
一般的な攻撃情報
•![]() 検出された異常
検出された異常
一般的な攻撃情報
攻撃レポートの最初のセクションには、攻撃の日時に関する情報(攻撃の開始日時、終了日時、および持続期間を含む)が示されます。
レポートの詳細を表示するには、 i または Show details for all events をクリックします。
カウンタは、レートを除いてすべて整数値です。画面の一般的な攻撃情報領域から、統計情報の測定単位を選択することができます。
ステップ 1![]() Statistics units ドロップダウン リストから、使用する目的の単位を選択します。
Statistics units ドロップダウン リストから、使用する目的の単位を選択します。
ステップ 2![]() Set units をクリックします。Detector モジュールにより、表示がアップデートされます。
Set units をクリックします。Detector モジュールにより、表示がアップデートされます。
攻撃に関する統計情報
攻撃に関する統計情報には、受信したパケットに関する情報が示されます。
表10-9 に、攻撃に関する統計情報について提供される情報の説明を示します。
|
|
|
|---|---|
トラフィック レートは、一般的な攻撃領域のドロップダウン リストで選択した単位で表示されます(「一般的な攻撃情報」の項を参照)。
検出された異常
検出された異常のテーブルには、Detector モジュールがゾーンのトラフィックで検出した異常の詳細が示されます。動的フィルタの生成が必要となった場合、Detector モジュールはトラフィックを異常があるものと分類します。このような異常はあまり発生しないか、または体系的な DDoS 攻撃となる可能性があります。Detector モジュールでは、タイプとフロー パラメータ(送信元 IP アドレスまたは宛先ポートなど)が同じトラフィック異常を 1 つのトラフィック異常タイプとしてまとめます。
表10-10 に、それぞれの異常について、提供される情報の説明を示します。
|
|
|
|---|---|
| • • • • • • • • • • • |
|
異常なトラフィック フロー。このフローに共通する特性のパラメータが表示されます。この情報には、異常トラフィックのプロトコル番号、トラフィック フローの宛先 IP アドレス、フローのパケット タイプなどのパラメータが含まれています。 |
|
このフィルタに関する追加情報を表示できるかどうかを示します。 i をクリックすると、追加情報が表示されます(「検出された異常の詳細の表示」の項を参照)。 |
パラメータの値がアスタリスク(*)となっている場合は、ワイルドカードとして使用されており、次のいずれかの状態であることを示します。
検出された異常の詳細の表示
検出された異常の詳細のテーブルには、検出された異常に関連する動的フィルタについての追加情報が示されます。
検出された異常の詳細のテーブルを表示するには、検出された異常のテーブルで、トラフィック異常の Details カラムにある i をクリックします。
表10-11 に、Detector モジュールが提供する異常の詳細情報の説明を示します。
攻撃レポートのエクスポート
攻撃レポートをネットワーク サーバにエクスポートするには、次の手順を実行します。
ステップ 1![]() ナビゲーション ペインでゾーンを選択します。ゾーンのメイン メニューが表示されます。
ナビゲーション ペインでゾーンを選択します。ゾーンのメイン メニューが表示されます。
ステップ 2![]() ゾーンのメイン メニューの Diagnostics > Attack Reports > Attack Summary を選択します。Attacks Summary 画面が表示されます。
ゾーンのメイン メニューの Diagnostics > Attack Reports > Attack Summary を選択します。Attacks Summary 画面が表示されます。
ステップ 3![]() (オプション)攻撃レポートの期間を変更するには、 Period from および to に日付を入力し、 Get Reports をクリックします。日付は手動で入力することも、各フィールドの右側にあるカレンダー アイコンをクリックして選択することもできます。
(オプション)攻撃レポートの期間を変更するには、 Period from および to に日付を入力し、 Get Reports をクリックします。日付は手動で入力することも、各フィールドの右側にあるカレンダー アイコンをクリックして選択することもできます。
ステップ 4![]() 攻撃ごとの要約テーブルで、エクスポートする攻撃レポートの隣にあるチェックボックスをオンにします。テーブルに表示されているレポートをすべて選択するには、番号記号(#)の隣にあるテーブルのヘッダーのチェックボックスをオンにします。
攻撃ごとの要約テーブルで、エクスポートする攻撃レポートの隣にあるチェックボックスをオンにします。テーブルに表示されているレポートをすべて選択するには、番号記号(#)の隣にあるテーブルのヘッダーのチェックボックスをオンにします。
ステップ 5![]() Export をクリックします。Export File Server Parameters ウィンドウが表示されます。
Export をクリックします。Export File Server Parameters ウィンドウが表示されます。
ステップ 6![]() Select File Server Parameters フォームで、次のいずれかのオプションから使用するネットワーク サーバを選択して定義します。
Select File Server Parameters フォームで、次のいずれかのオプションから使用するネットワーク サーバを選択して定義します。
•![]() Use automatic export file server definitions :CLI コマンド export reports を使用して、Detector モジュールの設定で定義したネットワーク サーバに攻撃レポートをエクスポートします。
Use automatic export file server definitions :CLI コマンド export reports を使用して、Detector モジュールの設定で定義したネットワーク サーバに攻撃レポートをエクスポートします。
•![]() Use the following server definition :定義したネットワーク サーバに攻撃レポートをエクスポートします。ネットワーク サーバに関する次の情報を入力します。
Use the following server definition :定義したネットワーク サーバに攻撃レポートをエクスポートします。ネットワーク サーバに関する次の情報を入力します。
–![]() Transfer method :Detector モジュールは、攻撃レポートのエクスポートでのみ File Transfer Protocol(FTP; ファイル転送プロトコル)方式をサポートします。
Transfer method :Detector モジュールは、攻撃レポートのエクスポートでのみ File Transfer Protocol(FTP; ファイル転送プロトコル)方式をサポートします。
–![]() Address :ネットワーク サーバの IP アドレス。
Address :ネットワーク サーバの IP アドレス。
–![]() Path :完全パス名。パスを指定しない場合、サーバはユーザのホーム ディレクトリに 1 つ以上のファイルを保存します。
Path :完全パス名。パスを指定しない場合、サーバはユーザのホーム ディレクトリに 1 つ以上のファイルを保存します。
–![]() Username :ネットワーク サーバのログイン名。サーバのログイン名。FTP サーバを定義する場合、username 引数はオプションです。ログイン名を入力しない場合、FTP サーバは匿名ログインであると想定し、パスワードを要求しません。
Username :ネットワーク サーバのログイン名。サーバのログイン名。FTP サーバを定義する場合、username 引数はオプションです。ログイン名を入力しない場合、FTP サーバは匿名ログインであると想定し、パスワードを要求しません。
–![]() Password :(オプション)リモート FTP サーバのパスワード。ユーザ名を入力してパスワードを入力しなかった場合、パスワードを入力するように Detector モジュールから求められます。
Password :(オプション)リモート FTP サーバのパスワード。ユーザ名を入力してパスワードを入力しなかった場合、パスワードを入力するように Detector モジュールから求められます。
ステップ 7![]() OK をクリックして、攻撃レポートをネットワーク サーバにエクスポートします。
OK をクリックして、攻撃レポートをネットワーク サーバにエクスポートします。
攻撃レポートの削除
ステップ 1![]() ナビゲーション ペインでゾーンを選択します。ゾーンのメイン メニューが表示されます。
ナビゲーション ペインでゾーンを選択します。ゾーンのメイン メニューが表示されます。
ステップ 2![]() ゾーンのメイン メニューの Diagnostics > Attack Reports > Attack Summary を選択します。Attacks Summary 画面が表示されます。
ゾーンのメイン メニューの Diagnostics > Attack Reports > Attack Summary を選択します。Attacks Summary 画面が表示されます。
ステップ 3![]() (オプション)攻撃レポートの期間を変更するには、 Period from および to に日付を入力し、 Get Reports をクリックします。日付は手動で入力することも、各フィールドの右側にあるカレンダー アイコンをクリックして選択することもできます。
(オプション)攻撃レポートの期間を変更するには、 Period from および to に日付を入力し、 Get Reports をクリックします。日付は手動で入力することも、各フィールドの右側にあるカレンダー アイコンをクリックして選択することもできます。
ステップ 4![]() 攻撃ごとの要約テーブルで、削除する攻撃レポートの隣にあるチェックボックスをオンにします。テーブルに表示されているレポートをすべて選択するには、番号記号(#)の隣にあるテーブルのヘッダーのチェックボックスをオンにします。
攻撃ごとの要約テーブルで、削除する攻撃レポートの隣にあるチェックボックスをオンにします。テーブルに表示されているレポートをすべて選択するには、番号記号(#)の隣にあるテーブルのヘッダーのチェックボックスをオンにします。
ステップ 5![]() Delete をクリックします。Detector モジュールが攻撃レポートを削除します。
Delete をクリックします。Detector モジュールが攻撃レポートを削除します。
ポリシーの統計情報のテーブルの表示
ポリシーの統計情報のテーブルを使用すると、特定のゾーンの各ポリシーを通過するトラフィック フローのレートを表示できます。このテーブルを使用して、正当なトラフィックのみがゾーンに送信されているかどうかを判断して、しきい値を手動で調整できます。
ポリシーの統計情報のテーブルを表示するには、次の手順を実行します。
ステップ 1![]() ナビゲーション ペインでゾーンを選択します。ゾーンのメイン メニューが表示されます。
ナビゲーション ペインでゾーンを選択します。ゾーンのメイン メニューが表示されます。
ステップ 2![]() ゾーンのメイン メニューで Diagnostics > Statistics > Policy Statistics を選択します。Policies Statistics 画面が表示されます。
ゾーンのメイン メニューで Diagnostics > Statistics > Policy Statistics を選択します。Policies Statistics 画面が表示されます。
ステップ 3![]() (オプション)表示する情報を次の手順でフィルタリングします。
(オプション)表示する情報を次の手順でフィルタリングします。
a.![]() Set Screen Filter をクリックします。Policy Filter ウィンドウが表示されます。
Set Screen Filter をクリックします。Policy Filter ウィンドウが表示されます。
b.![]() Policy Filter ウィンドウのドロップダウン リストから、パラメータの値を選択します。
Policy Filter ウィンドウのドロップダウン リストから、パラメータの値を選択します。
c.![]() OK をクリックします。Policy statistics 画面がアップデートされ、選択したパラメータだけが表示されます。選択したパス、およびポリシーごとの最大キーの詳細が Screen Filter フレームに表示されます。
OK をクリックします。Policy statistics 画面がアップデートされ、選択したパラメータだけが表示されます。選択したパス、およびポリシーごとの最大キーの詳細が Screen Filter フレームに表示されます。
ポリシーの統計情報のテーブルでは、4 つのセクションに情報が表示されます。各セクションの情報は値に基づいてソートされ、最も大きい値が最上部に表示されます。
•![]() Rate:ポリシーを通過するトラフィック フローのレート。
Rate:ポリシーを通過するトラフィック フローのレート。
•![]() Ratio:SYN フラグ付きパケット数と FIN/RST フラグ付きパケット数の比率。この情報は、syn_by_fin ポリシーについてのみ表示されます。
Ratio:SYN フラグ付きパケット数と FIN/RST フラグ付きパケット数の比率。この情報は、syn_by_fin ポリシーについてのみ表示されます。
•![]() Connections:同時接続または送信元 IP アドレスの数。この情報は、tcp_connections ポリシーおよび in_nodata_conns について表示されます。
Connections:同時接続または送信元 IP アドレスの数。この情報は、tcp_connections ポリシーおよび in_nodata_conns について表示されます。
•![]() Dst IPs:スキャンされたゾーン宛先 IP アドレスの数。この情報は、worm_tcp ポリシーについて表示されます。
Dst IPs:スキャンされたゾーン宛先 IP アドレスの数。この情報は、worm_tcp ポリシーについて表示されます。
表示された情報の管理を容易にするには、画面フィルタを設定して、利用可能な統計情報のリストの一部のみを表示するようにします。
(注) いずれかの表示パラメータを変更すると、Detector モジュールは、変更したパラメータの下に表示されているパラメータをすべて自動的に消去します。消去されたパラメータに対して新しい値を入力する必要があります。
表10-12 に、ポリシーの統計情報に含まれるフィールドの説明を示します。
 フィードバック