Prometheus and
Grafana
Introduction
CPS system, application statistics and Key Performance Indicators (KPI) are collected by the system and are displayed using a browser-based graphical metrics tool. This chapter provides a high-level overview of the tools CPS uses to collect and display these statistics.
Prometheus
Prometheus is an application that is used to actively gather statistics and trigger alerts from the running virtual machines and application services. The CPS vDRA cluster deploys the following Prometheus services on each control node and on the master node:
-
Prometheus Hi-Res – this instance of the Prometheus service is monitoring the system at 5 second intervals with 24-hour history
-
Prometheus Trending – this instance of the Prometheus service is monitoring the system at 20 second intervals with 30-day history
-
Prometheus Planning – this instance of the Prometheus service is monitoring the system at 120 second intervals with 365-day history
In addition to scrapping, statistics in the Prometheus servers can be configured using the Management CLI alert rule command to trigger alerts on error conditions. In this scenario, a user defines the alert rule and the configuration for that rule is pushed into the Prometheus servers. It can generate SNMPv2 and SNMPv3 alarm based on the NMS destination configured in the system. You can configure multiple SNMP destination (SNMPv2, SNMPv3) to receive the alarms at multiple NMS.
 Note | Currently, SNMP get and walk facility is not supported. |
For more information on Prometheus, refer https://prometheus.io/.
Grafana
Grafana is a third-party metrics dashboard and graph editor provided with CPS 7.0 and higher. Grafana provides a graphical or text-based representation of statistics and counters collected in the Prometheus database.
Additional Grafana Documentation
This chapter provides information about the CPS implementation of Grafana. For more information about Grafana, or access the general Grafana documentation, refer to: http://docs.grafana.org.
Data Source Supported
The CPS implementation uses the Prometheus data source and does not use graphite for queries. This requires the definition of queries to use the Prometheus query format as defined in https://prometheus.io/docs/querying/basics/.
Note | If the control VM that hosts Grafana goes down, then the Prometheus data also not available during that downtime after the same control VM (hosting Grafana) is back. This results in some missing data. As a workaround, you can add the Prometheus datasource of other control VM in Grafana UI that was up during that downtime and view the missing statistics. |
Manage Grafana Users
Note | In Grafana, admin users can invite new users by email or a link. However, this is not supported in CPS vDRA. |
-
Enter config mode
scheduler# config
Entering configuration mode terminal
scheduler(config)#
-
Enter the aaa authentication command to create the user:
scheduler(config)# aaa authentication users user test2 gid 100 uid 9000 homedir / password testpassword ssh_keydir /
scheduler(config-user-test2)# commit
scheduler(config-user-test2)# exit
Note
The gid, uid, homedir and ssh_keydir are required but not used by the application.
Add User To A Viewer Operational Group
In config mode, add the user to the “oper” group and commit as follows:
scheduler(config)# nacm groups group oper user-name test2
scheduler(config-group-oper)# commit
Add User To A Grafana Editor Group
In config mode, add the user to the “grafana-editor” group and commit as follows:
scheduler(config)# nacm groups group grafana-editor user-name test2
scheduler(config-group-grafana-editor)# commit
Add User To A Grafana Admin Group
In config mode, add the user to the “grafana-admin” group and commit as follows:
scheduler(config)# nacm groups group grafana-admin user-name test2
scheduler(config-group-grafana-admin)# commit
Change A Grafana Users Password
In the Management CLI, issue the aaa authentication users user change-password command as follows:
scheduler# aaa authentication users user test2 change-password
Value for 'old-password' (<string>): ************
Value for 'new-password' (<string>): ********
Value for 'confirm-password' (<string>): ********
scheduler#
System message at 2017-03-08 21:17:18...
Commit performed by system via system using system.
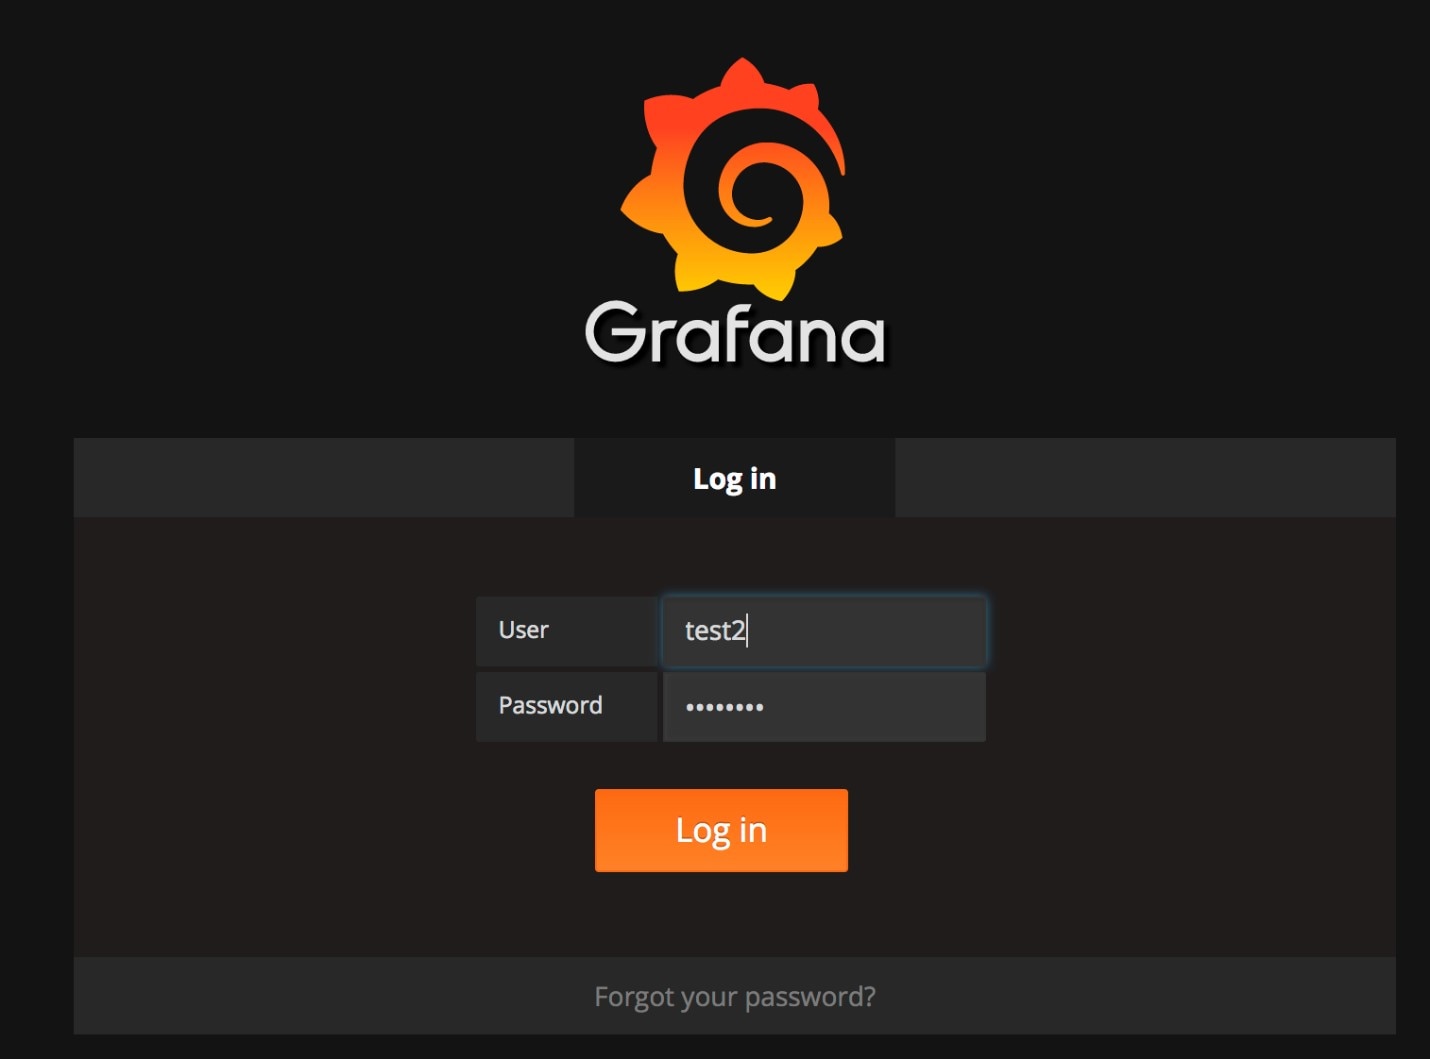
Connect to Grafana
Use the following URL to access Grafana and enter the user name and password:
https://<masterip>/grafana/
Grafana Roles
The following types of user roles are supported:
 Feedback