Session Tracing

This chapter provides information on subscriber session trace functionality that allows an operator to trace subscriber activity at various points in the network and at various level of detail. Subscriber session tracing is supported on the following UMTS/EPC GW network elements:

  • GGSN
  • P-GW
  • SAEGW
  • S-GW

Important

For detailed information for session tracing on the MME, refer to the MME Administration Guide.


The product Administration Guides provide examples and procedures for configuration of basic services on the system. It is recommended that you select the configuration example that best meets your service model, and configure the required elements for that model, as described in the respective product Administration Guide, before using the procedures in this chapter.

This chapter includes a feature description, configuration procedures, monitoring commands, and a session tracing file example.

Session Tracing Overview

Session Trace capability enables an operator to trace subscriber activity at various points in the network and at various levels of detail. The trace can be subscriber initiated (that is, signaling based) or management initiated from the CLI (Command Line Interface) and can be propagated throughout the access cloud via the various signaling interfaces available to the UMTS/EPC network element.

Essentially, the Session Trace capability records and forwards all control activity for the monitored subscriber on the monitored interfaces. This is typically all the signaling and authentication/subscriber services messages that flow when a User Equipment (UE) connects to the access network.

All monitored activity is sent to an off-line Trace Collection Entity (TCE) using a standards-based XML format over a File Transfer Protocol (FTP) or secure FTP (sFTP) connection.


Important

Session tracing is a resource intensive application in terms of CPU utilization and will affect call rates and data throughput when in use. The use of this feature in a production network should be restricted to minimize the impact on existing services.


Important

For 19.2 and prior StarOS releases, both the FTP and SFTP options are available. In release 20.0 and higher trusted StarOS builds only the SFTP option is supported; FTP is not supported for the Session Trace function in release 20.0 and higher trusted StarOS builds.


As can be seen in the following illustration, of the three Network Elements (NEs) shown, one NE is actively tracing data on one or more interfaces. All data collected is stored as files in an XML format and then transferred to the collection entity using (S)FTP or FTP. Note that IPv4 or IPv6 connectivity is required between the NE and the TCE in order to transfer the files.
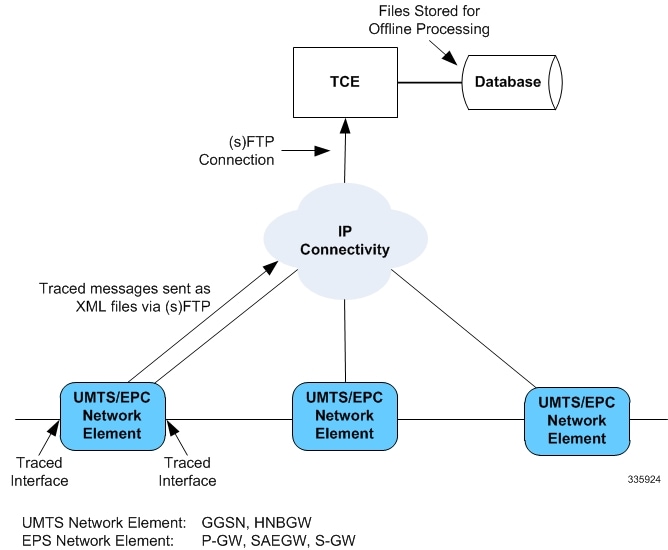
Figure 1. Session Tracing Architecture


Session Trace Types

There are three types of session trace functions available.

  • Management Trace: The operator sends an activation request via the CLI directly to the UMTS/EPC network element where the trace is to be initiated. The network element establishes the trace session and waits for a configured trigger event to start actively tracing. When management-initiated trace activations are executed at the network element, they are never propagated to other NEs whether or not it is involved in the actual recording of the call.
  • Random Trace: Enables or disables the subscriber session trace functionality based on a the random trace on the UMTS/EPC network element. The trace control and configuration parameters are configured directly in the specified network element through the random trace CLI command. There is no propagation of trace parameters in random based trace activation. This NE shall not propagate the received data to any other NEs whether or not it is involved in the actual recording of the call. If enabled, the subscriber selection will be based on random logic all instances of session on the specified UMTS/EPC network element.
  • Signaling Trace: With a signaling based activation, the trace session is indicated to the UMTS/EPC network element across a signaling interface via a trace invocation message. This message can either be piggybacked with an existing bearer setup message (in order to trace all control messages) or by sending a separate trace invocation message (if the user is already active). Signaling based activations are always propagated to neighboring NEs even if the current NE does not participate in the trace (either they not enabled by configuration or not present in the configured trace parameters).

Important

Note that the maximum number of unique International Mobile Subscriber Identification (IMSI) numbers or International Mobile Equipment Identification (IMEI) numbers cannot exceed 32; however, each NE can trace all 32 unique IMSI/IMEIs.

Caution

Session tracing is a resource intensive application in terms of CPU utilization and will affect call rates and data throughput when in use. The use of this feature in a production network should be restricted to minimize the impact on existing services.


Session Trace Activation

Activation of a trace is similar whether it be via the management interface or via a signaling interface. In both cases, a trace session state block is allocated which stores all configuration and state information for the trace session. In addition, an (S)FTP connection to the Trace Collection Entity (TCE) is established if one does not already exist. The NE will store up to 2 MB of XML data on its local disk to allow for the (S)FTP connection to be established and the files to be pushed to or pulled from the TCE.

If the session to be traced is already active, tracing may begin immediately. Otherwise, tracing activity waits until the start trigger occurs (typically when the subscriber/UE under trace initiates a connection). A failure to activate a trace (due to the maximum being exceeded or some other failure reason) results in a notification being sent to the TCE indicating the failure.

Session Trace Deactivation

Deactivation of a Trace Session is similar whether it was management or signaling activated. In either case, a deactivation request is received by the NE that contains valid trace reference results in the de-allocation of the trace session state block and a flushing of any pending trace data. In addition, if this is the last trace session to a particular TCE, the (S)FTP connection to the TCE is released after the last trace file is successfully transferred to the TCE.

Data Collection

Data collection is done inline by each of the NEs. In order to reduce the overhead on a per-control packet basis, a copy of the entire packet is made and stored into an internal database (DB) of packets.

The local internal path for the trace database is /hd-raid/trace.

This storage is done regardless of the trace depth. After xx bytes (or xx messages) have been stored or a configurable number of seconds have elapsed, all cached data is encoded in the standard XML format and written out to a file to be forwarded to/pulled from the TCE. If there is no TCE active, the UMTS/EPC network element will continue to cache data and create trace files as long as there is space available before stopping the trace recording session. Once the connection to the TCE becomes active, all cached data will be sent immediately to the TCE.

Data Forwarding

When a session is activated, the IP address of the TCE is supplied in the session activation request. Upon activation and if the push mode is used, a check is made to see if there is already an (S)FTP connection to the TCE. If so, it is used for all traffic associated with this trace session. If not, an (S)FTP connection is made to the TCE using the supplied IP address. Data is buffered locally and trace files generated until the connection is established. Once the connection is established, all previously created trace files are sent to the TCE. Note that the (S)FTP connection is established to the TCE at session activation regardless of whether or not a trace recording session has been triggered. The (S)FTP connection is maintained until the trace session is deactivated.

Note the following:

  • If a default TCE IP Address is supplied when the trace capability is configured, a default (S)FTP connection is made to the remote TCE.
  • The TCE can be reachable either via IPv4 or IPv6 addressing. The supplied TCE address indicates the version.
  • If the push mode is not used, the files are stored on the local hard drive (/hd-raid/trace) and must be pulled off by the TCE using FTP or SFTP.

Supported Standards

Support for the following standards and requests for comments (RFCs) have been added for the Session Trace feature:

  • 3GPP TS 32.421 V8.5.0 (2009-06): 3rd Generation Partnership Project; Technical Specification Group Services and System Aspects; Telecommunication management; Subscriber and equipment trace: Trace concepts and requirements (Release 8)
  • 3GPP TS 32.422 V8.6.0 (2009-09): 3rd Generation Partnership Project; Technical Specification Group Services and System Aspects; Telecommunication management; Subscriber and equipment trace; Trace control and configuration management (Release 8)
  • 3GPP TS 32.423 V8.2.0 (2009-09): 3rd Generation Partnership Project; Technical Specification Group Services and System Aspects; Telecommunication management; Subscriber and equipment trace: Trace data definition and management (Release 8)
Configuring Session Trace Functionality

Configuring Session Trace on the UMTS/EPC network element consists of the following:

  1. Enabling Session Tracing
  2. Configuring a Session Trace Template for the Management Trace Function
  3. Configuring a Management Session Trace
  4. Configuring a Signaling Session Trace
  5. Configuring a Random Trace

The trace files can be stored locally, or pushed to a Trace Collection Entity (TCE) specified in the various trace commands.


Important

Not all combinations of Session Trace configuration types are allowed on the SAEGW. For details on the supported session trace configuration types, refer to Supported SAEGW Session Trace Configurations in this document.


Enabling Session Tracing

Session Tracing functionality must first be enabled before a specific management, random, or signaling session trace can be configured.

The following commands enable or disable the subscriber session trace functionality based on a specified subscriber device or ID on one or all instances of a session on a specified UMTS/EPC network element.

Use the following example to enable session tracing on the UMTS/EPC network element:

config  
   session trace network-element { all | ggsn | hnbgw | mme | pgw | saegw | sgw }  [  file-type  <a-type  |  b-type>  ]    tce-mode  none | push transport   ftp | sftp  username   username encrypted password  password  path   directory_path  collection timer   ctimer_value 
   end  

Notes:

  • session trace network-element : Enables Session Tracing functionality on the specified network element. To enable session tracing for all supported network elements, enter all .
  • file-type { a-type | b-type } : Specifies which type of XML file is generated by the session trace. Options include an A-type file and B-type file. When B-type XML files are used, multiple trace recording session elements will be encoded in a single XML file. Note that different trace recording sessions may be associated with different TCEs, according to the TCE IP address specified during activation. As expected, each Type-B XML file will contain traceRecSession elements that pertain only to the same target TCE. There will be different XML Type-B files created for different TCEs and they will be placed in different tce_x directories for transmission to the target TCEs. The default is a-type .
  • tce-mode : Specifies that trace files are stored locally and must be pulled by the TCE (none ) or trace files are pushed to the TCE (push ). The default is none .
  • transport : Specifies the method by which the trace files are pushed to the TCE (either ftp or sftp .) The default is sftp .
  • username : Must be specified if the tce-mode is push .
  • password : Must be specified if the tce-mode is push .
  • encrypted : Specifies that the password used to push files to the TCE server will be encrypted.
  • password : Specifies the password to use to push files to the TCE server. The user name can be from 1 to 31 alphanumeric characters.
  • collection-timer : Specifies the amount of time, in seconds, to wait from initial activation/data collection before data is reported to TCE. The default is 10 seconds.
  • retry-timer : Specifies the amount of time, in seconds, to wait before retrying a file transfer if the previous transfer failed. The default is 60 seconds.

Example:

session trace network-element saegw tce-mode push transport sftp path /SessionTrace username root encrypted password 5c4a38dc2ff61f72 collection-timer 5 

Verifying that Session Tracing is Enabled

Use the following example to verify that session tracing functionality is enabled on the UMTS/EPC network element:

show session trace statistics  

The output indicates for which NEs session tracing is enabled, and also indicates the configured trace type, where applicable. For example:

Network element status: 
      MME:      Enabled      Cell-Trace: Disabled
      S-GW:    Enabled
SAEGW Enabled  
            PGW:                    Trace-Type: None 
            SGW:                    Trace-Type: None 

Disabling Session Trace Functionality

Use the following example to disable session tracing functionality:

config  
      no session trace network-element { all | ggsn | hnbgw | mme | pgw | saegw | sgw }   
      end  

Configuring a Session Trace Template for the Management Trace Function

Operators must create a template for a management trace in Global Configuration Mode. Management traces executed in Exec mode will use the template. Once created, the template can be associated with different subscribers to trace the interfaces configured in the template.

Note that to activate subscriber session traces for specific IMSI/IMEI, the operator will use the Exec mode session trace subscriber command specifying a pre-configured template and the IMSI/IMEI, trace reference, and TCE address.

Use the following example to configure a template for use with the session trace subscriber command:

config  
   template-session-trace network-element { ggsn | hnbgw | mme | pgw | saegw | sgw } template-name  template_name 

Once this command is entered, the user is placed in Session Trace Template Configuration Mode. In this mode, the operator selects the interfaces to be traced for the selected network element.


Important

The options available in Session Trace Template Configuration Mode are dependent on the network element selected in the previous command.

For the GGSN, MME, P-GW and S-GW, enter the following command in Session Trace Template Configuration Mode:

      interface  interface_name 
      end  

For the SAEGW, enter the following command in Session Trace Template Configuration Mode:

      { func-pgw | func-sgw } interface  interface_name 
      end  
  • Notes: The available UMTS/EPC network elements provide various interface options for the session trace template.

GGSN

Available ggsn interfaces include:

  • all : Specifies that all available GGSN interfaces are to be traced.
  • gi : Specifies that the interface where the trace will be performed is the Gi interface between the GGSN and RADIUS server.
  • gmb : Specifies that the interface where the trace will be performed is the Gmb interface between the GGSN and BM-SC.
  • gn : Specifies that the interface where the trace will be performed is the Gn interface between the GGSN and the SGSN.
  • gx : Specifies that the interface where the trace will be performed is the Gx interface between the GGSN and PCRF.
  • gy : Specifies that the interface where the trace will be performed is the Gx interface between the GGSN and PCRF.

HNBGW

Available hnbgw interfaces are:

  • all : Specifies that all hnbgw interfaces are to be traced.
  • iucs : Specifies that the interface where the trace will be performed is the iucs interface between the HNB-GW and the Mobile Switching Center (3G MSC) in a 3G UMTS Femtocell Access Network.
  • iups : Specifies that the interface where the trace will be performed is the iups interface between the HNB-GW and the SGSN.

MME

Available mme interfaces include:

  • all : Specifies that all MME interfaces are to be traced.
  • s10 : Specifies that the interface where the trace will be performed is the S10 interface between the MME and another MME.
  • s11 : Specifies that the interface where the trace will be performed is the S11 interface between the MME and the S-GW.
  • s13 : Specifies that the interface where the trace will be performed is the S13 interface between the MME and the EIR.
  • s1mme : Specifies that the interface where the trace will be performed is the S1-MME interface between the MME and the eNodeB.
  • s3 : Specifies that the interface where the trace will be performed is the S3 interface between the MME and an SGSN.
  • s6a : Specifies that the interface where the trace will be performed is the S6a interface between the MME and the HSS.

P-GW

Available pgw interfaces are:

  • all : Specifies that all available P-GW interfaces are to be traced.
  • gx : Specifies that the interface where the trace will be performed is the Gx interface between the P-GW and the PCRF.
  • gy : Specifies that the interface where the trace will be performed is the Gy interface between the P-GW and OCS.
  • s2a : Specifies that the interface where the trace will be performed is the S2a interface between the P-GW and the HSGW.
  • s2b : Specifies that the interface where the trace will be performed is the S2b interface between the P-GW and an ePDG.
  • s2c : Specifies that the interface where the trace will be performed is the S2c interface between the P-GW and a trusted, non-3GPP access device.
  • s5 : Specifies that the interface where the trace will be performed is the S5 interface between an S-GW and P-GW located within the same administrative domain (non-roaming).
  • s6b : Specifies that the interface where the trace will be performed is the S6b interface between the P-GW and the 3GPP AAA server.
  • s8 : Specifies that the interface where the trace will be performed is the S8 interface -- an inter-PLMN reference point between the S-GW and the P-GW used during roaming scenarios.
  • sgi : Specifies that the interface where the trace will be performed is the SGi interface between the P-GW and the PDN.

SAEGW

The interfaces that can be traced on the SAEGW are broken down by the interfaces available on a P-GW configured under an SAEGW (func-pgw ), and the interfaces available on a S-GW configured under an SAEGW (func-sgw ).

  • Available func-pgw interface options are:
    • all : Specifies that all available func-pgw interfaces are to be traced.
    • gx : Specifies that the interface where the trace will be performed is the Gx interface between the P-GW and the PCRF.
    • gy : Specifies that the interface where the trace will be performed is the GTPP based online charging interface between P-GW and online charging system.
    • s2a : Specifies that the interface where the trace will be performed is the S2a interface between the PGW and the HSGW.
    • s2b : Specifies that the interface where the trace will be performed is the S2b interface between the PGW and an ePDG.
    • s2c : Specifies that the interface where the trace will be performed is the S2c interface between the PGW and a trusted, non-3GPP access device.
    • s5 : Specifies that the interface where the trace will be performed is the S5 interface between the P-GW and the S-GW.
    • s6b : Specifies that the interface where the trace will be performed is the S6b interface between the PGW and the 3GPP AAA server.
    • s8 : Specifies that the interface where the trace will be performed is the S8b interface between the PGW and the S-GW.
    • sgi : Specifies that the interface where the trace will be performed is the SGi interface between the PGW and the PDN.
  • Available func-sgw interface options are:
    • all : Specifies that all available func-sgw interfaces are to be traced.
    • gxc : Specifies that the interface where the trace will be performed is the Gx interface between the P-GW and the PCRF.
    • s11 : Specifies that the interface where the trace will be performed is the S11 interface between the MME and the S-GW.
    • s4 : Specifies that the interface where the trace will be performed is the S4 interface between the S-GW and an SGSN.
    • s5 : Specifies that the interface where the trace will be performed is the S5 interface between the S-GW and the P-GW.
    • s8 : Specifies that the interface where the trace will be performed is the S8b interface between the S-GW and the P-GW.

S-GW

The available sgw interfaces are:

  • all : Specifies that all available S-GW interfaces are to be traced.
  • gxc : Specifies that the interface where the trace will be performed is the Gxc interface between the S-GW and the PCRF.
  • s11 : Specifies that the interface where the trace will be performed is the S11 interface between the S-GW and the MME.
  • s4 : Specifies that the interface where the trace will be performed is the S4 interface between the S-GW and an SGSN.
  • s5 : Specifies that the interface where the trace will be performed is the S5 interface between the S-GW and the P-GW.
  • s8 : Specifies that the interface where the trace will be performed is the S8 interface between the S-GW and the P-GW.

Verifying the Session Trace Template Configuration

To verify the session trace configuration, enter the following command in Exec Mode.

show session trace template network-element { ggsn | hnbgw | mme | pgw | saegw | sgw } all  

The output provides the template name, the NE type, and all interfaces configured for tracing.

Disabling the Session Trace Template Configuration

Use the following example to disable the session trace template configuration:

no template-session-trace network-element { ggsn | hnbgw | mme | pgw | saegw | sgw }  

Disabling the Session Trace Template Configuration per Network Element and Subscriber

To disable the session trace template per network element and subscriber:

no session trace subscriber network-element { ggsn | hnbgw | mme | pgw | saegw | sgw } template-name  template_name  { imsi  id | imei   id } trace-ref   trace_ref_value  collection-entity   ip_address 

Configuring a Management Session Trace

Session tracing functionality must be enabled before a management trace can be configured. Refer to Enabling Session Tracing for the procedure.

To configure a management session trace on the UMTS/EPC network element from Exec Mode:

session trace subscriber network-element  { ggsn | hnbgw | mme | pgw | saegw | sgw } template-name  template_name { imei  id | imsi  id } { all |  interface }  } trace-ref  id collection-entity  ip_address 

Notes:

  • template-name : Specifies the name of the session trace template to use for this session trace. Session trace templates are configured in Global Configuration Mode using the template-session-trace command. Management traces executed in Exec mode will use the specified template.
  • imsi id : Specifies the International Mobile Subscriber Identification Number for the subscriber.
  • imei id : Specifies the International Mobile Equipment Identification number for the subscriber.
  • trace-ref : Specifies the Trace Reference for this subscriber management trace. It must be composed of the Mobile Country Code (MCC) + the Mobile Network Code (MNC) + a 3 byte octet string Trace ID. Example: 31001212349.
  • collection-entity : Specifies the IP address of the Trace Collection Entity (TCE) to which the trace file generated will be sent. The IP address must be in IPv4 format.

Example:

This following is a complete example showing the configuration of a subscriber management trace for all S-GW and P-GW interfaces. It consists of enabling session tracing on the SAEGW, creating the session trace template for all S-GW and P-GW interfaces, and then executing the subscriber management trace for a specific IMSI using the template.

config  
   session trace network-element  saegw 
   end  
config  
   template-session-trace network-element  saegw template-name  saegw_all 
      func-pgw interface all  
      func-sgw interface all  
      end  
session trace subscriber network-element  saegw template-name  saegw_all imsi  123456789012345 trace-ref  123456789012 collection-entity  1.1.1.1 

Verifying the Management Trace Configuration

To verify that the management trace configuration for the subscriber is enabled, enter the show session trace statistics command from Exec Mode. Verify that the correct NE(s) show their Network element status as Enabled . For example:

SAEGW Enabled  
            PGW:                    Trace-Type: M 
            SGW:                    Trace-Type: M 

Use the following example to verify that specific parameters have been activated for the subscriber management trace:

show session trace subscriber network-element { ggsn | hnbgw | mme | pgw | saegw | sgw } trace-ref  trace_ref_value  

The output fields show the NE Type and the Trace Type configured for each network element. Below is sample output for an SAEGW management trace configuration:

NE Type: SAEGW 
            PGW:                    Trace-Type:                    M 
            SGW:                    Trace-Type:                    M  
...... 
Traced Interfaces: 
PGW: 
      <P-GW interfaces configured for the trace.>
SGW: 
      <S-GW interfaces configured for the trace.>

Disabling the Management Trace Configuration

To disable the management trace configuration from Exec Mode:

no session trace subscriber network element { ggsn | hnbgw | mme | pgw | saegw | sgw } trace ref   trace_ref_value 

Configuring a Signaling Session Trace

Session trace functionality must be enabled before a signaling session trace can be configured. Refer to Enabling Session Tracing for the procedure.

To configure a signaling session trace:

session trace signaling network-element { ggsn | hnbgw | mme | pgw | saegw [ func-pgw | func-sgw ] | sgw }   

Notes:

  • func-pgw Enables tracing of the P-GW signaling under the SAEGW
  • func-sgw : Enables tracing of the S-GW signaling under the SAEGW
  • If neither func-sgw or func-pgw is specified, then the signaling trace will be performed for all P-GW and S-GW interfaces of the SAEGW.
  • collection-entity : Specifies the IPv4 or IPv6 address of the Trace Collection Entity (TCE) to which the trace files are sent.

Example:

This example configures a signaling session trace for all S-GW and P-GW interfaces under an SAEGW:

session trace  signaling  network-element  saegw  

Verifying the Signaling Session Trace Configuration

To verify the signaling session trace configuration:

show session trace statistics  

Look for the following fields to verify the signaling trace configuration. For example:

Network element status:  
...... 
SAEGW Enabled 
          PGW:                    Trace-Type: S 
          SGW:                    Trace-Type: S  

Disabling the Signaling Session Trace

To deactivate signaling trace on the SAEGW:

no session trace signaling network-element { ggsn | hnbgw | mme | pgw | saegw [ func-pgw | func-sgw ] | sgw }   

Configuring a Random Trace

Session trace functionality first must be enabled on the UMTS/EPC network element before a random trace can be configured. Refer to Enabling Session Tracing in this chapter for the procedure.

The following command enables or disables the subscriber session trace functionality based on a random trace on the UMTS/EPC network element. If enabled, the subscriber selection will be based on random logic for all instances of session on a specified network element.

To configure a random session trace:

session trace random  range network-element { ggsn | hnbgw | pgw | saegw | sgw [ func-pgw | func-sgw ] } interface [ all |  interface } collection-entity  ipv4_address 

Notes:

  • session trace random range : Enables a random trace for a specified number of subscribers. Valid entries are from 1 to 1000 subscribers.
  • { ggsn | hnbgw | pgw | saegw | sgw [ func-pgw | func-sgw ] } : Specifies that the random trace is enabled for the selected network element.
  • func-pgw : Enables random tracing of the P-GW interfaces under the SAEGW.
  • func-sgw : Enables random tracing of the S-GW interfaces under the SAEGW.
  • If neither func-pgw or func-sgw are specified, random tracing will occur for both the P-GW and S-GW.
  • interface : Specifies the network interfaces for the random trace. Interfaces available depend on the network element type selected.

GGSN

Available ggsn interfaces are:

  • all : Specifies that all available GGSN interfaces are to be traced.
  • gi : Specifies that the interface where the trace will be performed is the Gi interface between the GGSN and RADIUS server.
  • gmb : Specifies that the interface where the trace will be performed is the Gmb interface between the GGSN and BM-SC.
  • gn : Specifies that the interface where the trace will be performed is the Gn interface between the GGSN and the SGSN.
  • gx : Specifies that the interface where the trace will be performed is the Gx interface between the GGSN and PCRF.
  • gy : Specifies that the interface where the trace will be performed is the Gx interface between the GGSN and PCRF.

HNBGW

Available hnbgw interfaces are:

  • all: Specifies that all hnbgw interfaces are to be traced.
  • iucs: Specifies that the interface where the trace will be performed is the iucs interface between the HNB-GW and the Mobile Switching Center (3G MSC) in a 3G UMTS Femtocell Access Network.
  • iups: Specifies that the interface where the trace will be performed is the iups interface between the HNB-GW and the SGSN.

P-GW

Available P-GW interfaces are:

  • all : Specifies that all interfaces are to be traced.
  • gx : Specifies that the interface where the trace will be performed is the Gx interface between the P-GW and the PCRF.
  • gy : Specifies that the interface where the trace will be performed is the Gy interface between the P-GW and OCS.
  • s2a : Specifies that the interface where the trace will be performed is the S2a interface between the P-GW and the HSGW.
  • s2b : Specifies that the interface where the trace will be performed is the S2b interface between the P-GW and an ePDG.
  • s2c : Specifies that the interface where the trace will be performed is the S2c interface between the P-GW and a trusted, non-3GPP access device.
  • s5 : Specifies that the interface where the trace will be performed is the S5 interface between an S-GW and P-GW located within the same administrative domain (non-roaming).
  • s6b : Specifies that the interface where the trace will be performed is the S6b interface between the P-GW and the 3GPP AAA server.
  • s8 : Specifies that the interface where the trace will be performed is the S8 interface -- an inter-PLMN reference point between the S-GW and the P-GW used during roaming scenarios.
  • sgi : Specifies that the interface where the trace will be performed is the SGi interface between the P-GW and the PDN.

SAEGW

The interfaces that can be traced on the SAEGW are broken down by the interfaces available on a P-GW configured under an SAEGW (func-pgw ), and the interfaces available on a S-GW configured under an SAEGW (func-sgw ).

Available SAEGW func-pgw interface options are:
  • all : Specifies that all func-pgw interfaces configured under an SAEGW are to be traced.
  • gx : Specifies that the interface where the trace will be performed is the Gx interface between the P-GW and the PCRF.
  • s2a : Specifies that the interface where the trace will be performed is the S2a interface between the PGW and the HSGW.
  • s2b : Specifies that the interface where the trace will be performed is the S2b interface between the PGW and an ePDG.
  • s2c : Specifies that the interface where the trace will be performed is the S2c interface between the PGW and a trusted, non-3GPP access device.
  • s5 : Specifies that the interface where the trace will be performed is the S5 interface between the P-GW and the S-GW.
  • s6b : Specifies that the interface where the trace will be performed is the S6b interface between the PGW and the 3GPP AAA server.
  • s8 : Specifies that the interface where the trace will be performed is the S8b interface between the PGW and the S-GW.
  • sgi : Specifies that the interface where the trace will be performed is the SGi interface between the PGW and the PDN.
  • gy : Specifies that the interface where the trace will be performed is the GTPP based online charging interface between P-GW and online charging system.

Available SAEGW func-sgw interfaces are:

  • all : Specifies that all available func-sgw interfaces under an SAEGW are to be traced.
  • gxc : Specifies that the interface where the trace will be performed is the Gx interface between the P-GW and the PCRF.
  • s11 : Specifies that the interface where the trace will be performed is the S11 interface between the MME and the S-GW.
  • s4 : Specifies that the interface where the trace will be performed is the S4 interface between the S-GW and an SGSN.
  • s5 : Specifies that the interface where the trace will be performed is the S5 interface between the S-GW and the P-GW.
  • s8 : Specifies that the interface where the trace will be performed is the S8b interface between the S-GW and the P-GW.

S-GW: Available sgw interfaces are:

  • all : Specifies that all interfaces are to be traced.
  • gxc : Specifies that the interface where the trace will be performed is the Gxc interface between the S-GW and the PCRF.
  • s11 : Specifies that the interface where the trace will be performed is the S11 interface between the S-GW and the MME.
  • s4 : Specifies that the interface where the trace will be performed is the S4 interface between the S-GW and an SGSN.
  • s5 : Specifies that the interface where the trace will be performed is the S5 interface between the S-GW and the P-GW.
  • s8 : Specifies that the interface where the trace will be performed is the S8 interface between the S-GW and the P-GW.
  • collection-entity specifies the IPv4 address of the Trace Collection Entity (TCE)

Example:

To enable random tracing on a range of 40 SAEGW subscribers on all S-GW interfaces and the s5 interface of the P-GW in the SAEGW, enter the following sample command:

session trace random  40 network-element  saegw func-pgw interface  s5 func-sgw interface  all collection-entity  1.1.1.1  

Verifying the Random Trace Configuration

To verify the random session trace configuration:

show session trace statistics  

Look for the fields that verify that Random Session Trace has been enabled for the network element. For example:

Network element status: 
... 
SAEGW Enabled 
          PGW:                    Trace-Type: R  
          SGW:                    Trace-Type: R Configured-Random: 40 

Disabling the Random Trace for a Specific Network Element

To disable random session tracing for a specific network element:

no session trace random network-element { ggsn | hnbgw | pgw | saegw | sgw [ func-pgw | func-sgw ] }  

Monitoring the Session Trace Functionality

show session trace statistics

This section provides information on commands you can use to monitor the session trace functionality

This command provides high-level statistics on the current use of the session trace functionality, including:

  • Number of current trace sessions
  • Number of total trace sessions
  • Total sessions activated
  • Number of activation failures
  • Number of sessions triggered
  • Total messages traced
  • Number of current TCE connections
  • Total number of TCE connections
  • Total number of files uploaded to all TCEs

show session trace subscriber network-element trace-ref

This command shows detailed information about a specific trace, based on the trace-ref value of the session and network element type. It includes activation time, IMSI, start time, number of trace messages, and total number of files created. It also lists the interfaces that this session trace is configured to trace.

show session trace trace-summary

This command provides the trace-ref value of all session traces, broken down my network element type.

show session trace tce-summary

This command provides the IP address and index information for all configured TCEs.

show session trace tce-address

This command provides detailed information about a specific TCE, including IP address, start time, and total number of files uploaded.

Supported SAEGW Session Trace Configurations

Different tracing configurations are supported on the SAEGW. The different combinations of session tracing types depend on Call Type, Trace Type, and whether the operator would like to configure a Func-SGW and/or a Func-PGW trace.

Note the following:

  • M = Management
  • R = Random
  • S = Signaling
Table 1. Supported Session Trace Configurations on the SAEGW
Func-S-GW Trace Config Func-P-GW Trace Config Call Type S-GW Trace? P-GW Trace? Output Comments

M

M

Collapsed

Yes

Yes

1 SAEGW trace file generated

When M traces are enabled for Func-SGW, Func-PGW and call type Collapsed both S-GW control messages (gtpv2) and P-GW control messages shall be traced in 1 SAEGW trace file.

R

R

Collapsed

Yes

Yes

1 SAEGW trace file generated

S

S

Collapsed

Yes

Yes

1 SAEGW trace file generated

M+S

M+S

Collapsed

Yes

Yes

2 SAEGW trace files generated

When M+S traces are enabled for Func-S-GW, Func-P-GW and call type collapsed both -SGW control messages (gtpv2) and P-GW control messages shall be traced in 2 SAEGW trace files. One Trace file due to Management and other due to Signaling. Both files have the same contents.

M+R

M+R

Collapsed

Yes

Yes

1 SAEGW trace file generated

S

R

Collapsed

No

No

None

Not a valid trace configuration

R

S

Collapsed

No

No

None

Not a valid trace configuration

M

R

Collapsed

Yes

No

1 SAEGW trace file generated

R

M

Collapsed

No

Yes

1 SAEGW trace file generated

M

S

Collapsed

No

Yes

1 SAEGW trace file generated

S

M

Collapsed

Yes

No

1 SAEGW trace file generated

M+S

M

Collapsed

Yes

No

2 SAEGW trace files generated

P-GW Trace is not generated

M

M+S

Collapsed

No

Yes

2 SAEGW trace files generated, but S-GW trace not generated

S-GW Trace is not generated

M+S

S

Collapsed

Yes

Yes

2 SAEGW trace files generated

S

M+S

Collapsed

Yes

Yes

2 SAEGW trace files generated

M+R

M

Collapsed

Yes

Yes

1 SAEGW trace file generated

M

M+R

Collapsed

Yes

Yes

1 SAEGW trace file generated

M+R

R

Collapsed

Yes

No

1 SAEGW trace file generated

R

M+R

Collapsed

No

Yes

1 SAEGW trace file generated

M

n/a

Pure S

Yes

No

1 SAEGW trace file generated

Config for func-P-GW is not applicable for Pure S calls

S

n/a

Pure S

Yes

No

1 SAEGW trace file generated

R

n/a

Pure S

Yes

No

1 SAEGW trace file generated

M+S

n/a

Pure S

Yes

No

2 SAEGW trace files generated

M+R

n/a

Pure S

Yes

No

1 SAEGW trace file generated

R+S

n/a

Pure S

No

No

None

Not a valid trace configuration.

n/a

M

Pure P

No

Yes

1 SAEGW trace file generated

n/a

S

Pure P

No

Yes

1 SAEGW trace file generated

n/a

R

Pure P

No

Yes

1 SAEGW trace file generated

n/a

M+S

Pure P

No

Yes

2 SAEGW trace file generated

n/a

M+R

Pure P

No

Yes

1 SAEGW trace file generated

n/a

R+S

Pure P

No

Yes

None

Not a valid trace configuration

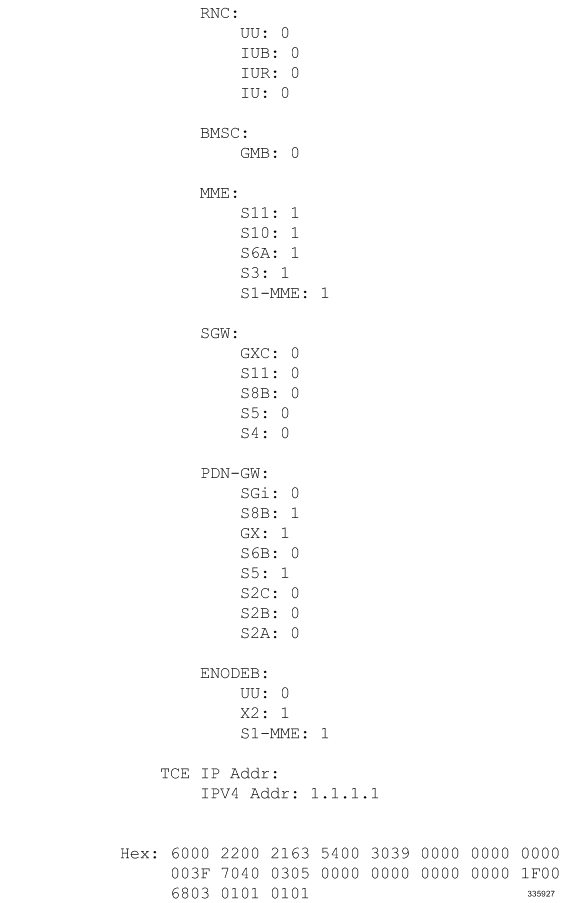
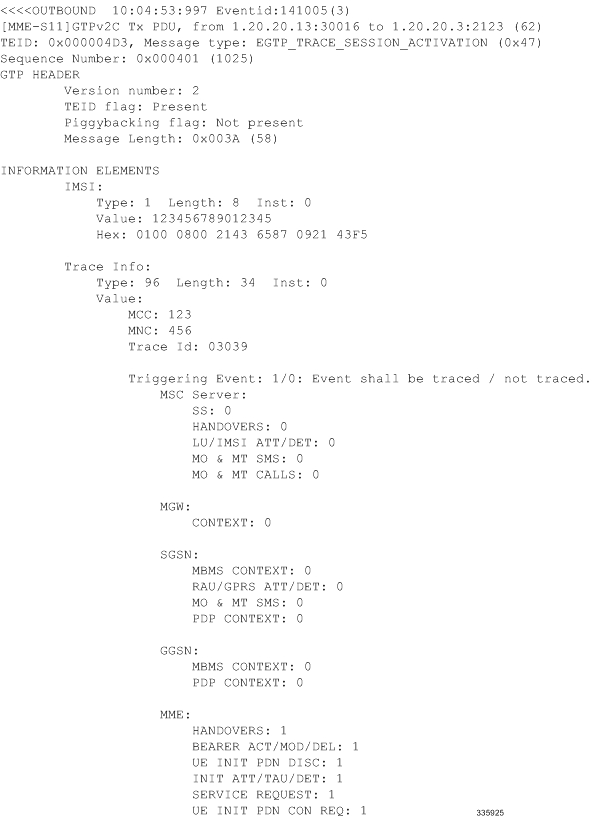
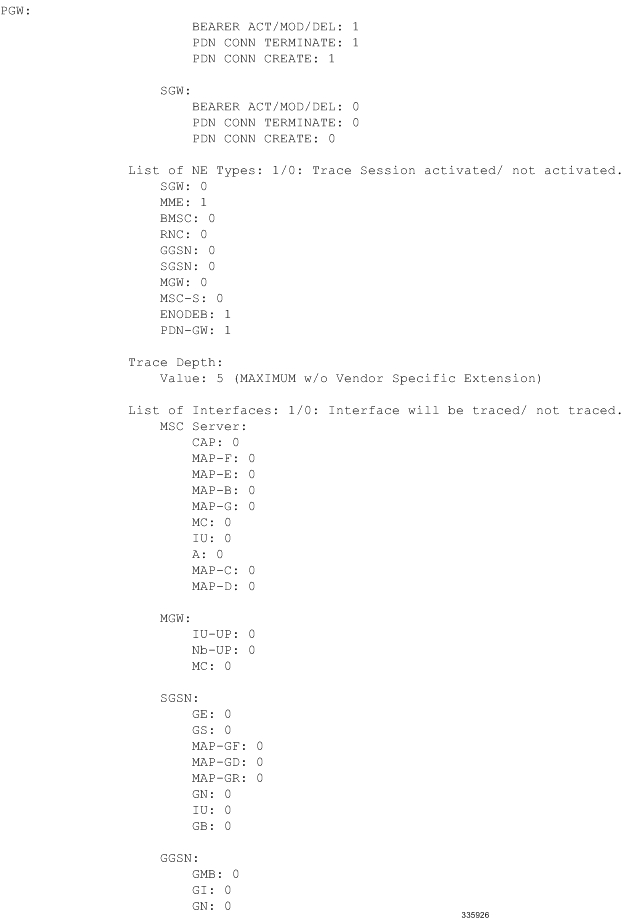
Session Trace File Example

This section provides an example of a signaling trace file.

Figure 2. Signaling Trace File Example (1 of 3)


Figure 3. Signaling Trace File Example (2 of 3)


Figure 4. Signaling Trace File Example (3 of 3)