Monitoring the Mobility Express Network

About the Cisco Mobility Express Monitoring Service

The Cisco Mobility Express Monitoring service enables the primary AP to monitor the WLANs and all the connected and unconnected devices on the network.

The Monitoring service offers the following capabilities through the Network Summary and Wireless Dashboard tabs:

  • View details of configured WLANs.

  • View list of top WLANs based on traffic and associated clients.

  • View details of APs in the network.

  • View details of clients operating actively at either 2.4 GHz or 5 GHz.

  • View summary of client device-operating systems and applications running on these devices.

  • View detailed listing of rogue clients and APs.

  • View details of various interferers in the network on the 2.4GHz and 5 GHz radio frequencies.

  • Monitor the performance of APs in the network.

  • Monitor the performance of clients in the network.


Note

  • All the parameters on the Network Summary window are read-only parameters.

  • This page is automatically refreshed every 30 seconds.


Customizing the Network Summary View

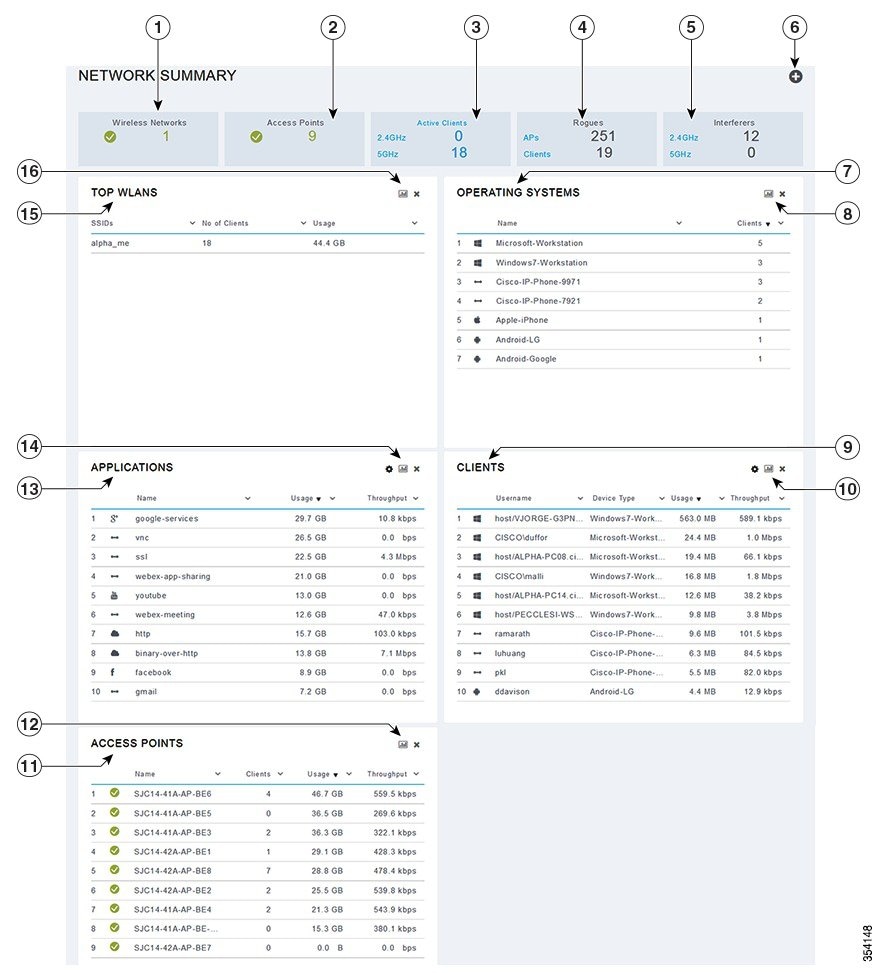
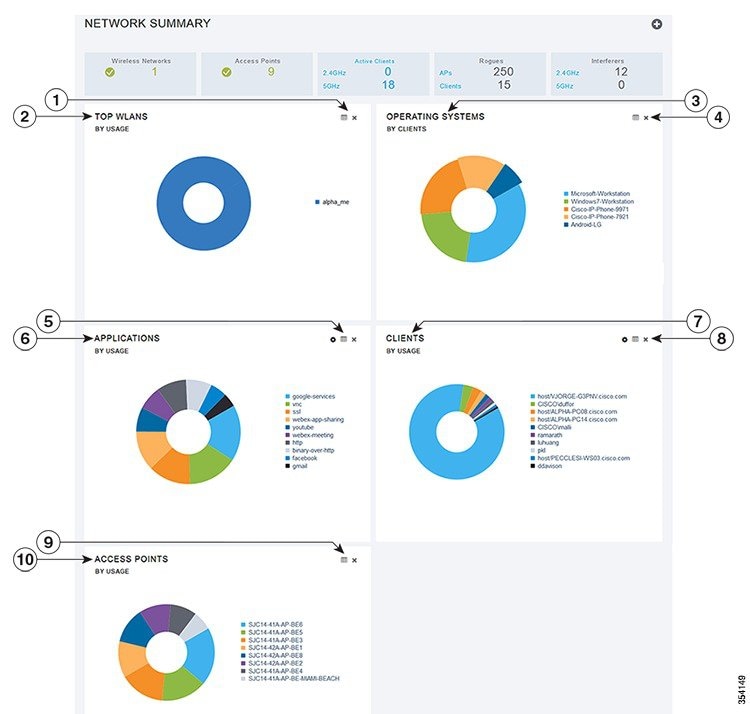
You can customize the Network Summary view by adding or removing widgets. The data displayed in the various widgets can be viewed either in the doughnut format or in the tabular format by toggling the display icon on the top right corner of the individual widgets.

Figure 1. Network Summary Widgets - Tabular view
Figure 2. Network Summary Widgets - Doughnut view

Viewing and Managing WLAN Users

You can view and manage WLAN users only for WPA2 Enterprise with Local Server setup. To use your Cisco Mobility Express wireless network, a wireless client should connect to a WLAN in the network. To connect to a WLAN, the wireless client will have to use the user credentials set for that WLAN. If this WLAN uses WPA2-Personal as a Security Policy, then the user must provide the appropriate WPA2-PSK set for that WLAN on the Controller AP. If the Security Policy is set to WPA2-Enterprise, the user must provide a valid user identity and the corresponding password set in the RADIUS user database.

You can set up different users (and consequently, user credentials) for the different WLANs in the Cisco Mobility Express wireless network, in the WLAN Users window. These are local users authenticated by the primary AP using WPA2-PSK. Users authenticated by WPA2-Enterprise must have a valid record in the RADIUS database in order to be authenticated since they are not a part of the WLAN Users database.

Viewing WLANs

The WLAN Configuration window lists all the WLANs that are currently configured on the primary AP’s controller, along with the following details for each WLAN:

  • Active—Whether the WLAN is enabled or disabled.

  • Name—Name of the WLAN

  • Security Policy

  • Radio Policy


Tip

The total number of active WLANs is displayed at the top of the page. If the list of WLANs spans multiple pages, you can browse these pages by clicking the page number links or the forward and backward icons.


Viewing the Details of Configured WLANs

Procedure


Step 1

Choose Monitoring > Network Summary.

A count of the configured WLANs is displayed in the Wireless Networks summary window.

Step 2

In the Wireless Networks summary window, click the status icon or count display icon to view high-level details of the corresponding WLAN, such as the Active status, Name, Security Policy, and Radio Policy.

You can also add new WLANs from this page. For details, see Adding a WLAN.


Customizing Access Points Table View

Procedure


Step 1

Click Monitoring > Network Summary > Access Points.

The Access Points view page appears.
Step 2

In the Access Points view page, toggle between the 2.4GHz and 5GHz tabs to view a tabular listing of the access points operating at the respective radio frequencies.

Step 3

(Optional) Click the downward facing arrow on the top right of the column header to select columns to be hidden or shown in the table view. hide or show desired or to filter the table view based on desired parameters.

Step 4

(Optional) Click the downward facing arrow on the top right of the column header to filter the table view based on desired parameters.


Viewing Details of Clients

Procedure


Step 1

Click Monitoring > Network Summary.

A summary of all active clients is displayed in the Active Clients summary section. These clients are either 802.11 b/g/n clients operating at 2.4 GHz or 802.11 a/n/ac clients operating at 5 GHz.

Step 2

In the Active Clients summary section, click the count display icon to view high-level details of the client device.

The information shown includes:
  • General details.

  • Connectivity status graphic.

  • Top applications on the client that are using the network connection.

  • Mobility State graphic.

  • Network, QoS, Security and Policy details.

  • Client ping and packet capture tests.

Click the downward facing arrow on the top right of the column headers to customize the details displayed in the table either to hide or show desired columns or to filter the table view based on desired parameters.


Understanding the Mobility State Graphic

The Mobility State graphic for a client shows the following details:

  • Name of the wireless LAN controller, with it's IP address and the model number of the AP on which it is running.

  • Name of the AP through which the client is connected to the controller, along with the type of connection (for example, Flexconnect), the AP's IP address, and the AP's model number.

  • Nature of connection between the AP and the client. For example, wireless 802.11n 5 GHz connection.

  • Name of the client, type of client (for example, Microsoft Workstation), VLAN ID of the client, and the client's IP address.

Performing a Client Ping Test

You can perform a ping test on the client to determine the latency or delay between the controller and the client. This is an Internet Control Message Protocol (ICMP) based test. Using the ping test you can know the connectivity as well as the latency between the controller and the client.

To start the test, click Start. The latency in milliseconds is represented graphically.

Capturing Client Packets


Note

This feature does not work on subordinate APs having Cisco AP-OS, namely the Cisco Aironet 1810W, 1830, 1850, 2800, and 3800 Series access points.


The Client Packet Capture feature allows network administrators to capture packets flowing to, through, and from an AP, while the AP continues to operate normally. The packets are captured and exported to an FTP server, where you can do an offline analysis by using a tool such as Wireshark. This feature facilitates troubleshooting by helping to gather information about the packet format, application analysis, and security.

Points to Note

  • Packet capture can be enabled for only one client at a time.

  • The packets are captured and dumped in the order of arrival or transmission of packets, except for beacons and probe responses. The packet capture contains information such as channel, RSSI, data rate, SNR, and timestamp. Each packet is appended with additional information from the AP.

  • A file is created on the FTP server for each AP based on AP name, controller name and timestamp.

  • If the FTP transfer time is slower than the packet rate, some of the packets may not appear in the capture file.

  • If the buffer on the AP does not contain any packets, a dummy packet is dumped to keep the connection alive.

  • If the FTP transfer fails or FTP connection is lost during packet capture, the AP stops capturing packets, notifies with an error message and SNMP trap, and a new FTP connection is established.

  • Not all packets in the air are captured, but only those that reach the radio driver.

  • Before you start ensure that you have an FTP server, that is reachable by the AP. The captured packets are dumped to this FTP server.

Performing the Packet Capture

  1. Choose Monitoring > Network Summary > Clients.

  2. On the Client View page, under Client Test, click the Packet Capture tab.

  3. Under Capture Point, specify the following details:
    • AP Name—The name of the AP which will be the capture point. The capture point is a traffic transit point where the packets are captured. You can specify only an AP as the capture point

    • Time—Specify the time period for packet capture. The range is from 1 to 60 minutes.

  4. Under Capture Filters, specify the types of packets that need to be captured. You have the following types:
    • Control Packets

    • Data Packets

    • Dot1x

    • IAPP

    • Management Packets

    • ARP

    • Multicast frames

    • Broadcast frames

    • All IP

    • TCP with matching port number

    • UDP with matching port number

  5. Under FTP Details, specify the following details of the FTP server to which the captured packets are dumped:
    • IP Address

    • Path of the folder on the FTP server where the packets are to be dumped

    • Username and Password for access to the FTP server

  6. Click Start.

The Client Status icon is Green when a packet capture is in progress. It is Red otherwise.

Viewing Details of Rogue Devices (Clients and Access Points)

Procedure


Step 1

Click Monitoring > Network Summary.

A summary of rogue APs and clients is displayed in the Rogues summary window.

Step 2

In the Rogues summary window, click the count display icon to view high-level details of the rogue devices (unmanaged neighboring APs or clients).


Viewing Details of Interferers

Procedure


Step 1

Click Monitoring > Network Summary.

A summary of all non-WiFi interfering devices is displayed in the Interferers summary window. These interferers may either be operating at 2.4 GHz or at 5 GHz.

Step 2

In the Interferers summary window, click the count display icon to view high-level details of the interfering device.


Customizing the Access Point Performance View

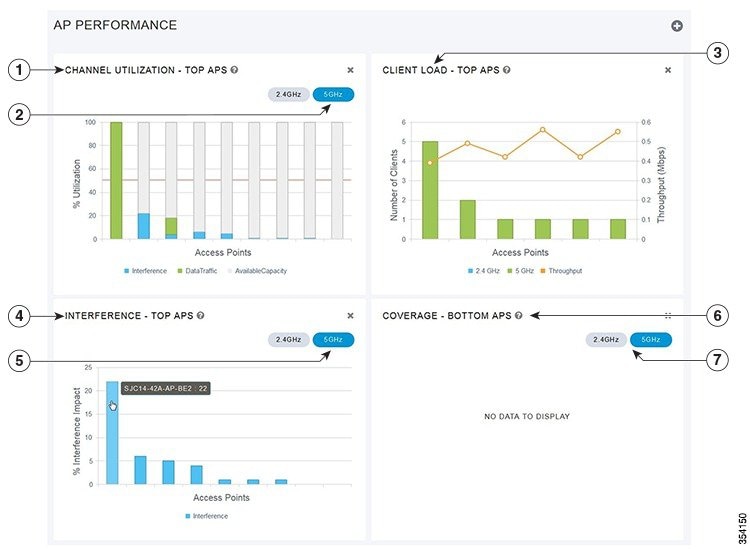
You can customize the AP Performance view by adding or removing widgets.

Figure 3. Wireless Dashboard - AP Performance

Adding Widgets to Customize Access Point Performance View

Procedure


Step 1

Choose Monitoring > Wireless Dashboard > AP Performance.

Step 2

Click the Add Widget icon on the top right hand side of the AP Performance window.

Step 3

Click to select the widgets that you want to add:

  • Channel Utilization—Top APs

  • Interference—Top APs

  • Client Load—Top APs

  • Coverage—Bottom APs

Step 4

Click Close.

The AP Performance window is refreshed with the new widgets.


Removing Widgets to Customize Access Point Performance View

Procedure


Step 1

Choose Monitoring > Wireless Dashboard > AP Performance.

Step 2

Click the Delete Widget icon on the top right hand side of the widgets that you want to delete.

The AP Performance window does not display the deleted widgets.


Customizing the Client Performance View

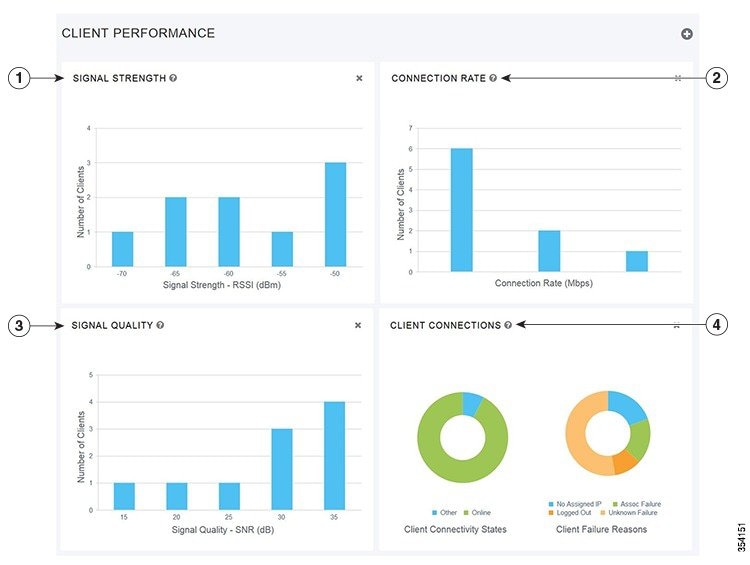
You can customize the Client Performance view by adding or removing widgets.

Figure 4. Wireless Dashboard - Client Performance

Adding Widgets to Customize Client Performance View

Procedure


Step 1

Choose Monitoring > Wireless Dashboard > Client Performance.

Step 2

Click the Add Widget icon on the top right hand side of the Client Performance window.

Step 3

Click to select the widgets that you want to add:

  • Signal Strength

  • Signal Quality

  • Connection Rate

  • Client Connections

Step 4

Click Close.

The Client Performance window is refreshed with the new widgets.


Removing Widgets to Customize Client Performance View

Procedure


Step 1

Choose Monitoring > Wireless Dashboard > Client Performance.

Step 2

Click the Delete Widget icon on the top right hand side of the widgets that you want to delete.

The Client Performance window does not display the deleted widgets.