- Preface
- Overview
- Using the Command-Line Interface
- Assigning the Switch IP Address and Default Gateway
- Configuring Cisco IOS Configuration Engine
- Administering the Switch
- Configuring the Switch Alarms
- Configuring SDM Templates
- Configuring Switch-Based Authentication
- Configuring IEEE 802.1x Port-Based Authentication
- Configuring the PPoE Intermediate Agent
- Configuring Interfaces
- Configuring Command Macros
- Configuring VLANs
- Configuring Private VLANs
- Configuring IEEE 802.1Q Tunneling, VLAN Mapping, 802.1ad, and Layer 2 Protocol Tunneling
- Configuring STP
- Configuring MSTP
- Configuring Optional Spanning-Tree Features
- Configuring Resilient Ethernet Protocol
- Configuring Flex Links and the MAC Address-Table Move Update Feature
- Configuring DHCP Features and IP Source Guard
- Configuring Dynamic ARP Inspection
- Configuring IGMP Snooping and MVR
- Configuring Port-Based Traffic Control
- Configuring CDP
- Configuring LLDP and LLDP-MED
- Configuring UDLD
- Configuring SPAN and RSPAN
- Configuring RMON
- Configuring System Message Logging
- Configuring SNMP
- Configuring Embedded Event Manager
- Configuring Network Security with ACLs
- Configuring IP Unicast Routing
- Configuring Control-Plane Security
- Configuring QoS
- Configuring EtherChannels and Link-State Tracking
- Configuring IPv6 Unicast Routing
- Configuring IPv6 MLD Snooping
- Configuring IPv6 ACLs
- Configuring IPv6 QoS
- Configuring HSRP, VRRP, and GLBP
- Configuring Cisco IOS IP SLAs Operations
- Configuring Enhanced Object Tracking
- Configuring Ethernet OAM, CFM, and E-LMI
- Configuring Y.1731 Performance Monitoring
- Configuring IP Multicast Routing
- Configuring MSDP
- Troubleshooting
- Configuring Online Diagnostics
- Working with the Cisco IOS File System, Configuration Files, and Software Images
- Unsupported Commands in Cisco IOS Release 12.2(60)EZ
Cisco ME3400E Ethernet Access Switch Software Configuration Guide, Rel 12.2(60)EZ
Bias-Free Language
The documentation set for this product strives to use bias-free language. For the purposes of this documentation set, bias-free is defined as language that does not imply discrimination based on age, disability, gender, racial identity, ethnic identity, sexual orientation, socioeconomic status, and intersectionality. Exceptions may be present in the documentation due to language that is hardcoded in the user interfaces of the product software, language used based on RFP documentation, or language that is used by a referenced third-party product. Learn more about how Cisco is using Inclusive Language.
- Updated:
- April 30, 2013
Chapter: Configuring Y.1731 Performance Monitoring
Configuring Y.1731 Performance Monitoring
This chapter describes how to configure the Y.1731 Performance Monitoring on the Cisco ME 3400E switches and includes the following sections:
Understanding Y.1731 Performance Monitoring
When service providers sell connectivity services to a subscriber, a Service Level Agreement (SLA) is reached between the buyer and seller of the service. The SLA defines the attributes offered by a provider and serves as a legal obligation on the service provider. As the level of performance required by subscribers increases, service providers need to monitor the performance parameters being offered. To capture the needs of the service providers, organizations have defined various standards such as IEEE 802.1ag and ITU-T Y.1731 that define the methods and frame formats used to measure performance parameters.
Y.1731 Performance Monitoring (PM) provides a standard ethernet PM function that includes measurement of ethernet frame delay, frame delay variation, frame loss, and frame throughput measurements specified by the ITU-T Y-1731 standard and interpreted by the Metro Ethernet Forum (MEF) standards group. As per recommendations, the ME 3400E switches should be able to send, receive and process PM frames in intervals of 1000ms (1000 frames per second) with the maximum recommended transmission period being 1000ms (1000 frames per second) for any given service.
To measure SLA parameters such as frame delay or frame delay variation, a small number of synthetic frames are transmitted along with the service to the end point of the maintenance region, where the Maintenance End Point (MEP) responds to the synthetic frame. For a function such as connectivity fault management, the messages are sent less frequently, while performance monitoring frames are sent more frequently.
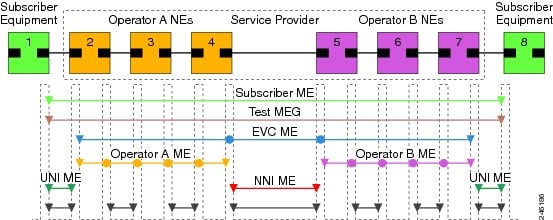
Figure 1-1 illustrates Maintenance Entities (ME) and Maintenance End Points (MEP) typically involved in a point-to-point metro ethernet deployment for the Y.1731 standard.
Figure 1-1 A Point-to-Point Metro Ethernet Deployment with Typical Maintenance Entities and Maintenance Points
Performance monitoring parameters include
- Connectivity, page 41-2
- Frame Delay and Frame Delay Variation, page 41-2
- Frame Loss Ratio and Availability
Connectivity
The first step to performance monitoring is verifying the connectivity. Continuity check messages (CCM) are best suited for connectivity verification. Since they are optimized for fault recovery operation, they are not usually accepted as a component of an SLA due to the timescale difference between SLA and fault recovery. Instead, Connectivity Fault Management (CFM) and Continuity Check Database (CCDB) are used to verify connectivity. For more information on CFM see, Configuring Ethernet OAM, CFM, and E-LMI.
Frame Delay and Frame Delay Variation
Ethernet frame delay measurement (ETH-DM) is used for on-demand ethernet Operations, Administration, and Maintenance (OAM) to measure frame delay and frame delay variation.
Ethernet frame delay and frame delay variation are measured by sending periodic frames with ETH-DM information to the peer MEP and receiving frames with ETH-DM information from the peer MEP. During the interval, each MEP measures the frame delay and frame delay variation.
ETH-DM also collects information, such as worst and best case delays, average delay, and average delay variation. It provides a runtime display of delay statistics during a two-way delay measurement. ETH-DM records the last 100 samples collected per remote Maintenance End Point (MEP) or per CFM session.
These are the two methods of delay measurement, as defined by the ITU-T Y.1731 standard: One-way ETH-DM and Two-way ETH-DM. However, only Two-way ETH-DM is supported.
Each MEP transmits frames with ETH-DM request information to its peer MEP and receives frames with ETH-DM reply information from its peer MEP. Two way frame delay and frame delay variation are measured using delay measurement message (DMM) and delay measurement reply (DMR) frames.
Synthetic Loss Measurement
Synthetic Loss Measurement (ETH-SLM) is a mechanism to measure frame loss using synthetic frames, rather than data traffic. A number of synthetic frames are sent and received, and the number that are lost is calculated between a pair of MEPs. This number is used as a statistical sample to approximate the frame loss ratio of data traffic.
ETH-SLM transmits synthetic frames with ETH-SLM information to a peer MEP and similarly receives synthetic frames with ETH-SLM information from the peer MEP. Each MEP performs frame loss measurements which contribute to unavailable time.
A near-end frame loss refers to frame loss associated with ingress data frames. Far-end frame loss refers to frame loss associated with egress data frames. Both near-end and far-end frame loss measurements contribute to near-end severely errored seconds and far end severely errored seconds which together contribute to unavailable time.
ETH-SLM is measured using SLM and SLR frames. Although ITU-T Y.1731 defines two methods of frame loss measure, only Single-ended ETH-SLM is supported.
With Single-ended ETH-SLM, each MEP transmits frames with the ETH-SLM request information to its peer MEP and receives frames with ETH-SLM reply information from its peer MEP to complete synthetic loss measurements.
Supported Interfaces
Restrictions and Usage Guidelines
Follow these restrictions and usage guidelines when you configure Y.1731 PM on the switch:
- Y.1731 PM is not supported on customer VLANs (C-VLANs). PM is only supported on service provider VLANs (S-VLANs).
- PM does not support SNMP, although CLI and system-logging is supported.
- Frame throughput measurements are not supported.
- Clock synchronization is not mandatory for Two-way delay measurement.
- For PM support on port-channels. adding or deleting a member link renders the session invalid.
- On-demand SLM/DMM is not supported on ME 3400E.
- SLM supports the following modes for sending frames:
Configuring Two-way Delay Measurement
To configure a two-way delay measurement, complete these steps:
Configuration Example
The following example shows a two-way frame delay measurement configuration:
Configuring Single Ended Synthetic Loss Measurement
To configure single ended synthetic loss measurement, complete the steps in this section.

Note![]() Before you begin, configure the interfaces for loss monitoring by using the monitor loss counter [priority cos range] command under the EVC CFM sub-config mode.
Before you begin, configure the interfaces for loss monitoring by using the monitor loss counter [priority cos range] command under the EVC CFM sub-config mode.
Configuring SLM on the Sender
Configuring SLM on the Responder
Configuration Example
This example shows the configuration of single ended frame loss measurement:
Verifying the Frame Delay Configurations
To verify and monitor the frame delay and frame delay variation measurement configuration, use this command in privileged EXEC mode:
To display all details of frame delay and frame delay variation measurements, use the show ip sla statistics detail command.
Verifying Synthetic Loss Measurement Configurations
To verify the SLM configurations, use the following commands in privileged EXEC mode:
To display the same outputs as the latest statistics detail command, use the show ip sla history interval n command. The number displayed is the number of intervals configured.
To display the performance monitoring session summary, use the show ethernet cfm pm session summary command.
To display the SLM configurations, use the show run | b ip sla command in privileged EXEC mode.
Troubleshooting
These troubleshooting scenarios apply to the Y.1731 performance monitoring configurations:
|
|
|
|---|---|
 Feedback