Troubleshooting
The documentation set for this product strives to use bias-free language. For the purposes of this documentation set, bias-free is defined as language that does not imply discrimination based on age, disability, gender, racial identity, ethnic identity, sexual orientation, socioeconomic status, and intersectionality. Exceptions may be present in the documentation due to language that is hardcoded in the user interfaces of the product software, language used based on RFP documentation, or language that is used by a referenced third-party product. Learn more about how Cisco is using Inclusive Language.
This chapter contains the following sections:
To log and/or monitor the traffic flow for a contract rule, you can enable and view the logging of packets or flows that were allowed to be sent because of contract permit rules or the logging of packets or flows that were dropped because of:
Taboo contract deny rules
Deny actions in contract subjects
Contract or subject exceptions
ACL contract permit and deny logging in the ACI fabric is only supported on Nexus 9000 Series switches with names that end in EX or FX, and all later models. For example, N9K-C93180LC-EX or N9K-C9336C-FX.
Using log directive on filters in management contracts is not supported. Setting the log directive will cause zoning-rule deployment failure.
For information on standard and taboo contracts and subjects, see Cisco Application Centric Infrastructure Fundamentals and Cisco APIC Basic Configuration Guide.
Up to Cisco APIC, Release 3.2(1), the ACL permit and deny logs did not identify the EPGs associated with the contracts being logged. In release 3.2(1) the source EPG and destination EPG are added to the output of ACI permit and deny logs. ACL permit and deny logs include the relevant EPGs with the following limitations:
Depending on the position of the EPG in the network, EPG data may not be available for the logs.
When configuration changes occur, log data may be out of date. In steady state, log data is accurate.
The most accurate EPG data in the permit and deny logs results when the logs are focussed on:
Flows from EPG to EPG, where the ingress policy is installed at the ingress TOR and the egress policy is installed at the egress TOR.
Flows from EPG to L3Out, where one policy is applied on the border leaf TOR and the other policy is applied on a non-BL TOR.
EPGs in the log output are not supported for uSeg EPGs or for EPGs used in shared services (including shared L3Outs).
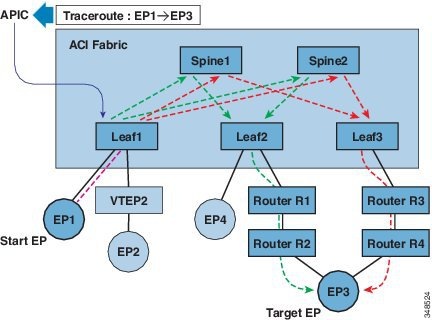
A traceroute that is initiated from the tenant endpoints shows the default gateway as an intermediate hop appears at the ingress leaf switch.
Traceroute modes include from endpoint to endpoint, and from leaf to leaf (TEP to TEP). Traceroute discovers all paths across the fabric, points of exit for external endpoints, and helps to detect if any path is blocked.
Traceroute works with IPv6 source and destination addresses but
configuring source and destination addresses across IPv4 and IPv6 addresses is
not allowed. Source (RsTrEpIpSrc) and destination
(RsTrEpIpDst) relations support source and destination of type
fvIp. At times, multiple IP addresses are learned from
the same endpoint. The administrator chooses the desired source and destination
addresses.
Atomic counters detect drops and misrouting in the fabric. The resulting statistics enable quick debugging and isolation of application connectivity issues. Atomic counters require an active fabric Network Time Protocol (NTP) policy. Atomic counters work for either IPv6 or IPv4 source and destination addresses but not across different address families.
For example, an administrator can enable atomic counters on all leaf switches to trace packets from endpoint 1 to endpoint 2. If any leaf switches have nonzero counters, other than the source and destination leaf switches, an administrator can drill down to those leaf switches.
In conventional settings, it is nearly impossible to monitor the amount of traffic from a baremetal NIC to a specific IP address (an endpoint) or to any IP address. Atomic counters allow an administrator to count the number of packets that are received from a baremetal endpoint without any interference to its data path. In addition, atomic counters can monitor per-protocol traffic that is sent to and from an endpoint or an application group.
Leaf-to-leaf (TEP to TEP) atomic counters can provide the following:
Counts of drops, admits, and excess packets.
Short-term data collection such as the last 30 seconds, and long-term data collection such as 5 minutes, 15 minutes, or more.
A breakdown of per-spine traffic is available only when the number of TEPs, leaf or VPC, is less than 64.
Ongoing monitoring.
 Note |
Leaf-to-leaf (TEP to TEP) atomic counters are cumulative and cannot be cleared. However, because 30-second atomic counters reset at 30-second intervals, they can be used to isolate intermittent or recurring problems. |
Tenant atomic counters can provide the following:
Application-specific counters for traffic across the fabric, including drops, admits, and excess packets
Modes include the following:
Endpoint-to-endpoint MAC address, or endpoint-to-endpoint IP address. Note that a single target endpoint could have multiple IP addresses associated with it.
EPG to EPG
EPG to endpoint
EPG to * (any)
Endpoint to external IP address
Note |
Use of atomic counters is not supported when the endpoints are in different tenants or in different Virtual Routing and Forwarding (VRF) instances (also known as contexts or private networks) within the same tenant. Atomic counters work for IPv6 source and destinations but configuring source and destination IP addresses across IPv4 and IPv6 addresses is not allowed. |
Real-time digital optical monitoring (DOM) data is collected from SFPs, SFP+, and XFPs periodically and compared with warning and alarm threshold table values. The DOM data collected are transceiver transmit bias current, transceiver transmit power, transceiver receive power, and transceiver power supply voltage.
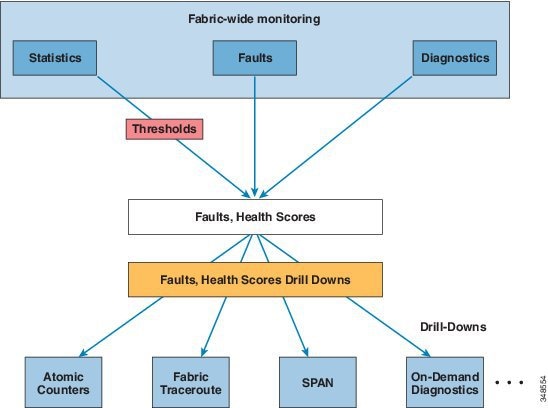
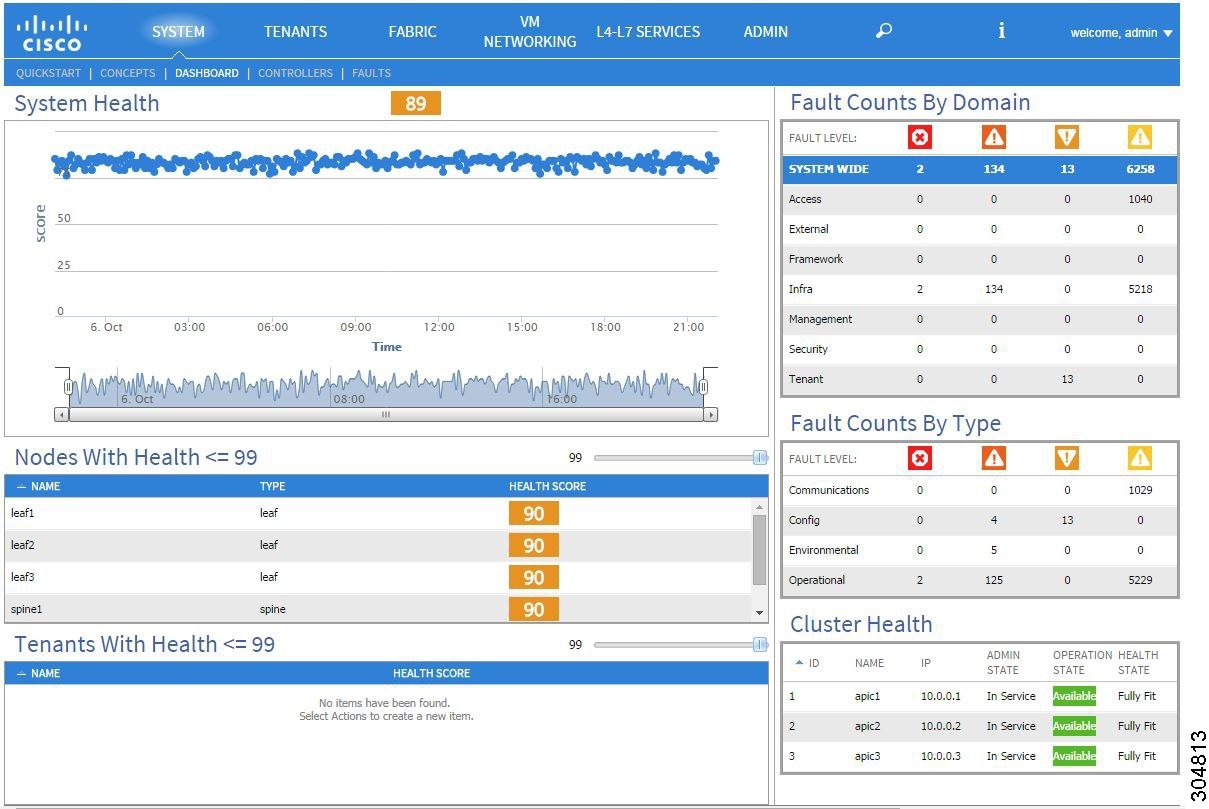
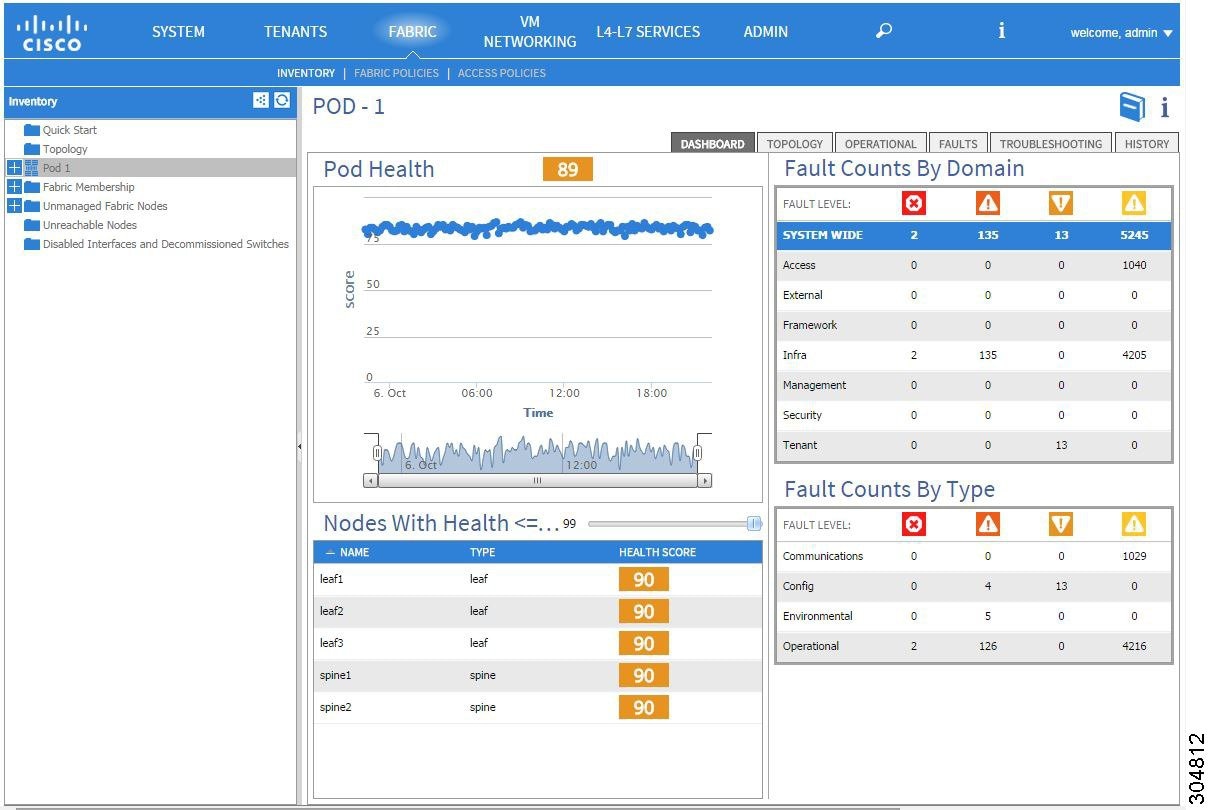
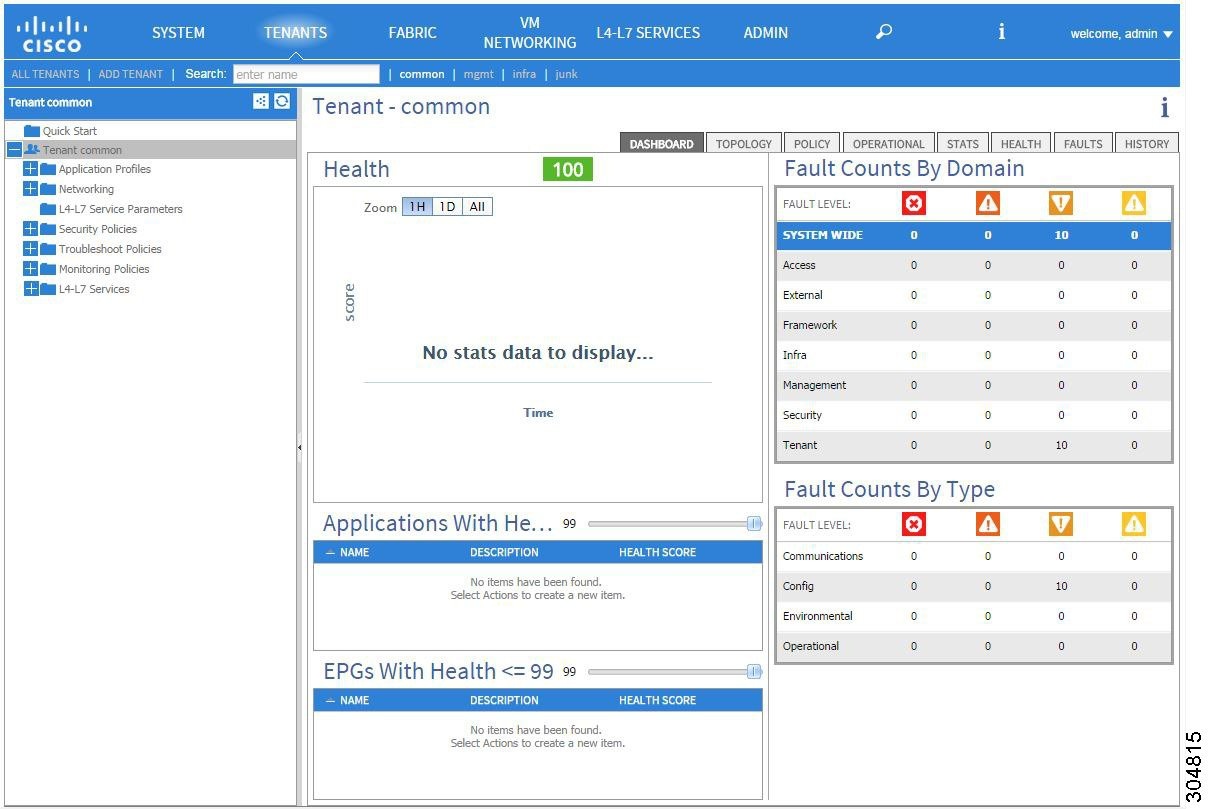
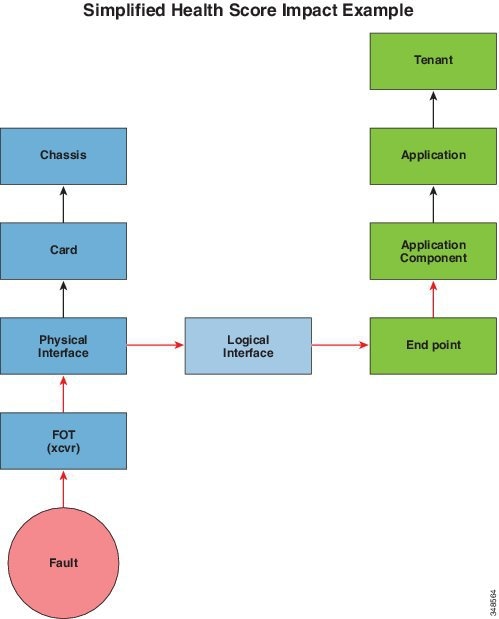
The ACI fabric uses a policy model to combine data into a health score. Health scores can be aggregated for a variety of areas such as for the system, infrastructure, tenants, applications, or services.
System — aggregation of system-wide health, including pod health scores, tenant health scores, system fault counts by domain and type, and the APIC cluster health state.
Pod — aggregation of health scores for a pod (a group of spine and leaf switches), and pod-wide fault counts by domain and type.
Tenant — aggregation of health scores for a tenant, including performance data for objects such as applications and EPGs that are specific to a tenant, and tenant-wide fault counts by domain and type.
Managed Object — health score policies for managed objects (MOs), which includes their dependent and related MOs. These policies can be customized by an administrator.
The system and pod health scores are calculated the same way. The calculation is based on the weighted average of the leaf health scores divided by the total number of learned end points of the leaf switches times the spine coefficient which is derived from the number of spines and their health scores.
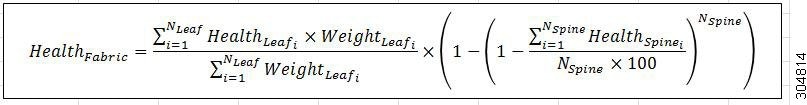
The following legend defines the equation components.
HealthLeafi is the health score of the leaf switch.
WeightLeafi is the number of end-points on the leaf switch.
NLeaf is the number of leaf switches in the fabric.
HealthSpinei is the health score of the spine switch.
NSpine is the number of spine switches in the fabric.
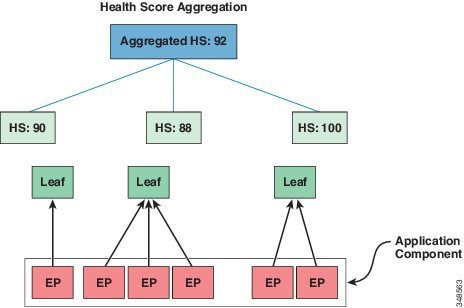
For example, an EPG could be using ports of two leaf switches. Each leaf switch would contain a deployed EPG component. The number of learned endpoints is a weighting factor. Each port could have a different number of learned endpoints. So the EPG health score would be derived by summing the health score of each EPG component times its number of learned endpoints on that leaf, divided by the total number of learned endpoints across the leaf switches the EPG uses.
Each health score category is assigned an impact level. The five health score impact levels are Maximum, High, Medium, Low, and None. For example, the default impact level of fabric ports is Maximum and the default impact level of leaf ports is High. Certain categories of children MOs can be excluded from health score calculations of its parent MO by assigning a health score impact of None. These impact levels between objects are user configurable. However, if the default impact level is None, the administrator cannot override it.
The following factors are the various impact levels:
Maximum: 100% High: 80% Medium: 50% Low: 20% None: 0%
The category health score is calculated using an Lp -Norm formula. The health score penalty equals 100 minus the health score. The health score penalty represents the overall health score penalties of a set of MOs that belong to a given category and are children or direct relatives of the MO for which a health score is being calculated.
The health score
category of an MO class can be changed by using a policy. For example, the
default health score category of a leaf port is
eqpt:LeafP and the default health score category of
fabric ports is
eqpt:FabP. However, a policy that includes both leaf
ports and fabric ports can be made to be part of the same category called
ports.
The aggregated health score is computed at the APIC.
The APIC traffic monitoring policies can span policies at the appropriate places to keep track of all the members of each application group and where they are connected. If any member moves, the APIC automatically pushes the policy to the new leaf. For example, when an endpoint VMotions to a new leaf, the span configuration automatically adjusts.
Refer to the IETF Internet Draft at the following URL for descriptions of ERSPAN headers: https://tools.ietf.org/html/draft-foschiano-erspan-00.
The ACI fabric supports the following two extensions of remote SPAN (ERSPAN) formats:
Access or tenant SPAN—done for leaf switch front panel ports with or without using VLAN as a filter. The Broadcom Trident 2 ASIC in the leaf switches supports a slightly different version of the ERSPAN Type 1 format. It differs from the ERSPAN Type 1 format defined in the document referenced above in that the GRE header is only 4 bytes and there is no sequence field. The GRE header is always encoded with the following – 0x000088be. Even thought 0x88be indicates ERSPAN Type 2, the remaining 2 bytes of the fields identify this as an ERSPAN Type 1 packet with a GRE header of 4 bytes.
Fabric SPAN—done in leaf switches by the Northstar ASIC or by the Alpine ASIC in the spine switches. While these ASICs support ERSPAN Type 2 and 3 formats, the ACI fabric currently only supports ERSPAN Type 2 for fabric SPAN, as documented in the base-line document referenced above.
The Cisco Application Centric Infrastructure (ACI) provides extensive SNMPv1, v2, and v3 support, including Management Information Bases (MIBs) and notifications (traps). The SNMP standard allows any third-party applications that support the different MIBs to manage and monitor the ACI fabric.
SNMPv3 provides extended security. Each SNMPv3 device can be selectively enabled or disabled for SNMP service. In addition, each device can be configured with a method of handling SNMPv1 and v2 requests.
For more information about using SNMP, see the Cisco ACI MIB Quick Reference.
Note |
For a list of syslog messages that the APIC and the fabric nodes can generate, see http://www.cisco.com/c/en/us/td/docs/switches/datacenter/aci/apic/sw/1-x/syslog/guide/aci_syslog/ACI_SysMsg.html. |
Many system log messages are specific to the action that a user is performing or the object that a user is configuring or administering. These messages can be the following:
Informational messages, providing assistance and tips about the action being performed
Warning messages, providing information about system errors related to an object, such as a user account or service profile, that the user is configuring or administering
In order to receive and monitor system log messages, you must specify a syslog destination, which can be the console, a local
file, or one or more remote hosts running a syslog server. In addition, you can specify the minimum severity level of messages
to be displayed on the console or captured by the file or host. The local file for receiving syslog messages is /var/log/external/messages.
A syslog source can be any object for which an object monitoring policy can be applied. You can specify the minimum severity level of messages to be sent, the items to be included in the syslog messages, and the syslog destination.
You can change the display format for the Syslogs to NX-OS style format.
Additional details about the faults or events that generate these system messages are described in the Cisco APIC Faults, Events, and System Messages Management Guide, and system log messages are listed in the Cisco ACI System Messages Reference Guide.
Note |
Not all system log messages indicate problems with your system. Some messages are purely informational, while others may help diagnose problems with communications lines, internal hardware, or the system software. |
The Troubleshooting Wizard allows you understand and visualize how your network is behaving, which can ease your networking concerns should issues arise.
This wizard allows you (the Administrative user) to troubleshoot issues that occur during specific time frames, which can be designated by selecting two endpoints. For example, you may have two endpoints that are having intermittent packet loss but you don't understand why. Through the troubleshooting GUI, you can evaluate the issue so that you can effectively resolve it rather than logging onto each machine that you suspect to be causing this faulty behavior.
Since you may want to revisit the session later, you should give the session a unique name. You may also choose to use a pre-configured test. You can debug from endpoint to endpoint, or from an internal or external endpoint, or from an external to an internal endpoint.
Further, you can define a time window in which you want to perform the debug. The Troubleshooting GUI allows you to enter a source and destination endpoint for the endpoints you are looking for. You can do this with a MAC, IPv4, or IPv6 address and then select by tenant. You also have the option to generate a troubleshooting report that can be sent to TAC.
The following section describes the topology of the Troubleshooting Wizard, which is a simplified view of the fabric with only the elements that are relevant to your two endpoints under inspection.
Note |
For a list of Troubleshooting Wizard CLI commands, see the Cisco APIC Command-Line Interface User Guide. |
 Feedback