Cisco Patient Connect 1.6 Monitoring Guide
Available Languages
Table of Contents
Cisco Patient Connect Monitoring Guide
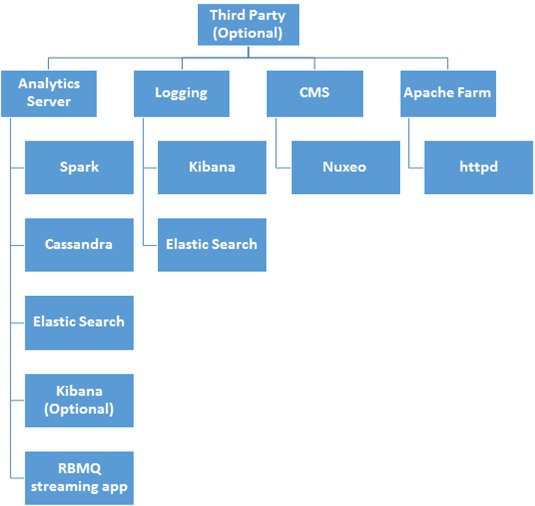
Third Party Components (Optional)
Monitored Metrics and Processes
Receiving problem notification (Alerts)
Adding an item to the Template
Configuring Item within the Template
Installing and Configuring Zabbix
Zabbix Server : (RPM installation)
Zabbix server schema creation and Seed data insert
Zabbix Frontend Configuration Wizard
Overview
This guide provides instructions on how to monitor different parameters of the Cisco Patient Connect solution.
The topics in this chapter include the following:
– Third Party Components (Optional)
Receiving problem notification (Alerts)
Configuring Item within the Template
– Installing and Configuring Zabbix
Zabbix Server : (RPM installation)
About Monitoring
Monitoring of the application has become one of the important features for the software life cycle. Monitoring not only helps in finding the software availability but also measures the performance. This in turn reduces the downtime, which means that performance/issues are resolved quicker and more efficiently so that the impact to your business bottom line is reduced. Cisco Patient Connect applications can be monitored for different parameters. Additionally, you can use a notification mechanism that allows users to configure e-mail based alerts for virtually any event. This allows a fast reaction to server problems. You can define flexible problem thresholds, called triggers, referencing values from the backend database.
Some of the advantages of monitoring are listed below:
- Gives the current system state
- Helps to identify the root cause of a problem (If any)
- Generates alerts in case of any issues
- Gives long term information trend which help in future planning/upgrades
- Provides automatic monitoring and performs actions accordingly
- Monitored items can be immediately graphed
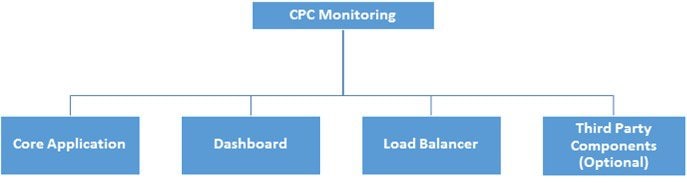
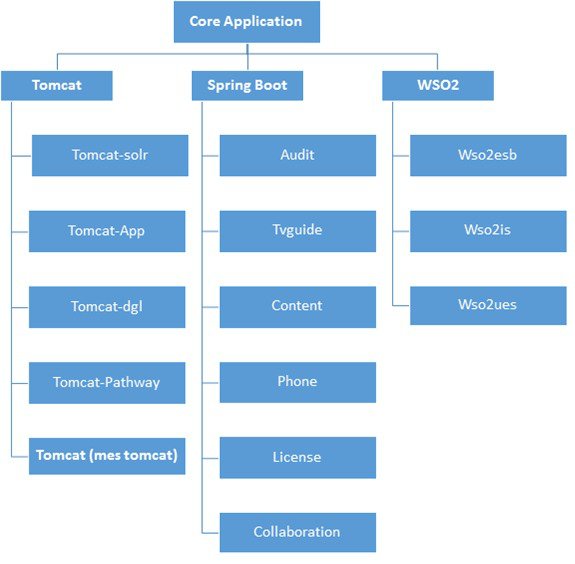
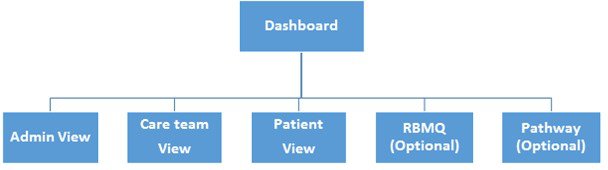
CPC Functional Structure
The following figure depicts the high-level CPC functional structure. It shows four categories of the CPC-specific components that are being monitored. Based on customer requirements, however, the monitoring components may change. Each component has sub-components, which has been explained in the following respective hierarchical diagrams.
Figure 1-1 CPC Functional Structure
Monitored Metrics and Processes
The following is the complete list of metrics that are monitored by the system. The metrics has been categorized as application metrics and process metrics. Metrics captures a value pertaining to your application at a specific point in time. Additionally, the system allows you to select the metrics that you want to monitor.
Monitoring Thresholds
Each metrics are being monitored to their respective threshold limits. This threshold limits are monitored by creating triggers/alerts for them. Thresholds are the values and frequency for the alert condition that will trigger the alert when violated. For example, you are monitoring the JMX Heap memory and you have kept a trigger when the heap memory usage is greater than 70%. Likewise, there is monitoring for the items for host/application specifically.
Triggers
Items only collect data. To automatically evaluate incoming data you need to define triggers. Triggers are the logical expression that evaluates the data gathered by items and represent the current system state. The trigger has the following values:

Note Trigger status (the expression) is recalculated every time when the monitoring tool server receives a new value that is part of the expression. You can enter the trigger details for description, which can show the additional information if required. We can include the level of severity for the below list:
Adding a Trigger
Follow these steps to add a trigger:
Step 1 Log in to your CPC monitoring application.
Step 2 Go to Configuration > Hosts.
Step 3 Find New host, and then click Triggers next to it.
The trigger definition form appears. For a trigger, the mandatory entries are:
- Name: Enter the trigger name displayed in lists and elsewhere. For example, CPU load too high on 'New host' for 3 minutes as the value.
- Expression: This is the trigger expression. Ensure that the expression is entered correctly, down to the last symbol. For example, enter New host:system.cpu.load.avg(180)}>2. The item key here, system.cpu.load, is used to refer to the item. This particular expression basically says that the problem threshold is exceeded when the CPU load average value for 3 minutes is over 2.
- URL: If not empty, the URL entered here is available as a link when clicking on the trigger name in Monitoring > Triggers.
- Enabled: Unchecking the box disables the trigger if required.
Note You can use the Expression constructor to test the trigger expression.
Step 5 Click Add. The new trigger should appear in the trigger list.
Note Once a trigger is defined, you can see its status by clicking Monitoring > Triggers. A green OK flashing in the Status column indicates that trigger statement is correct. The flashing indicates a recent change of trigger status, one that has taken place in the last 30 minutes. If a red PROBLEM is flashing in the Status column indicates that the CPU load has exceeded the threshold level you defined in the trigger.
Receiving problem notification (Alerts)
This section describes how to set up alerting in the form of notifications. With items collecting data and triggers designed to ‘fire’ upon problem situations, you can use the alerting mechanism in place that would notify users about important events even when they are not directly looking at monitoring tool frontend. This is what notifications do. E-mail being the most popular delivery method for problem notifications, the following section describes how to set up an e-mail notification.
E-mail settings
E-mail is one of the several predefined notification delivery methods.
Step 1 Log in to your CPC monitoring application.
Step 2 Go to Administration > Media types.
Step 3 Click Email in the list of predefined media types.
Step 4 Set the values of SMTP server, SMTP helo, and SMTP e-mail appropriately for your environment.
Note SMTP email' will be used as the 'From' address for the notifications sent.
Step 5 Click Update when ready.
You have configured 'Email' as a working media type. A media type must be linked to users by defining specific delivery addresses, otherwise it will not be used.
Note Similarly, we can also implement the other notification options that are available – Jabber and SMS.
Create New Action
If you want some operations taking place as a result of events (for example, notifications sent), you need to configure actions. Therefore, to set up a notification, go to Configuration > Actions and click Create action.
The action is divided in the following three parts:
- Verify that both the e-mail settings and the action have been configured properly.
- Ensure that the user you created has at least read permissions on the host which generated the event, as noted in the Adding user step. The user who is part of the Network administrators user group, must have at least read access to Linux servers host group that your host belongs to.
- Additionally, you can check out the action log by going to Administration > Audit, and choosing Actions in the drop-down menu, located in the upper right corner.
Templates
A template is a set of entities that can be conveniently applied to multiple hosts.
Template is important because, after you create the template once, it can be applied to any of the hosts. This saves lot of manual effort for configuring the host. Templates allow to group useful items, triggers and other entities so that those can be reused again and again by applying to hosts in a single step.
When a template is linked to a host, the host not only inherits all entities of the template but, it also enables quickly to verify the predefined bunch of checks.
Note Templates have already been applied in CPC. You can, however, export the template and apply it to a new one.
The entities that the template can hold are mentioned below:
Adding a Template
Follow these steps to add a template:
Step 1 Log in to your CPC monitoring application.
Step 2 Go to Configuration > Templates.
A template configuration form opens.
Step 4 Enter a template name. Alpha-numerical, spaces, and underscores are allowed.
Step 5 Select one or several groups from the right hand side panel, and then click « to move them to the In groups panel.
Note The template must belong to a group.
Your new template should be visible in the list of templates.
Adding an item to the Template
Follow these steps to add an item to the template:
Step 1 Add a template as explain in the Adding a Template section.
Step 2 Go to the item list for 'New host'.
Step 3 In Configuration > Hosts click the items next to 'New host', and do the following:
- Mark the checkbox of the 'CPU Load' item in the list.
- Select Copy selected to… in the dropdown below the list and click Go.
- Select the template to copy item to.
- Click Copy. If you now go to Configuration > Templates, 'New template' should have one new item in it.
Note In case you want to apply any specific template, you can download it from the Zabbix official template directory.
- https://www.zabbix.org/wiki/Zabbix_Templates/Official_Templates#Zabbix_2.4.7
- https://monitoringartist.github.io/zabbix-searcher/
Configuring Item within the Template
Note While designing the configuration it is better to design in the pattern follows: Create Template -> Create Item -> Create Trigger -> Create Action.
Linking Template to host
If we have an already created template, it only remains to add it to a host:
Step 1 Go to Configuration > Hosts.
Step 2 Click New host to open its property form, and then click the Templates tab.
Step 3 Click Select next to ‘Link new templates’.
Step 4 In the pop-up window, click the name of template you have created ('New template').
Step 5 As it appears in the ‘Link new templates’ field, click Add. The template should appear in the Linked templates list.
Step 6 Click Update in the form to save the changes. The template is now added to the host, with all entities that it holds.
Note As you may have guessed, this way it can be applied to any other host as well. Any changes to the items, triggers and other entities at the template level will propagate to the hosts the template is linked to.
About Zabbix
Zabbix is software that monitors numerous parameters of a network and the health and integrity of servers. Zabbix uses a flexible notification mechanism that allows users to configure e-mail based alerts for virtually any event. This allows a fast reaction to server problems. Zabbix offers excellent reporting and data visualisation features based on the stored data. This makes Zabbix ideal for capacity planning and integration with CPC.
Note Refer to https://www.zabbix.com/ for additional details.
Installing and Configuring Zabbix
Zabbix requires both physical and disk memory. 128 MB of physical memory and 256 MB of free disk space could be a good starting point. However, the amount of required disk memory obviously depends on the number of hosts and parameters that are being monitored. Installation of CPC is done through 2 processes.
Zabbix Server : (RPM installation)
Step 1 rpm -ivh http://repo.zabbix.com/zabbix/3.0/rhel/7/x86_64/zabbix-release-3.0-1.el7.noarch.rpm
Step 2 yum install zabbix-server-pgsql zabbix-web-pgsql
Step 3 yum install zabbix-agent
Step 4 yum install zabbix-java-gateway.x86_64
Step 5 yum install zabbix-web-pgsql.noarch
PostgreSQL Installation
Step 1 yum install http://yum.postgresql.org/9.4/fedora/fedora-20-x86_64/pgdg-fedora94-9.4-1.noarch.rpm
Step 2 yum install postgresql94-server
Step 3 Initialize postgres DB - service postgresql-9.4 initdb
Step 4 Configure postgres to auto start on boot/restart - chkconfig postgresql-9.4 on
Step 5 Start postgres DB - service postgresql-9.4 start
 Feedback
Contact Cisco
- Open a Support Case

- (Requires a Cisco Service Contract)