Cisco Connected Grid Design Suite (CGDS) Substation Workbench Monitor User Guide
Bias-Free Language
The documentation set for this product strives to use bias-free language. For the purposes of this documentation set, bias-free is defined as language that does not imply discrimination based on age, disability, gender, racial identity, ethnic identity, sexual orientation, socioeconomic status, and intersectionality. Exceptions may be present in the documentation due to language that is hardcoded in the user interfaces of the product software, language used based on RFP documentation, or language that is used by a referenced third-party product. Learn more about how Cisco is using Inclusive Language.
- Updated:
- October 9, 2013
Chapter: Monitoring the Substation Network
Monitoring the Substation Network
The Cisco Connected Grid Design Suite (CGDS) - Substation Workbench Monitor (CGDS Monitor) allows you to visualize, validate, and monitor the substation LAN before and after the installation in a substation.
•![]() Discovering the Substation Topology Details
Discovering the Substation Topology Details
•![]() Importing the Network Details
Importing the Network Details
•![]() Validating the Network Details
Validating the Network Details
About Network Monitoring
With the CGDS Monitor, you can visualize the communications network in relation to the automated substation by analyzing configurations for the IP-enabled LAN devices, such as intelligent electronic devices (IEDs), switches, and so on.
In addition, you can analyse the critical system problems and network performance degradation by recording the IED packet captures, viewing the alarm summary graph for the system alerts, and evaluating traffic in the substation network. Therefore, you can track anomalies and performance metrics, and notify staff of issues that require attention.
•![]() Network Monitoring Task Details
Network Monitoring Task Details
Network Monitoring Task Details
You can visualize, validate, and monitor the integrated substation LAN by performing tasks that are listed in Table 3-1
|
|
|
|---|---|
1. |
You need to import the following substation network details into the CGDS Monitor: • You can import these details by using one of the following methods: – For more information on designing a substation topology using the CGDS Designer, see the Cisco Connected Grid Design Suite - Substation Workbench Designer User Guide. – For more information on performing an auto-discovery, see the "Discovering the Substation Topology Details" section. • In the CGDS Monitor, these details are used for displaying the signal matrix details. • In the CGDS Monitor, these details are used for displaying the IED's value analysis information. For more information on importing the substation network details, see the "Importing the Network Details" section. |
2. |
After importing the substation network details, you can validate the following details: • The IED connection status appears as connected if the IED is securely connected, whereas the status appears as not connected if the IED is not connected. The IED may not be connected because of the following reasons: – – – – • – – – – • For more information on validating the substation network details, see the "Validating the Network Details" section. |
3. |
After importing and validating the substation network details, you can now visualize and monitor the network by viewing the following details: • You can view detailed information about the device's host performance, value analysis, device properties, IED communications path, and response time analysis. • • • • For more information on viewing the substation network details, see the "Viewing the Network Details" section. |
Substation Topology Diagram
In the CGDS Monitor, you can view the substation topology diagram that allows you to analyse all of the network devices in a graphical view. You can click a device in the diagram, and view detailed information about each of the devices in the following panes:
•![]() Network Tree View—Displays a tree view of all of the network devices in a substation.
Network Tree View—Displays a tree view of all of the network devices in a substation.
•![]() Device Properties—Displays detailed information about the specific device that you select in the substation topology diagram.
Device Properties—Displays detailed information about the specific device that you select in the substation topology diagram.
•![]() IED Communication Path—Displays the communication path details of the specific GOOSE or DNP3 IED that you select in the substation topology diagram.
IED Communication Path—Displays the communication path details of the specific GOOSE or DNP3 IED that you select in the substation topology diagram.
You can also choose the following views for displaying the diagram:
•![]() Topological view—Displays a topology view of the network devices in a substation.
Topological view—Displays a topology view of the network devices in a substation.
•![]() Auto-bay view—Displays a large amount of network information for the devices that are attached at certain voltages.
Auto-bay view—Displays a large amount of network information for the devices that are attached at certain voltages.
The substation topology diagram allows you to analyse and monitor configurations for all of the network devices in your substation.
•![]() Substation Topology Diagram - Icon Details
Substation Topology Diagram - Icon Details
•![]() Substation Topology Diagram - Toolbar Details
Substation Topology Diagram - Toolbar Details
Substation Topology Diagram - Icon Details

Substation Topology Diagram - Toolbar Details


Discovering the Substation Topology Details
You can perform an auto-discovery of the IP-enabled devices in an existing substation. After the auto-discovery process is complete, a substation topology is automatically created in an XML file, which you can import into the CGDS Monitor.
To automatically discover the substation topology details, perform the following steps:
Step 1 ![]() Log in to the CGDS Monitor.
Log in to the CGDS Monitor.
For more information on logging in to the CGDS Monitor, see the "Logging In" section in Chapter 1 "Getting Started".
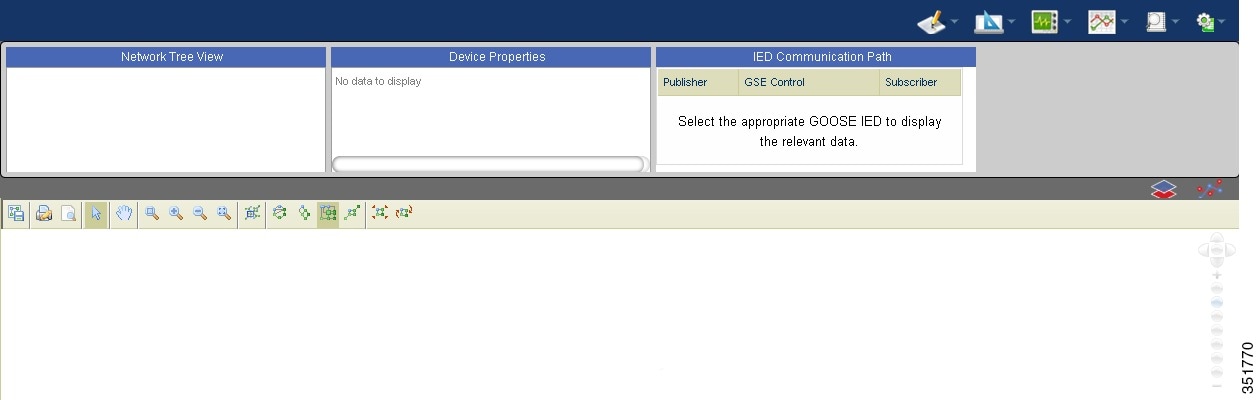
The CGDS Monitor home page appears.
Figure 3-1 CGDS Monitor - Home Page
Step 2 ![]() To start the auto-discovery process, from the AutoDiscovery menu, choose Start Auto Discovery.
To start the auto-discovery process, from the AutoDiscovery menu, choose Start Auto Discovery.
A message appears indicating that the auto-discovery process is started.
Step 3 ![]() To view the auto-discovery status, from the AutoDiscovery menu, choose View Auto Discovery Status.
To view the auto-discovery status, from the AutoDiscovery menu, choose View Auto Discovery Status.
The Auto Discovery dialog box appears with details about the status of the auto-discovery process.
Step 4 ![]() To view and download the discovered substation topology details, from the AutoDiscovery menu, choose Download Auto Discovery Output.
To view and download the discovered substation topology details, from the AutoDiscovery menu, choose Download Auto Discovery Output.
The generated XML file is downloaded to your local system.
You can use this file to import the discovered substation topology details into the CGDS Monitor. For more information on importing the discovered substation topology details into the CGDS Monitor, see the "Importing the Substation Topology Details" section.
Importing the Network Details
You need to import details about the substation topology, signal matrix, and IED information of the network devices.
•![]() Importing the Substation Topology Details
Importing the Substation Topology Details
•![]() Importing the Signal Matrix Details
Importing the Signal Matrix Details
•![]() Importing the IED Information Details
Importing the IED Information Details
Importing the Substation Topology Details
To import the substation topology details, perform the following steps:
Step 1 ![]() Log in to the CGDS Monitor.
Log in to the CGDS Monitor.
For more information on logging in to the CGDS Monitor, see the "Logging In" section in Chapter 1 "Getting Started".
The CGDS Monitor home page (see Figure 3-1) appears.
Step 2 ![]() From the Import menu, choose Import Substation Topology.
From the Import menu, choose Import Substation Topology.
The Import Substation Topology Data dialog box appears.
Step 3 ![]() Click Browse to browse for one of the following XML files:
Click Browse to browse for one of the following XML files:
•![]() XML file that is created using the auto-discovery feature of the CGDS Monitor.
XML file that is created using the auto-discovery feature of the CGDS Monitor.
For more information on the auto-discovery feature of the CGDS Monitor, see the "Discovering the Substation Topology Details" section.
•![]() XML file that is created using the CGDS Designer.
XML file that is created using the CGDS Designer.
For more information on the CGDS Designer, see the Cisco Connected Grid Design Suite - Substation Workbench Designer User Guide.
Step 4 ![]() Click Upload.
Click Upload.
The progress bar indicates the progress of the file import. After the file is imported into the CGDS Monitor, a substation topology diagram appears in the CGDS Monitor home page. For more information on viewing the substation topology details, see the "Viewing the Substation Topology Details" section.
Importing the Signal Matrix Details
To import the signal matrix details, perform the following steps:
Step 1 ![]() Log in to the CGDS Monitor.
Log in to the CGDS Monitor.
For more information on logging in to the CGDS Monitor, see the "Logging In" section in Chapter 1 "Getting Started".
The CGDS Monitor home page (see Figure 3-1) appears.
Step 2 ![]() From the Import menu, choose Import Signal Matrix.
From the Import menu, choose Import Signal Matrix.
The Import Signal Matrix Data dialog box appears.
Step 3 ![]() Click Browse to browse for the file, and click Upload.
Click Browse to browse for the file, and click Upload.
The progress bar indicates the progress of the file import. After the file is imported into the CGDS Monitor, you can view the signal matrix details of the IED connections. For more information on viewing the signal matrix details, see the "Viewing the Signal Matrix Details" section.
Importing the IED Information Details
To import the IED information details, perform the following steps:
Step 1 ![]() Log in to the CGDS Monitor.
Log in to the CGDS Monitor.
For more information on logging in to the CGDS Monitor, see the "Logging In" section in Chapter 1 "Getting Started".
The CGDS Monitor home page (see Figure 3-1) appears.
Step 2 ![]() From the Import menu, choose Import IED Information.
From the Import menu, choose Import IED Information.
The Import IED Information Data dialog box appears.
Step 3 ![]() Click Browse to browse for the file, and click Upload.
Click Browse to browse for the file, and click Upload.
The progress bar indicates the progress of the file import. After the file is imported into the CGDS Monitor, you can view the IED information details. For more information on viewing the IED information details, see the "Viewing the IED Information Details" section.
Validating the Network Details
After importing the substation network details into the CGDS Monitor, you can validate the IED connections, switch connections, and VLAN information.
•![]() Validating the IED Connectivity
Validating the IED Connectivity
•![]() Validating the Switch Connectivity
Validating the Switch Connectivity
•![]() Validating the VLAN Information
Validating the VLAN Information
Validating the IED Connectivity
To validate the IED connectivity, perform the following steps:
Step 1 ![]() Log in to the CGDS Monitor.
Log in to the CGDS Monitor.
For more information on logging in to the CGDS Monitor, see the "Logging In" section in Chapter 1 "Getting Started".
The CGDS Monitor home page (see Figure 3-1) appears.
Step 2 ![]() To start validating the IED connections, from the Validate menu, choose Validate IED Connectivity > Start Test.
To start validating the IED connections, from the Validate menu, choose Validate IED Connectivity > Start Test.
A message appears with the status of the IED connectivity test.
Step 3 ![]() To view the IED connectivity details, from the Validate menu, choose Validate IED Connectivity > View Result.
To view the IED connectivity details, from the Validate menu, choose Validate IED Connectivity > View Result.

Note ![]() The Start Test and View Result options are disabled after you start the test. These options are automatically enabled after the validation process is complete.
The Start Test and View Result options are disabled after you start the test. These options are automatically enabled after the validation process is complete.
The IED Connection Information dialog box appears with the following details:
•![]() Latest running—Last time when the IED connectivity test was run.
Latest running—Last time when the IED connectivity test was run.
•![]() IED Name—Name of the IED.
IED Name—Name of the IED.
•![]() IED Port Index—Access point for the IED that is connected to a switch.
IED Port Index—Access point for the IED that is connected to a switch.
•![]() IED Connection Status—Status about the IED connectivity as follows:
IED Connection Status—Status about the IED connectivity as follows:
–![]() Connected—If the IED is securely connected or as expected.
Connected—If the IED is securely connected or as expected.
–![]() Not Connected—If the IED is not connected. For more information on the IED connection status, see Table 3-1.
Not Connected—If the IED is not connected. For more information on the IED connection status, see Table 3-1.
•![]() IP Address—IP address for the DNP3 IED.
IP Address—IP address for the DNP3 IED.
•![]() MAC Address—MAC address for the GOOSE IED.
MAC Address—MAC address for the GOOSE IED.
Validating the Switch Connectivity
To validate the switch connectivity, perform the following steps:
Step 1 ![]() Log in to the CGDS Monitor.
Log in to the CGDS Monitor.
For more information on logging in to the CGDS Monitor, see the "Logging In" section in Chapter 1 "Getting Started".
The CGDS Monitor home page (see Figure 3-1) appears.
Step 2 ![]() To start the switch connectivity test, from the Validate menu, choose Validate Switch Connectivity > Start Test.
To start the switch connectivity test, from the Validate menu, choose Validate Switch Connectivity > Start Test.
A message appears with the status of the switch connectivity test.
Step 3 ![]() To view the switch connectivity details, from the Validate menu, choose Validate Switch Connectivity > View Result.
To view the switch connectivity details, from the Validate menu, choose Validate Switch Connectivity > View Result.
Note ![]() The Start Test and View Result options are disabled after you start the test. These options are automatically enabled after the validation process is complete.
The Start Test and View Result options are disabled after you start the test. These options are automatically enabled after the validation process is complete.
All of the switches in the network are validated, and the substation topology diagram is updated. In the substation topology diagram, the reachable switches appear with the  icon, whereas the unreachable switches appear with the
  icon.
icon.
Validating the VLAN Information
To validate the VLAN information, perform the following steps:
Step 1 ![]() Log in to the CGDS Monitor.
Log in to the CGDS Monitor.
For more information on logging in to the CGDS Monitor, see the "Logging In" section in Chapter 1 "Getting Started".
The CGDS Monitor home page (see Figure 3-1) appears.
Step 2 ![]() From the Validate menu, choose Validate VLAN Information.
From the Validate menu, choose Validate VLAN Information.
The VLAN Information dialog box appears with the following details:
•![]() VLAN information for all of the supported and reachable switches.
VLAN information for all of the supported and reachable switches.
•![]() Default VLAN ID.
Default VLAN ID.
•![]() Ports that are connected to the switches.
Ports that are connected to the switches.
Viewing the Network Details
After importing and validating the substation network details, you can now visualize and monitor the network.
•![]() Viewing the Substation Topology Details
Viewing the Substation Topology Details
•![]() Viewing the IED Information Details
Viewing the IED Information Details
•![]() Viewing the IED Information Details
Viewing the IED Information Details
•![]() Viewing the Network Traffic Analysis
Viewing the Network Traffic Analysis
•![]() Viewing the Signal Matrix Details
Viewing the Signal Matrix Details
•![]() Analyzing the IED Packet Captures
Analyzing the IED Packet Captures
Viewing the Substation Topology Details
To view the substation topology diagram of all of the network devices, perform the following steps:
Step 1 ![]() Log in to the CGDS Monitor.
Log in to the CGDS Monitor.
For more information on logging in to the CGDS Monitor, see the "Logging In" section in Chapter 1 "Getting Started".
The CGDS Monitor home page (see Figure 3-1) appears.
Step 2 ![]() Import the network details into the CGDS Monitor.
Import the network details into the CGDS Monitor.
For more information on importing the network details, see the "Importing the Network Details" section.
The substation topology diagram appears with a graphical view of all of the network devices. By default, the substation topology diagram appears in a topological view.
Step 3 ![]() To display the substation topology diagram in an auto-bay view, click the
To display the substation topology diagram in an auto-bay view, click the  icon.
icon.
To display the substation topology diagram in a topological view, click the  icon.
icon.
For more information on the icons that are used in the substation topology diagram, see Table 3-2.
Step 4 ![]() Validate the network.
Validate the network.
For more information on validating the network, see the "Validating the Network Details" section.
The IED connections, switch connections, and VLAN information details are validated.
Step 5 ![]() Click a device in the substation topology diagram and view detailed information about the selected device in the Network Tree View, Device Properties, and IED Communication Path panes.
Click a device in the substation topology diagram and view detailed information about the selected device in the Network Tree View, Device Properties, and IED Communication Path panes.
For more information on the Network Tree View, Device Properties, and IED Communication Path panes, see the "Substation Topology Diagram" section.
Step 6 ![]() To perform additional tasks in the substation topology diagram, such as downloading or printing the diagram, changing the layout of the diagram, or viewing specific sections of the diagram, use the toolbar options that are listed in Table 3-2.
To perform additional tasks in the substation topology diagram, such as downloading or printing the diagram, changing the layout of the diagram, or viewing specific sections of the diagram, use the toolbar options that are listed in Table 3-2.
Viewing the IED Information Details
•![]() Viewing the GOOSE IED Details
Viewing the GOOSE IED Details
Viewing the GOOSE IED Details
You can view the following details about the GOOSE IEDs:
•![]() Host performance—Graphical analysis of the IED's network performance.
Host performance—Graphical analysis of the IED's network performance.
•![]() Value analysis—Captures all of the signals and GOOSE messages that are received or sent by the IED.
Value analysis—Captures all of the signals and GOOSE messages that are received or sent by the IED.
•![]() Information path—Path that captures the signals that are processed by the GOOSE IED to communicate with other connected IEDs.
Information path—Path that captures the signals that are processed by the GOOSE IED to communicate with other connected IEDs.
To view details about the GOOSE IEDs, perform the following steps:
Step 1 ![]() In the substation topology diagram, select a GOOSE IED, which appears with the
In the substation topology diagram, select a GOOSE IED, which appears with the  icon.
icon.
For more information on displaying the substation topology diagram, see the "Viewing the Substation Topology Details" section.
The selected GOOSE IED details appear in the Network Tree View, Device Properties, and IED Communication Path panes in the CGDS Monitor home page.
For more information on the Network Tree View, Device Properties, and IED Communication Path panes, see the "Substation Topology Diagram" section.
Step 2 ![]() To view the IED's host performance, right-click the specific GOOSE IED, and click Host Performance.
To view the IED's host performance, right-click the specific GOOSE IED, and click Host Performance.
The Host Performance dialog box appears with a graphical analysis of the network performance for the selected IED.
Step 3 ![]() To view the IED's value analysis details, right-click the specific GOOSE IED, and click Value Analysis.
To view the IED's value analysis details, right-click the specific GOOSE IED, and click Value Analysis.
The Value Analysis dialog box appears with the following details for the selected IED:
•![]() Input details—Input signal details that are received by the selected IED:
Input details—Input signal details that are received by the selected IED:
–![]() Inputs
Inputs
–![]() External Data Reference
External Data Reference
–![]() Value
Value
–![]() Internal Data Reference
Internal Data Reference
•![]() Output details—Output signal details that are sent by the selected IED:
Output details—Output signal details that are sent by the selected IED:
–![]() GOOSE CBName
GOOSE CBName
–![]() Output Data Reference
Output Data Reference
–![]() Value
Value
Step 4 ![]() View the IED's information path details:
View the IED's information path details:
a. ![]() Right-click the specific GOOSE IED, and click Information Path.
Right-click the specific GOOSE IED, and click Information Path.
The information path details appear in the IED Communication Path pane.
You can clear the IED information path details from the IED Information Path pane for viewing the information path details of another IED.
b. ![]() To clear the IED information path details from the IED Information Path pane, from the Validate menu, choose Clear IED Information Path.
To clear the IED information path details from the IED Information Path pane, from the Validate menu, choose Clear IED Information Path.
The IED Information Path pane is cleared. You can now view the updated details for the selected IED.
Viewing the DNP3 IED Details
You can view the following details about the DNP3 IEDs:
•![]() Host performance—Graphical analysis of the IED's network performance.
Host performance—Graphical analysis of the IED's network performance.
•![]() Response time analysis—Graphical analysis of the performance details of the server that has the longest response time. The data appears in microseconds.
Response time analysis—Graphical analysis of the performance details of the server that has the longest response time. The data appears in microseconds.
To view details about the DNP3 IEDs, perform the following steps:
Step 1 ![]() In the substation topology diagram, select a DNP3 IED, which appears with the
In the substation topology diagram, select a DNP3 IED, which appears with the  icon.
icon.
For more information on displaying the substation topology diagram, see the "Viewing the Substation Topology Details" section.
The specific DNP3 IED details appear in the Network Tree View and Device Properties panes in the CGDS Monitor home page.
For more information on the Network Tree View and Device Properties panes, see the "Substation Topology Diagram" section.
Step 2 ![]() To view the IED's host performance, right-click the specific DNP3 IED, and click Host Performance.
To view the IED's host performance, right-click the specific DNP3 IED, and click Host Performance.
The Host Performance dialog box appears with a graphical analysis of the network performance for the selected IED.
Step 3 ![]() To view the IED's response time analysis, right-click the specific DNP3 IED, and click Response Time Analysis.
To view the IED's response time analysis, right-click the specific DNP3 IED, and click Response Time Analysis.
The Response Time Analysis dialog box appears with the following details:
•![]() Input details—Input signal details that are received by the selected IED:
Input details—Input signal details that are received by the selected IED:
–![]() Inputs
Inputs
–![]() External Data Reference
External Data Reference
–![]() Value
Value
–![]() Internal Data Reference
Internal Data Reference
•![]() Output details—Output signal details that are sent by the selected IED:
Output details—Output signal details that are sent by the selected IED:
–![]() GOOSE CBName
GOOSE CBName
–![]() Output Data Reference
Output Data Reference
–![]() Value
Value
Viewing the Alarm Summary
To view the alarm summary graph, perform the following steps:
Step 1 ![]() Log in to the CGDS Monitor.
Log in to the CGDS Monitor.
For more information on logging in to the CGDS Monitor, see the "Logging In" section in Chapter 1 "Getting Started".
The CGDS Monitor home page (see Figure 3-1) appears.
Step 2 ![]() Import the network details into the CGDS Monitor.
Import the network details into the CGDS Monitor.
For more information on importing the network details, see the "Importing the Network Details" section.
The substation topology diagram appears with a graphical view of all of the network devices.
Step 3 ![]() Validate the network.
Validate the network.
For more information on validating the network, see the "Validating the Network Details" section.
The IED connections, switch connections, and VLAN information details are validated.
Step 4 ![]() From the Reports menu, choose View Alarm Summary.
From the Reports menu, choose View Alarm Summary.
The Alarm Summary dialog box appears with the following details:
•![]() Time filter—To filter the alarm summary details based on a specific time-period.
Time filter—To filter the alarm summary details based on a specific time-period.
•![]() Graphical representation of the alarm summary—To analyse the network performance degradation by viewing the number of alarm counts in the alarm summary graph.
Graphical representation of the alarm summary—To analyse the network performance degradation by viewing the number of alarm counts in the alarm summary graph.
Viewing the Network Traffic Analysis
To view the network traffic analysis graph, perform the following steps:
Step 1 ![]() Log in to the CGDS Monitor.
Log in to the CGDS Monitor.
For more information on logging in to the CGDS Monitor, see the "Logging In" section in Chapter 1 "Getting Started".
The CGDS Monitor home page (see Figure 3-1) appears.
Step 2 ![]() Import the network details into the CGDS Monitor.
Import the network details into the CGDS Monitor.
For more information on importing the network details, see the "Importing the Network Details" section.
The substation topology diagram appears with a graphical view of all of the network devices.
Step 3 ![]() Validate the network.
Validate the network.
For more information on validating the network, see the "Validating the Network Details" section.
The IED connections, switch connections, and VLAN information details are validated.
Step 4 ![]() From the Reports menu, choose View Traffic Analysis.
From the Reports menu, choose View Traffic Analysis.
The Traffic Analysis dialog box appears with the following details:
•![]() Time filter—To filter the network traffic details based on a specific time period.
Time filter—To filter the network traffic details based on a specific time period.
•![]() Graphical representation of the network traffic details—To analyse the network traffic type and volume by evaluating the traffic based on the specific encapsulation protocols or VLAN information.
Graphical representation of the network traffic details—To analyse the network traffic type and volume by evaluating the traffic based on the specific encapsulation protocols or VLAN information.
Viewing the Signal Matrix Details
To view the signal matrix details, perform the following steps:
Step 1 ![]() Log in to the CGDS Monitor.
Log in to the CGDS Monitor.
For more information on logging in to the CGDS Monitor, see the "Logging In" section in Chapter 1 "Getting Started".
The CGDS Monitor home page (see Figure 3-1) appears.
Step 2 ![]() Import the network details into the CGDS Monitor.
Import the network details into the CGDS Monitor.
For more information on importing the network details, see the "Importing the Network Details" section.
The substation topology diagram appears with a graphical view of all of the network devices.
Step 3 ![]() Validate the network.
Validate the network.
For more information on validating the network, see the "Validating the Network Details" section.
The IED connections, switch connections, and VLAN information details are validated.
Step 4 ![]() From the Monitor menu, choose View Signal Matrix.
From the Monitor menu, choose View Signal Matrix.
The Signal Matrix dialog box appears with the following details:
•![]() IED Name—Name of the IED.
IED Name—Name of the IED.
•![]() Inputs—Input name.
Inputs—Input name.
•![]() External Data Reference—IED reference point that sends the signal.
External Data Reference—IED reference point that sends the signal.
•![]() Internal Data Reference—IED reference point that receives the signal.
Internal Data Reference—IED reference point that receives the signal.
Analyzing the IED Packet Captures
You can analyze the critical system problems and network performance degradation by recording the IED packet captures for the GOOSE and DNP3 messages that are sent across the network.
To analyse the IED packet captures, you need to first enable the IED packet capture by starting and stopping it. After the packet capture stops, you can view the packet capture details.
The administrator can configure the auto-stop period, so that the packet capture automatically stops after the configured time interval. For more information on configuring the auto-stop period, see the "Configuring the Auto-Stop Period" section in Chapter 4 "Configuring the CGDS Monitor Settings".
To analyse the DNP3 and GOOSE packet captures, perform the following steps:
Step 1 ![]() Log in to the CGDS Monitor.
Log in to the CGDS Monitor.
For more information on logging in to the CGDS Monitor, see the "Logging In" section in Chapter 1 "Getting Started".
The CGDS Monitor home page (see Figure 3-1) appears.
Step 2 ![]() Import the network details into the CGDS Monitor.
Import the network details into the CGDS Monitor.
For more information on importing the network details, see the "Importing the Network Details" section.
The substation topology diagram appears with a graphical view of all of the network devices.
Step 3 ![]() Validate the network.
Validate the network.
For more information on validating the network, see the "Validating the Network Details" section.
The IED connections, switch connections, and VLAN information details are validated.
Step 4 ![]() Analyse the DNP3 packet captures:
Analyse the DNP3 packet captures:
a. ![]() To start the packet capture, from the Monitor menu, choose DNP Analysis > Start Packet Capture.
To start the packet capture, from the Monitor menu, choose DNP Analysis > Start Packet Capture.
A message appears indicating that the packet capture is started.
Note ![]() The Start option is disabled if the number of users exceed the maximum allowed limit of the packet captures. To enable the Start option, contact your administrator.
The Start option is disabled if the number of users exceed the maximum allowed limit of the packet captures. To enable the Start option, contact your administrator.
b. ![]() To stop the packet capture, from the Monitor menu, choose DNP Analysis > Stop Packet Capture.
To stop the packet capture, from the Monitor menu, choose DNP Analysis > Stop Packet Capture.
A message appears indicating that the packet capture is stopped.
Note ![]() If the auto-stop option is configured by the administrator, the packet capture automatically stops after the configured time interval.
If the auto-stop option is configured by the administrator, the packet capture automatically stops after the configured time interval.
c. ![]() To view the packet capture, from the Monitor menu, choose DNP Analysis > View Packet Capture.
To view the packet capture, from the Monitor menu, choose DNP Analysis > View Packet Capture.
The Packet Capture dialog box appears with messages for the selected time-period.
Step 5 ![]() Analyse the GOOSE packet captures:
Analyse the GOOSE packet captures:
a. ![]() To start the packet capture, from the Monitor menu, choose GOOSE Analysis > Start Packet Capture.
To start the packet capture, from the Monitor menu, choose GOOSE Analysis > Start Packet Capture.
A message appears indicating that the packet capture is started.
Note ![]() The Start option is disabled if the number of users exceed the maximum allowed limit of the packet captures. To enable the Start option, contact your administrator.
The Start option is disabled if the number of users exceed the maximum allowed limit of the packet captures. To enable the Start option, contact your administrator.
b. ![]() To stop the packet capture, from the Monitor menu, choose GOOSE Analysis > Stop Packet Capture.
To stop the packet capture, from the Monitor menu, choose GOOSE Analysis > Stop Packet Capture.
A message appears indicating that the packet capture is stopped.
Note ![]() If the auto-stop option is configured by the administrator, the packet capture automatically stops after the configured time interval.
If the auto-stop option is configured by the administrator, the packet capture automatically stops after the configured time interval.
c. ![]() To view the packet capture, from the Monitor menu, choose GOOSE Analysis > View Packet Capture.
To view the packet capture, from the Monitor menu, choose GOOSE Analysis > View Packet Capture.
The Packet Capture dialog box appears with messages for the selected time-period.
 Feedback