PDF(8.0 MB) View with Adobe Reader on a variety of devices
Updated:September 15, 2026
Bias-Free Language
The documentation set for this product strives to use bias-free language. For the purposes of this documentation set, bias-free is defined as language that does not imply discrimination based on age, disability, gender, racial identity, ethnic identity, sexual orientation, socioeconomic status, and intersectionality. Exceptions may be present in the documentation due to language that is hardcoded in the user interfaces of the product software, language used based on RFP documentation, or language that is used by a referenced third-party product. Learn more about how Cisco is using Inclusive Language.
First Published: March 20, 2016
Deploy a Cluster for Firewall Threat
Defense on the Firepower 4100/9300
Clustering lets you group multiple Firewall Threat Defense units together as a single logical device. A cluster provides all the convenience of
a single device (management, integration into a network) while achieving the increased
throughput and redundancy of multiple devices.
This document covers the latest Firewall Threat Defense version features; see History for clustering for details about feature changes. If you are on
an old version of software, refer to the procedures in the FXOS configuration guide
and Firepower Management Center configuration guide for your version.
Benefit of this Integration
The FXOS platform lets you run multiple logical devices, including the FTD. Deploying standalone and clustered logical devices
is easy for both intra-chassis clusters (for the Firepower 9300) and inter-chassis clusters. When you deploy a cluster from
FXOS, you pre-configure the FTD bootstrap configuration so very little customization is required within the FTD application.
You can also add additional cluster members by exporting the cluster configuration in FXOS.
Integrated Products
This table lists the products required for this integration.
Table 1. Integrated Products for Clustering
Products
Function
Minimum Version
Required?
Firepower 4100 or 9300
Hardware platform to run the FTD
FXOS 1.1(4)
Required
Firepower Chassis Manager
FXOS GUI device manager
Firepower Chassis Manager 1.1(4)
Optional; you can alternatively use the CLI
FTD
Next-generation Firewall application
Firepower 6.0.1
Required
FMC
GUI multidevice manager
Firepower 6.0.1
Required
Workflow
This workflow uses Firepower Chassis Manager on FXOS and FMC for the FTD to complete your clustering deployment.
Procedure
Step 1
FXOS tasks:
FXOS: Configure interfaces. Configure one
management and all data interfaces that you intend to assign to the FTD.
The cluster interface is defined by default as Port-Channel 48, but for
inter-chassis clustering, you need to add member interfaces. For
multi-instance clustering, you can add VLAN subinterfaces to the cluster
EtherChannel as well.
About clustering on the Firepower 4100/9300 chassis
When you deploy a cluster on the Firepower 4100/9300 chassis, it does the following:
For native instance clustering: Creates a cluster-control link (by default, port-channel 48) for node-to-node communication.
For multi-instance clustering: You should pre-configure subinterfaces on one or more cluster-type EtherChannels; each instance
needs its own cluster control link.
For a cluster isolated to security modules within one Firepower 9300 chassis, this link utilizes the Firepower 9300 backplane for cluster communications.
For clustering with multiple chassis, you need to manually assign physical interface(s) to this EtherChannel for communications
between chassis.
Creates the cluster bootstrap configuration within the application.
When you deploy the cluster, the chassis supervisor pushes a minimal bootstrap configuration to each unit that includes the
cluster name, cluster control link interface, and other cluster settings.
Assigns data interfaces to the cluster as Spanned interfaces.
For a cluster isolated to security modules within one Firepower 9300 chassis, spanned interfaces are not limited to EtherChannels, like it is for clustering with multiple chassis. The Firepower 9300 supervisor uses EtherChannel technology internally to load-balance traffic to multiple modules on a shared interface, so
any data interface type works for Spanned mode. For clustering with multiple chassis, you must use Spanned EtherChannels for all data interfaces.
Note
Individual interfaces are not supported, with the exception of a management interface.
Assigns a management interface to all units in the cluster.
Bootstrap configuration
A bootstrap configuration is a minimal cluster configuration that includes cluster name, cluster control link interface, and
other cluster settings.
When you deploy the cluster, the Firepower 4100/9300 chassis supervisor pushes a minimal bootstrap configuration to each unit that includes the cluster name, cluster control
link interface, and other cluster settings.
Cluster members
Cluster members are security devices that work together to accomplish the sharing of the security policy and traffic flows.
Cluster member roles and management
One member of the cluster is the control unit. The control unit is determined automatically. All other members are data units.
You must perform all configuration on the control unit only; the configuration is then replicated to the data units.
Some features do not scale in a cluster, and the control unit handles all traffic for those features. .
Cluster control link
Cluster control link traffic includes both control and data traffic.
For native instance clustering: The cluster control link is automatically created using the Port-channel 48 interface.
For multi-instance clustering: You should pre-configure subinterfaces on one or more cluster-type EtherChannels; each instance
needs its own cluster control link.
For a cluster isolated to security modules within one Firepower 9300 chassis, this interface has no member interfaces. This
Cluster type EtherChannel utilizes the Firepower 9300 backplane for cluster communications. For clustering with multiple chassis, you must add one or more interfaces to the EtherChannel.
For a cluster with two chassis, do not directly connect the cluster control link from one chassis to the other chassis. If
you directly connect the interfaces, then when one unit fails, the cluster control link fails, and thus the remaining healthy
unit fails. If you connect the cluster control link through a switch, then the cluster control link remains up for the healthy
unit.
Size the cluster control link
Cluster control link traffic is comprised mainly of state update and forwarded packets. The amount of traffic at any given
time on the cluster control link varies. The amount of forwarded traffic depends on the load-balancing efficacy or whether
there is a lot of traffic for centralized features.
For example:
NAT results in poor load balancing of connections, and the
need to rebalance all returning traffic to the correct units.
When membership changes, the cluster needs to rebalance a
large number of connections, thus temporarily using a large amount of cluster
control link bandwidth.
A higher-bandwidth cluster control link helps the cluster to
converge faster when there are membership changes and prevents throughput bottlenecks.
Note
If your cluster has large amounts of asymmetric (rebalanced)
traffic, then you should increase the cluster control link size.
Cluster control link redundancy
The diagram shows how to use an EtherChannel as a cluster control link in a Virtual Switching System (VSS), Virtual Port Channel
(vPC), StackWise, or StackWise Virtual environment. All links in the EtherChannel are active. When the switch is part of a
redundant system, then you can connect firewall interfaces within the same EtherChannel to separate switches in the redundant
system. The switch interfaces are members of the same EtherChannel port-channel interface, because the separate switches act
like a single switch. Note that this EtherChannel is device-local, not a Spanned EtherChannel.
Cluster control link reliability for inter-chassis clustering
To ensure cluster control link functionality, be sure the round-trip time (RTT) between units is less than 20 ms. This maximum
latency enhances compatibility with cluster members installed at different geographical sites. To check your latency, perform
a ping on the cluster control link between units.
The cluster control link must be reliable, with no out-of-order or dropped packets; for example, for inter-site deployment,
you should use a dedicated link.
Cluster control link network
The Firepower 4100/9300 chassis auto-generates the cluster control link interface IP address for each unit based on the chassis ID and slot ID: 127.2.chassis_id.slot_id. For multi-instance clusters, which typically use different VLAN subinterfaces of the same EtherChannel, the same IP address
can be used for different clusters because of VLAN separation.
The cluster control link network cannot include any routers between units; only Layer 2 switching is allowed.
Management network
We recommend connecting all units to a single management network. This network is separate from the cluster control link.
Management interface
You must assign a Management type interface to the cluster. This interface is a special individual interface as opposed to
a Spanned interface. The management interface lets you connect directly to each unit. This Management logical interface is
separate from the other interfaces on the device. It is used to set up and register the device to the Secure Firewall Management
Center. It uses its own local authentication, IP address, and static routing.
Management interface configuration
Each cluster member uses a separate IP address on the management network that you set as part of the bootstrap configuration.
Cluster interfaces
For a cluster isolated to security modules within one Firepower 9300 chassis, you can assign either physical interfaces or
EtherChannels (also known as port channels) to the cluster. The assigned interfaces are Spanned interfaces that load-balance
traffic across all cluster members.
For clustering with multiple chassis, you can only assign data EtherChannels to the cluster. These Spanned EtherChannels include
the same member interfaces on each chassis. On the upstream switch, all these interfaces are part of a single EtherChannel,
so the switch does not recognize that it is connected to multiple devices.
You can use regular firewall interfaces or IPS-only interfaces (inline sets or passive interfaces).
Individual interfaces are not supported except for a management interface.
Spanned EtherChannels
You can group one or more interfaces per chassis into an EtherChannel that spans all chassis
in the cluster. The EtherChannel aggregates the traffic across all the
available active interfaces in the
channel.
For regular firewall interfaces:A Spanned EtherChannel can be
configured in both routed and transparent firewall modes. In routed mode,
the EtherChannel is configured as a routed interface with a single IP
address. In transparent mode, the IP address is assigned to the BVI, not to
the bridge group member interface.
The EtherChannel inherently provides load balancing as part of basic operation.
For multi-instance clusters, each cluster requires dedicated data EtherChannels; you cannot
use shared interfaces or VLAN subinterfaces.
Connecting to a redundant switch system
We recommend connecting EtherChannels to a redundant switch system such as a VSS, vPC, StackWise,
or StackWise Virtual system to provide redundancy for your interfaces.
Configuration replication
All nodes in the cluster share a single configuration. You can only make
configuration changes on the control node (with the exception of the bootstrap
configuration), and changes are automatically synced to all other nodes in the
cluster.
Licenses for clustering
You assign feature licenses to the cluster as a whole, not to individual nodes. However, each node of the cluster consumes
a separate license for each feature. The clustering feature itself does not require any licenses.
Note
APEX, PLUS, and VPN-Only licenses are not supported for clustering. Before you create a cluster, remove unsupported license
assignments from the devices that will become cluster nodes.
When you add a cluster node to the Firewall Management Center, you can specify the feature licenses you want to use for the cluster. You can modify licenses for the cluster in the Devices > Device Management and the choose the Add, Cluster and then License area.
Note
If you add the cluster before the Firewall Management Center is licensed (and running in Evaluation mode), then when you license the Firewall Management Center, you can experience traffic disruption when you deploy policy changes to the cluster. Changing to licensed mode causes all
data units to leave the cluster and then rejoin.
Requirements and prerequisites for clustering
This topic provides the necessary prerequisites and hardware support details for configuring clustering on supported security
appliances.
Cluster model support
The Firewall Threat Defense supports clustering on the following models:
Firepower 9300—
You can include up to 16 nodes in the cluster. For example, you can use 1 module in 16 chassis, or 2 modules in 8 chassis, or any combination that provides a maximum of 16 modules. Supports clustering with multiple chassis and clustering isolated to security modules within one chassis.
Firepower 4100—Supported for up to 16 nodes using clustering with multiple chassis.
User roles
The following user roles are required to manage clustering configurations:
Admin
Access Admin
Network Admin
Clustering hardware and software requirements
All chassis in a cluster:
Native instance clustering—For the Firepower 4100: All chassis must be the same model. For the Firepower 9300: All security modules must be the same type. For example, if you use clustering, all modules in the Firepower 9300 must be
SM-40s. You can have different quantities of installed security modules in each chassis, although all modules present in the
chassis must belong to the cluster including any empty slots.
Container instance clustering—We recommend that you use
the same security module or chassis model for each cluster instance.
However, you can mix and match container instances on different
Firepower 9300 security module types or Firepower 4100 models in the
same cluster if required. You cannot mix Firepower 9300 and 4100
instances in the same cluster. For example, you can create a cluster
using an instance on a Firepower 9300 SM-56, SM-48, and SM-40. Or you
can create a cluster on a Firepower 4145 and a 4125.
Must run the identical FXOS and
application software except at the time of an image upgrade. Mismatched
software versions can lead to poor performance, so be sure to upgrade
all nodes in the same maintenance window.
Must include the same interface configuration for interfaces you assign to the cluster, such
as the same Management interface, EtherChannels, active interfaces,
speed and duplex, and so on. You can use different network module types
on the chassis as long as the capacity matches for the same interface
IDs and interfaces can successfully bundle in the same spanned
EtherChannel. Note that all data interfaces must be EtherChannels in
clusters with multiple chassis. If you change the interfaces in FXOS
after you enable clustering (by adding or removing interface modules, or
configuring EtherChannels, for example), then perform the same changes
on each chassis, starting with the data nodes, and ending with the
control node.
Must use the same NTP server. For Firewall Threat Defense, the Firewall Management Center must also use the same NTP server. Do not set the time manually.
Multi-instance clustering requirements
No intra-security-module/engine clustering—For a given cluster, you can only use a single container instance per security
module/engine. You cannot add 2 container instances to the same cluster if they are running on the same module.
Mix and match clusters and standalone instances—Not all container instances on a security
module/engine need to belong to a cluster. You can use some instances as
standalone or High Availability nodes. You can also create multiple
clusters using separate instances on the same security
module/engine.
All 3 modules in a Firepower 9300 must belong to the cluster—For the Firepower 9300, a cluster requires a single container
instance on all 3 modules. You cannot create a cluster using instances on module 1 and 2, and then use a native instance on
module 3, or example.
Match resource profiles—We recommend that each node in the cluster use the same resource
profile attributes; however, mismatched resources are allowed when
changing cluster nodes to a different resource profile, or when using
different models.
Dedicated cluster control link—For clusters with multiple chassis, each cluster needs a
dedicated cluster control link. For example, each cluster can use a
separate subinterface on the same cluster-type EtherChannel, or use
separate EtherChannels.
No shared interfaces—Shared-type interfaces are not supported with clustering. However, the same Management and Eventing interfaces
can used by multiple clusters.
No subinterfaces—A multi-instance cluster cannot use FXOS-defined VLAN subinterfaces. An
exception is made for the cluster control link, which can use a
subinterface of the Cluster EtherChannel.
Mix chassis models—We recommend that you use the same security module or chassis model for
each cluster instance. However, you can mix and match container
instances on different Firepower 9300 security module types or Firepower
4100 models in the same cluster if required. You cannot mix Firepower
9300 and 4100 instances in the same cluster. For example, you can create
a cluster using an instance on a Firepower 9300 SM-56, SM-48, and SM-40.
Or you can create a cluster on a Firepower 4145 and a 4125.
Maximum 6 nodes—You can use up to six container instances in a cluster.
Switch requirements
Be sure to complete the switch configuration and successfully
connect all the EtherChannels from the chassis to the switch(es) before you
configure clustering on the
Firepower 4100/9300 chassis.
Clustering is a deployment method that groups multiple security devices into a single logical unit to provide high availability
and increased throughput.
Switches for Clustering
Make sure connected switches match the MTU for both cluster data interfaces and the cluster
control link interface. You should configure the cluster control link
interface MTU to be at least 100 bytes higher than the data interface
MTU, so make sure to configure the cluster control link connecting
switch appropriately. Because the cluster control link traffic includes
data packet forwarding, the cluster control link needs to accommodate
the entire size of a data packet plus cluster traffic overhead.
In addition, we do not recommend setting the cluster
control link MTU between 2561 and 8362; due to block pool handling, this
MTU size is not optimal for system operation.
For Cisco IOS XR systems, if you want to set a non-default MTU, set the IOS XR interface
MTU to be 14 bytes higher than the cluster device MTU. Otherwise, OSPF
adjacency peering attempts may fail unless the mtu-ignore option
is used. Note that the cluster device MTU should match the IOS XR
IPv4 MTU. This adjustment is not required for Cisco Catalyst
and Cisco Nexus switches.
On the switch(es)
for the cluster control link interfaces, you can optionally enable Spanning
Tree PortFast on the switch ports connected to the cluster unit to speed up the
join process for new units.
On the switch, we recommend that you use one of the following
EtherChannel load-balancing algorithms: source-dest-ip or src-dst-mixed-ip-port (see the Cisco Nexus OS and Cisco IOS-XE
port-channel load-balance command). Do
not use a vlan keyword in the load-balance
algorithm because it can cause unevenly distributed traffic to the
devices in a cluster.
If you change the load-balancing algorithm of the EtherChannel
on the switch, the EtherChannel interface on the switch temporarily stops
forwarding traffic, and the Spanning Tree Protocol restarts. There will be a
delay before traffic starts flowing again.
Switches on the cluster control link path should not verify the L4 checksum. Redirected traffic over the cluster control link
does not have a correct L4 checksum. Switches that verify the L4 checksum could cause traffic to be dropped.
Port-channel bundling downtime should not exceed the configured
keepalive interval.
On Supervisor 2T EtherChannels, the default hash distribution algorithm is adaptive. To avoid asymmetric traffic in a VSS
design, change the hash algorithm on the port-channel connected to the cluster device to fixed:
Do not change the algorithm globally; you may want to take
advantage of the adaptive algorithm for the VSS peer link.
Firepower 4100/9300 clusters support LACP graceful convergence. So you can leave LACP graceful convergence enabled on connected Cisco Nexus switches.
When you see slow bundling of a Spanned EtherChannel on the switch, you can enable LACP rate fast for an individual interface
on the switch. FXOS EtherChannels have the LACP rate set to fast by default. Note that some switches, such as the Nexus series,
do not support LACP rate fast when performing in-service software upgrades (ISSUs), so we do not recommend using ISSUs with
clustering.
EtherChannels for Clustering
In Catalyst 3750-X Cisco IOS software versions earlier than 15.1(1)S2,
the cluster unit did not support connecting an EtherChannel to a switch
stack. With default switch settings, if the cluster unit EtherChannel is
connected cross stack, and if the control unit switch is powered down,
then the EtherChannel connected to the remaining switch will not come
up. To improve compatibility, set the stack-mac persistent
timer command to a large enough value to account
for reload time; for example, 8 minutes or 0 for indefinite. Or, you can
upgrade to more a more stable switch software version, such as
15.1(1)S2.
Spanned vs. Device-Local EtherChannel Configuration—Be sure to
configure the switch appropriately for Spanned EtherChannels vs. Device-local
EtherChannels.
Spanned EtherChannels—For cluster unit
Spanned EtherChannels, which span across all members of the
cluster, the interfaces are combined into a single EtherChannel on the switch.
Make sure each interface is in the same channel group on the switch.
Device-local EtherChannels—For cluster unit
Device-local
EtherChannels including any EtherChannels configured for
the cluster control link, be sure to configure discrete EtherChannels on the
switch; do not combine multiple cluster unit EtherChannels into one
EtherChannel on the switch.
Additional Guidelines
When significant topology changes occur (such as adding or removing an EtherChannel interface, enabling or disabling an interface
on the Firepower 4100/9300 chassis or the switch, adding an additional switch to form a VSS, vPC, StackWise, or StackWise Virtual) you should disable the health
check feature, and also disable interface monitoring for the disabled interfaces . When the topology change is complete, and
the configuration change is synced to all units, you can re-enable the health check feature.
When adding a unit to an existing cluster, or when reloading a unit, there will be a temporary, limited packet/connection
drop; this is expected behavior. In some cases, the dropped packets can hang connections; for example, dropping a FIN/ACK
packet for an FTP connection will make the FTP client hang. In this case, you need to reestablish the FTP connection.
If you use a Windows 2003 server connected to a Spanned EtherChannel interface, when the syslog server port is down, and the
server does not throttle ICMP error messages, then large numbers of ICMP messages are sent back to the cluster. These messages
can result in some units of the cluster experiencing high CPU, which can affect performance. We recommend that you throttle
ICMP error messages.
We recommend connecting EtherChannels to a VSS, vPC, StackWise, or StackWise Virtual for redundancy.
Within a chassis, you cannot cluster some security modules and run other security modules in standalone mode; you must include
all security modules in the cluster.
For decrypted TLS/SSL connections, the decryption states are not synchronized, and if the connection owner fails, then decrypted
connections will be reset. New connections will need to be established to a new unit. Connections that are not decrypted (they
match a do-not-decrypt rule) are not affected and are replicated correctly.
Defaults
The cluster health check feature is enabled by default with the holdtime of 3 seconds. Interface health monitoring is enabled
on all interfaces by default.
The cluster auto-rejoin feature for a failed cluster control link is set to unlimited attempts every 5 minutes.
The cluster auto-rejoin feature for a failed data interface is set to 3 attempts every 5 minutes, with the increasing interval
set to 2.
Connection replication delay of 5 seconds is enabled by default for HTTP traffic.
Configure clustering
You can easily deploy the cluster from the Firepower 4100/9300 supervisor. All initial configuration is automatically generated for each unit. You
can then add the units to the Firewall Management Center and group them into a cluster.
FXOS: Configure interfaces
For a cluster, you need to configure the following types of interfaces:
For inter-chassis clustering, all data interfaces must be Spanned EtherChannels with at least one member interface. Add the
same EtherChannels on each chassis. Combine the member interfaces from all cluster units into a single EtherChannel on the
switch. For container instance data interfaces, you cannot use VLAN subinterfaces or data-sharing interfaces in the cluster. Refer to Clustering guidelines and limitations for more information about EtherChannels for inter-chassis clustering.
For multi-instance clustering, you cannot use FXOS-defined VLAN subinterfaces or data-sharing interfaces in the cluster. Only
application-defined subinterfaces are supported.
The management interface is different from the chassis management interface, which is used only for chassis management. In
FXOS, the chassis management interface might appear as MGMT, management0, or similar names.
For inter-chassis clustering, add the same Management interface on each chassis.
For multi-instance clustering, you can share the same management interface across multiple clusters on the same chassis, or
with standalone instances.
For inter-chassis clustering, add a member interface to the cluster control link EtherChannel (by default, port-channel 48).
For multi-instance clustering, you can create additional cluster type EtherChannels. See Add an EtherChannel (port channel).
Do not add a member interface for intra-chassis clustering. If you add a member, the chassis assumes this cluster will be
inter-chassis, and will only allow you to use Spanned EtherChannels, for example.
Add the same member interfaces on each chassis. The cluster control link is a device-local EtherChannel on each chassis. Use
separate EtherChannels on the switch per device. Refer to Clustering guidelines and limitations for more information about EtherChannels for inter-chassis clustering.
For multi-instance clustering, unlike the Management interface, the cluster control link is not sharable across multiple devices, so you will need a Cluster interface for each cluster. However, we recommend using VLAN
subinterfaces instead of multiple EtherChannels; see the next bullet to add a VLAN subinterface to the Cluster interface.
This interface is a secondary management interface for Firewall Threat Defense devices. To use this interface, you must configure its IP address and other parameters at the Firewall Threat Defense CLI. For example, you can separate management traffic from events (such as web events). Refer to the configure network commands in the Cisco Secure Firewall Threat
Defense Command Reference.
For inter-chassis clustering, add the same eventing interface on each chassis.
Configure a physical interface
Configure physical interface settings including enable/disable state, speed, duplex, type, and auto-negotiation to ensure
proper network connectivity.
You can physically enable and disable interfaces, as well as set the interface speed and duplex. To use an interface, it must
be physically enabled in FXOS and logically enabled in the application.
Note
For QSFPH40G-CUxM, auto-negotiation is enabled by default and you cannot disable it.
If you replace an SFP on a port with a different SFP module, the speed, duplex, and auto-negotiation of the interface is not
updated automatically. You must manually reconfigure the interface.
Before you begin
An interface that is already a member of an EtherChannel cannot be modified individually. Be sure to configure settings before
you add it to the EtherChannel.
Procedure
Add an EtherChannel (port channel)
An EtherChannel (also known as a port channel) can include up to 16 member interfaces of the same media type and capacity,
and must be set to the same speed and duplex. The media type can be either RJ-45 or SFP; SFPs of different types (copper and
fiber) can be mixed. You cannot mix interface capacities (for example 1GB and 10GB interfaces) by setting the speed to be
lower on the larger-capacity interface. The Link Aggregation Control Protocol (LACP) aggregates interfaces by exchanging the
Link Aggregation Control Protocol Data Units (LACPDUs) between two network devices.
You can configure each physical Data or Data-sharing interface in an EtherChannel to be:
Active—Sends and receives LACP updates. An active EtherChannel can establish connectivity with either an active or a passive
EtherChannel. You should use the active mode unless you need to minimize the amount of LACP traffic.
On—The EtherChannel is always on, and LACP is not used. An “on” EtherChannel can only establish a connection with another
“on” EtherChannel.
Note
It may take up to three minutes for an EtherChannel to come up to an operational state if you change its mode from On to Active
or from Active to On.
Non-data interfaces only support active mode.
LACP coordinates the automatic addition and deletion of links to the EtherChannel without user intervention. It also handles
misconfigurations and checks that both ends of member interfaces are connected to the correct channel group. “On” mode cannot use standby interfaces in the channel group when an interface goes down, and the connectivity and configurations
are not checked.
When the Firepower 4100/9300 creates an EtherChannel, the EtherChannel stays in a Suspended state for Active LACP mode or a Down state for On LACP mode until you assign it to a logical device, even if the physical link is up. The EtherChannel will be brought out of this Suspended state in the following situations:
The EtherChannel is added as a data or management interface for a standalone logical device
The EtherChannel is added as a management interface or cluster control link for a logical device that is part of a cluster
The EtherChannel is added as a data interface for a logical device that is part of a cluster and at least one unit has joined
the cluster
Note that the EtherChannel does not come up until you assign it to a logical device. If the EtherChannel is removed from the
logical device or the logical device is deleted, the EtherChannel will revert to a Suspendedor Down state.
Procedure
Add a VLAN subinterface for container instances
You can add between 250 and 500 VLAN subinterfaces to the chassis, depending on your network deployment.You can add up to 500 subinterfaces to your chassis.
For multi-instance clustering, you can only add subinterfaces to the Cluster-type interface; subinterfaces on data interfaces
are not supported.
VLAN IDs per interface must be unique, and within a container instance, VLAN IDs must be unique across all assigned interfaces.
You can reuse VLAN IDs on separate interfaces as long as they are assigned to different container instances. However, each
subinterface still counts towards the limit even though it uses the same ID.
This document discusses FXOS VLAN subinterfaces only. You can separately create subinterfaces within the Firewall Threat Defense application.
Procedure
FXOS: Add a resource profile for container instances
To specify resource usage per container instance, create one or more resource profiles. When you deploy the logical device/application
instance, you specify the resource profile that you want to use. The resource profile sets the number of CPU cores; RAM is
dynamically allocated according to the number of cores, and disk space is set to 40 GB per instance.
The minimum number of cores is 6.
Note
Instances with a smaller number of cores might experience relatively higher CPU utilization than those with larger numbers
of cores. Instances with a smaller number of cores are more sensitive to traffic load changes. If you experience traffic drops,
try assigning more cores.
You can assign cores as an even number (6, 8, 10, 12, 14 etc.) up to the maximum.
The maximum number of cores available depends on the security module/chassis model.
The chassis includes a default resource profile called "Default-Small," which includes the minimum number of cores. You can
change the definition of this profile, and even delete it if it is not in use. Note that this profile is created when the
chassis reloads and no other profile exists on the system.
Changing the resource profile after you assign it is disruptive. See the following guidelines:
You cannot change the resource profile settings if it is currently in use. You must disable any instances that use it, then
change the resource profile, and finally reenable the instance.
If you change the resource profile settings after you add the Firewall Threat Defense instance to the Firewall Management Center, then update the inventory for each unit on the Firewall Management Center. Choose Devices > Device Management, click Edit () for the instance, then click Refresh () on the Device > Inventory Details area.
If you assign a different profile to an instance, it reboots.
If you assign a different profile to instances in an established high-availability pair, which requires the profile to be
the same on both units, you must:
Break high availability.
Assign the new profile to both units.
Re-establish high availability.
If you assign a different profile to instances in an established cluster, which allows mismatched profiles, then apply the
new profile on the data nodes first; after they all come back up, you can apply the new profile to the control node.
Procedure
FXOS: Add a Firewall Threat Defense cluster
A cluster is a deployment configuration that allows you to group security modules to increase capacity and redundancy.
Cluster Deployment Modes
In native mode: You can add a cluster to a single Firepower 9300 chassis that is isolated to security modules within the chassis, or you can use multiple chassis.
In multi-instance mode: You can add one or more clusters to a single Firepower 9300 chassis that are isolated to security
modules within the chassis (you must include an instance on each module), or add one or more clusters on multiple chassis.
For clusters on multiple chassis, you must configure each chassis separately. Add the cluster on one chassis; you can then
Create a Firewall Threat Defense cluster
You can easily deploy the cluster from the Firepower 4100/9300 chassis supervisor. All initial configuration is automatically generated for each unit.
For clustering on multiple chassis, you must configure each chassis separately. Deploy the cluster on one chassis; you can
then copy the bootstrap configuration from the first chassis to the next chassis for ease of deployment.
In a Firepower 9300 chassis, you must enable clustering for all 3 module slots, or for container instances, a container instance in each slot, even if you do not have a module installed. If you do not configure all 3 modules, the cluster will not come up.
Before you begin
Download the application image you want to use for the logical device from Cisco.com, and then upload that image to the Firepower 4100/9300 chassis.
For container instances, before you can install a container instance for the first time, you must reinitialize the security module/engine so that the disk has the correct formatting. An existing logical device will be deleted and then reinstalled as a new device,
losing any local application configuration. If you are replacing a native instance with container instances, you will need
to delete the native instance in any case. You cannot automatically migrate a native instance to a container instance.
Gather the following information:
Management interface ID, IP addresses, and network mask
Gateway IP address
Firewall Management Center IP address and/or NAT ID of your choosing
The chassis deploys the logical device by downloading the specified software version and pushing the bootstrap configuration
and management interface settings to the application instance. Check the Logical Devices page for the status of the new logical device. When the logical device shows its Status as online, you can add the remaining cluster chassis, or for a cluster isolated to security modules within one Firepower 9300 chassis, start configuring the cluster in the application. You may see the "Security module not responding" status as part of the process;
this status is normal and is temporary.
Add more cluster nodes
Add or replace the
Firewall Threat Defense
cluster node in an existing cluster.
When you add a new cluster node in FXOS, the
Firewall Management Center
adds the node automatically.
Note
The FXOS steps in this procedure only apply to adding a new chassis ; if you are adding a new module to a Firepower 9300
where clustering is already enabled, the module will be added automatically.
Before you begin
In the case of a replacement, you must delete the old cluster node from the
Firewall Management Center
. When you replace it with a new node, it is considered to be a new device on the
Firewall Management Center
.
The interface configuration must be the same on the new chassis. You can export and import FXOS chassis configuration to make
this process easier.
Procedure
What to do next
To add another chassis to the cluster, repeat the procedure in
Create a Firewall Threat Defense cluster
except you must configure the following settings to be unique; otherwise, use the same configuration for both chassis.
Chassis ID
Management IP addresses
Also be sure to set the startup version to the currently running version on the cluster nodes.
In the
Firewall Management Center
, choose
Devices > Device Management
, and select the
Add > Device
to add the new logical device.
Choose
Add > Cluster
.
Choose the current control unit from the drop-down list.
When you choose a control unit that is already in a cluster, then the existing cluster name is auto-filled, and all eligible
data units are added to the box, including the new unit you just added to the
Firewall Management Center
.
Click
Add
, and then
Deploy
. The cluster is updated to include the new member.
Firewall Management
Center: Add a cluster
Add one of the cluster units as a new device to the Secure Firewall Management
Center; the Firewall Management Center auto-detects all other cluster members.
Before you begin
All cluster units must be in a successfully-formed cluster on FXOS prior to adding the cluster to the Firewall Management Center. You should also check which unit is the control unit. Refer to the Firewall Chassis ManagerLogical Devices screen or use the Firewall Threat Defenseshow cluster info command.
Procedure
Step 1
In the Firewall Management Center, choose Devices > Device Management, and then choose Add > Add Device to add the control unit using the unit's management IP address you assigned when you deployed the cluster.
Figure 1. Add Device
In the Host field, enter the IP address or hostname of the control unit.
We recommend adding the control unit for the best performance, but you can add any unit of the cluster.
If you used a NAT ID during device setup, you may not need to enter this field.
In the Display Name field, enter a name for the control unit as you want it to display in the Firewall Management Center.
This display name is not for the cluster; it is only for the control unit you are adding. You can later change the name of
other cluster members and the cluster display name.
In the Registration Key field, enter the same registration key that you used when you deployed the cluster in FXOS. The registration key is a one-time-use
shared secret.
(Optional) Add the device to a device Group.
Choose an initial Access Control Policy to deploy to the device upon registration, or create a new policy.
If you create a new policy, you create a basic policy only. You can later customize the policy as needed.
Choose licenses to apply to the device.
If you used a NAT ID during device setup, expand the Advanced section and enter the same NAT ID in the Unique NAT ID field.
Check the Transfer Packets check box to allow the device to transfer packets to the Firewall Management Center.
This option is enabled by default. When events like IPS or Snort are triggered with this option enabled, the device sends
event metadata information and packet data to the Firewall Management Center for inspection. If you disable it, only event information will be sent to the Firewall Management Center but packet data is not sent.
Click Register.
The Firewall Management Center identifies and registers the control unit, and then registers all data units. If the control unit does not successfully register,
then the cluster is not added. A registration failure can occur if the cluster was not up on the chassis, or because of other
connectivity issues. In this case, we recommend that you try re-adding the cluster unit.
The cluster name shows on the Devices > Device Management page; expand the cluster to see the cluster units.
A unit that is currently registering shows the loading icon.
You can monitor cluster unit registration by clicking the Notifications icon and choosing Tasks. The Firewall Management Center updates the Cluster Registration task as each unit registers. If any units fail to register, see Reconcile cluster members.
Step 2
Configure device-specific settings by clicking the Edit () for the cluster.
Most configuration can be applied to the cluster as a whole, and not member units in the cluster. For example, you can change
the display name per unit, but you can only configure interfaces for the whole cluster.
Step 3
On the Devices > Device Managementand choose the Add, Cluster screen, you see General, License, System, and Health settings.
See the following cluster-specific items:
General > Name—Change the cluster display name by clicking the Edit ().
Then set the Name field.
General > View cluster status—Click the View cluster status link to open the Cluster Status dialog box.
The Cluster Status dialog box also lets you retry data unit registration by clicking Reconcile.
General > Troubleshoot—You can generate and download troubleshooting logs, and you can view cluster CLIs. See Troubleshoot the cluster.
Figure 2. Troubleshoot
License—Click Edit () to set license entitlements.
Step 4
On the Devices > Device Management and then choose AddDevice, you can choose each member in the cluster from the top right drop-down menu and configure the following settings.
General > Name—Change the cluster member display name by clicking the Edit ().
Then set the Name field.
Management > Host—If you change the management IP address in the device configuration, you must match the new address in the Firewall Management Center so that it can reach the device on the network; edit the Host address in the Management area.
Firewall Management
Center: Configure cluster, data interfaces
This procedure configures basic parameters for each data interface that you assigned to the cluster when you deployed it in
FXOS. For clustering on multiple chassis, data interfaces are always Spanned EtherChannel interfaces. For the cluster control
link interface for a cluster isolated to security modules within one Firepower 9300 chassis, you must increase the MTU from
the default.
Note
When using Spanned EtherChannels for clustering on multiple chassis, the port-channel interface will not come up until clustering
is fully enabled. This requirement prevents traffic from being forwarded to a unit that is not an active unit in the cluster.
Procedure
Step 1
Choose Devices > Device Management, and click Edit () next to the cluster.
Step 2
Click Interfaces.
Step 3
Configure the cluster control link.
For clustering on multiple chassis, set the cluster control link MTU to be at least 100 bytes higher than the highest MTU
of the data interfaces. Because the cluster control link traffic includes data packet forwarding, the cluster control link
needs to accommodate the entire size of a data packet plus cluster traffic overhead. We suggest setting the MTU to the maximum
of 9184; the minimum value is 1400 bytes. For example, because the maximum MTU is 9184, then the highest data interface MTU
can be 9084, while the cluster control link can be set to 9184.
When a node joins the cluster, it checks MTU compatibility by sending a ping to the control node with a packet size matching
the cluster control link MTU. If the initial ping fails, the node tries a ping using a smaller packet size (the MTU divided
by 2, then by 4, then by 8) until a ping succeeds. A notification is generated so you can fix the MTU mismatch on connecting
switches and try again.
For native clusters: The cluster control link interface is Port-Channel48 by default. If you don't know which interface is the cluster control
link, check the FXOS configuration for chassis for the Cluster-type interface assigned to the cluster.
Click Edit () for the cluster control link interface.
On the General page, in the MTU field, enter a value between 1400 and 9184but not between 2561 and 8362. Due to block pool handling, this MTU size is not
optimal for system operation. We suggest using the maximum, 9184.
Click OK.
Step 4
Configure data interfaces.
(Optional) For regular firewall interfaces, configure VLAN subinterfaces on the data interface. The rest of this procedure applies to
the subinterfaces.
Click Edit () for the data interface.
Configure the name and other parameters..
Note
If the cluster control link interface MTU is not at least 100 bytes higher than the data interface MTU, you will see an error
that you must reduce the MTU of the data interface. See, Step 3 to increase the cluster control link MTU, after which you can continue configuring the data interfaces.
For clustering on multiple chassis, set a unique. manual global MAC address for the EtherChannel. Click Advanced, and in the Active Mac Address field, enter a MAC address in H.H.H format, where H is a 16-bit hexadecimal digit.
For example, the MAC address 00-0C-F1-42-4C-DE would be entered as 000C.F142.4CDE. The MAC address must not have the multicast
bit set, that is, the second hexadecimal digit from the left cannot be an odd number.
Do not set the Standby Mac Address; it is ignored.
You must configure a unique MAC address not currently in use on your network for a Spanned EtherChannel to avoid potential
network connectivity problems. With a manually-configured MAC address, the MAC address stays with the current control unit.
If you do not configure a MAC address, then if the control unit changes, the new control unit uses a new MAC address for the
interface, which can cause a temporary network outage.
Click OK. Repeat the above steps for other data interfaces.
Step 5
Click
Save.
You can now go to Deploy > Deploy and deploy the policy to assigned devices. The changes are not active until you deploy them.
Firewall Management Center: Configure Cluster Health Monitor Settings
This task allows you to modify cluster health monitor settings to control how cluster nodes monitor system health and automatically
rejoin the cluster after failures.
The Cluster Health Monitor Settings section of the Cluster page displays the settings for monitoring cluster node health. You can monitor any port-channel ID, any single physical interface
ID, and the Snort and disk-full processes. Health monitoring is not performed on VLAN subinterfaces or virtual interfaces
such as VNIs or BVIs. You cannot configure monitoring for the cluster control link. It is always monitored.
When a topology change occurs (such as adding or removing a data interface, enabling or disabling an interface on the node
or the switch, or adding an additional switch to form a VSS or vPC or VNet) you should disable the system health check feature.
Also, disable interface monitoring for any interfaces that are disabled. When the topology change is complete, and the configuration
change is synced to all nodes, you can re-enable the system health check feature and monitored interfaces.
Procedure
Step 1
Choose Devices > Device Management.
Step 2
Next to the cluster you want to modify, click Edit ().
Step 3
Click Cluster.
Step 4
In the Cluster Health Monitor Settings section, click Edit ().
Step 5
Disable the system health check by clicking the Health Check slider.
Figure 3. Disable the system health check
When any topology changes occur (such as adding or removing a data interface, enabling or disabling an interface on the node
or the switch, or adding an additional switch to form a VSS or vPC or VNet) you should disable the system health check feature
and also disable interface monitoring for the disabled interfaces. When the topology change is complete, and the configuration
change is synced to all nodes, you can re-enable the system health check feature and monitored interfaces.
Step 6
Configure the hold time and interface debounce time.
Hold Time—Set the hold time to determine the amount of time between node heartbeat status messages, between 0.3 and 45 seconds. The
default is 3 seconds.
Interface Debounce Time—Set the debounce time between 300 and 9000 ms. The default is 500 ms. Lower values allow for faster detection of interface
failures. Note that configuring a lower debounce time increases the chances of false-positives. When an interface status update
occurs, the node waits the specified number of milliseconds before marking the interface as failed and removing the node from
the cluster. If an EtherChannel transitions from a down state to an up state, such as after the switch reloads or enables
an EtherChannel, a longer debounce time can prevent the interface from appearing failed on a cluster node if another cluster
node bundles the ports more quickly.
Step 7
Customize the auto-rejoin cluster settings after a health check failure.
Figure 4. Configure Auto-Rejoin settings
Set values for the Cluster Interface, Data Interface, and System (internal failures include: application sync timeout; inconsistent application statuses; and so on):
Attempts—Sets the number of rejoin attempts, between -1 and 65535. 0 disables auto-rejoining. The default for the Cluster Interface is -1 (unlimited). The default for the Data Interface and System is 3.
Interval Between Attempts—Defines the interval duration in minutes between rejoin attempts, between 2 and 60. The default value is 5 minutes. The maximum
total time that the node attempts to rejoin the cluster is limited to 14400 minutes (10 days) from the time of last failure.
Interval Variation—Defines if the interval duration increases. Set the value between 1 and 3: 1 (no change); 2 (2 x the previous duration), or 3 (3 x the previous duration). For example, if you set the interval duration to 5 minutes, and set the variation to 2, then
the first attempt is after 5 minutes; the 2nd attempt is 10 minutes (2 x 5); the 3rd attempt 20 minutes (2 x 10), and so on.
The default value is 1 for the Cluster Interface and 2 for the Data Interface and System.
Step 8
Configure monitored interfaces by moving interfaces in the Monitored Interfaces or Unmonitored Interfaces window. You can also check or uncheck Enable Service Application Monitoring to enable or disable monitoring of the Snort and disk-full processes.
Figure 5. Configure monitored interfaces
The interface health check monitors for link failures. If all physical ports for a given logical interface fail on a particular
node, but there are active ports under the same logical interface on other nodes, then the node is removed from the cluster.
The time required to remove a member from the cluster depends on the type of interface and whether the node is established
or is joining the cluster. By default, health check is enabled for all interfaces and the Snort and disk-full processes.
You might want to disable health monitoring of non-essential interfaces.
When any topology changes occur (such as adding or removing a data interface, enabling or disabling an interface on the node
or the switch, or adding an additional switch to form a VSS or vPC or VNet) you should disable the system health check feature
and also disable interface monitoring for the disabled interfaces. When the topology change is complete, and the configuration
change is synced to all nodes, you can re-enable the system health check feature and monitored interfaces.
Step 9
Click Save.
Deploy configuration changes.
FXOS: Remove a cluster node
The following sections describe how to remove nodes temporarily or permanently from the cluster.
Temporary removal
A cluster node will be automatically removed from the cluster due to a hardware or network failure, for example. This removal
is temporary until the conditions are rectified, and it can rejoin the cluster. You can also manually disable clustering.
To check whether a device is currently in the cluster, check the cluster status
For Firewall Threat Defense using the Firewall Management Center, you should leave the device in the Firewall Management Center device list so that it can resume full functionality after you reenable clustering.
Disable clustering in the application—You can disable clustering using the application CLI. Enter the cluster remove unitname command to remove any node other than the one you are logged into. The bootstrap configuration remains intact, as well as
the last configuration synced from the control node, so you can later re-add the node without losing your configuration. If
you enter this command on a data node to remove the control node, a new control node is elected.
When a device becomes inactive, all data interfaces are shut down; only the Management interface can send and receive traffic.
To resume traffic flow, re-enable clustering. The Management interface remains up using the IP address the node received from
the bootstrap configuration. However if you reload, and the node is still inactive in the cluster , the Management interface
is disabled.
To reenable clustering, on the Firewall Threat Defense enter cluster enable.
Disable the application instance—
Shut down the security module/engine—
Shut down the chassis—
Permanent removal
You can permanently remove a cluster node using the following methods.
For Firewall Threat Defense using the Firewall Management Center, be sure to remove the node from the Firewall Management Center device list after you disable clustering on the chassis.
Delete the logical device—
Remove the chassis or security module from service—If you remove a device from service, you can add replacement hardware as
a new node of the cluster.
Firewall Management
Center: Manage cluster members
After you deploy the cluster, you can change the configuration and manage cluster members.
Add a new cluster member
When you add a new cluster member in FXOS, the Secure Firewall Management
Center adds the member automatically.
Before you begin
Make sure the interface configuration is the same on the replacement unit as for the other chassis.
Wait for the new unit to be added to the cluster. Refer to the Firewall Chassis ManagerLogical Devices screen or use the Firewall Threat Defenseshow cluster info command to view cluster status.
Step 2
The new cluster member is added automatically. To monitor the registration of the replacement unit, view the following:
Cluster Status dialog box (which is available from the Devices > Device Management, More () icon or from the Devices > Device Management and choose the Add, Cluster tab General area Cluster Live Status link)—A unit that is joining the cluster on the chassis shows "Joining cluster..." After it joins the cluster, the Firewall Management Center attempts to register it, and the status changes to "Available for Registration". After it completes registration, the status
changes to "In Sync." If the registration fails, the unit will stay at "Available for Registration". In this case, force a
re-registration by clicking Reconcile.
System status Tasks —The Firewall Management Center shows all registration events and failures.
Devices > Device Management and then choose AddDevice—When you expand the cluster on the devices listing page, you can see when a unit is registering when it has the loading icon
to the left.
Replace a cluster member
You can replace a cluster member in an existing cluster. The Firewall Management Center auto-detects the replacement unit. However, you must manually delete the old cluster member in the Firewall Management Center. This procedure also applies to a unit that was reinitialized; in this case, although the hardware remains the same, it appears
to be a new member.
Before you begin
Make sure the interface configuration is the same on the replacement unit as for other chassis.
Follow these steps to replace a cluster member:
Procedure
Step 1
For a new chassis, if possible, backup and restore the configuration from the old chassis in FXOS.
If you are replacing a module in a Firepower 9300, you do not need to perform these steps.
If you do not have a backup FXOS configuration from the old chassis, first perform the steps in Add a new cluster member.
Use the configuration export feature to export an XML file containing logical device and platform configuration settings for
your Firepower 4100/9300 chassis.
Import the configuration file to the replacement chassis.
Accept the license agreement.
If necessary, upgrade the logical device application instance version to match the rest of the cluster.
Step 2
In the Firewall Management Center for the old unit, choose Devices > Device Management, More ()> Delete .
Step 3
Confirm that you want to delete the unit.
The unit is removed from the cluster and from the Firewall Management Center devices list.
Step 4
The new or reinitialized cluster member is added automatically. To monitor the registration of the replacement unit, view
the following:
Cluster Status dialog box (Devices > Device Management, More () icon or Devices > Device Management and then choose Add, Cluster page, General area, Cluster Live Status link)—A unit that is joining the cluster on the chassis shows "Joining cluster..." After it joins the cluster, the Firewall Management Center attempts to register it, and the status changes to "Available for Registration". After it completes registration, the status
changes to "In Sync." If the registration fails, the unit will stay at "Available for Registration". In this case, force a
re-registration by clicking Reconcile All.
Click System (), and then click Tasks—The Firewall Management Center shows all registration events and failures.
Devices > Device Management, and then click Add > Device—When you expand the cluster on the devices listing page, you can see when a unit is registering when it has the loading icon
to the left.
Deactivate a member
You may want to deactivate a member in preparation for deleting the unit, or temporarily for maintenance. This procedure is
meant to temporarily deactivate a member; the unit will still appear in the Firewall Management Center device list.
Note
When a unit becomes inactive, all data interfaces are shut down; only the Management interface can send and receive traffic.
To resume traffic flow, reenable clustering. The Management interface remains up using the IP address the unit received from
the bootstrap configuration. However if you reload, and the unit is still inactive in the cluster, the management interface
is disabled. You must use the console for any further configuration.
Procedure
Step 1
For the unit you want to deactivate, choose Devices > Device Management, More (), and then Disable Clustering.
You can also deactivate a unit from the Cluster Status dialog box (Devices > Device Management, More (), and Cluster Live Status).
Step 2
Confirm that you want to disable clustering on the unit.
The unit will show (Disabled) next to its name in the Devices > Device Management list.
If a unit was removed from the cluster, for example for a failed interface or if you manually disabled clustering, you must
manually rejoin the cluster. Make sure the failure is resolved before you try to rejoin the cluster. See Rejoining the cluster for more information about why a unit can be removed from a cluster.
Procedure
Step 1
For the unit you want to reactivate, choose Devices > Device Management, More ()> Enable Clustering.
You can also reactivate a unit from the Cluster Status dialog box (Devices > Device Management, More ()> Cluster Live Status).
Step 2
Confirm that you want to enable clustering on the unit.
Unregister a data node
If you need to permanently remove a cluster node (for example, if you remove a module on the Firepower 9300, or remove a chassis),
then you should unregister it from the Firewall Management Center.
Do not unregister the node if it is still a healthy part of the cluster, or if you only want to disable the node temporarily.
To remove it permanently from the cluster in FXOS, see FXOS: Remove a cluster node. If you unregister it from the Firewall Management Center, and it is still part of the cluster, it will continue to pass traffic, and could even become the control node—a control
node that the Firewall Management Center can no longer manage.
Before you begin
To manually deactivate the node, see Deactivate a member. Before you unregister a node, the node must be inactive, either manually or because of a health failure.
Procedure
Step 1
Make sure the node is ready to be unregistered from the Firewall Management Center. On Devices > Device Management, make sure the node shows (Disabled).
You can also view each node's status on the Cluster Status dialog box available from More (). If the status is stale, click Reconcile All on the Cluster Status dialog box to force an update.
Step 2
In the Firewall Management Center for the data node you want to delete, choose Devices > Device Management and then click Add > DeviceMore ()>Unregister.
Step 3
Confirm that you want to unregister the node.
The node is removed from the cluster and from the Firewall Management Center devices list.
Change the control unit
The best method to change the control unit is to disable clustering on the control unit, wait for a new control election,
and then re-enable clustering.
Caution
If you must specify the exact unit you want to become the control unit, use the procedure in this section. Note that for centralized features, if you force
a control unit change, then all connections are dropped, and you have to re-establish the connections on the new control unit.
Procedure
Step 1
Open the Cluster Status dialog box by choosing Devices > Device Management, More ()> Cluster Live Status.
You can also access the Cluster Status dialog box from Devices > Device Management and choose the Add, Cluster page, General area, and Cluster Live Status link.
Step 2
For the unit you want to become the control unit, choose More ()> Change Role to Control.
Step 3
You are prompted to confirm the role change. Check the check box, and click OK.
Reconcile cluster members
If a cluster member fails to register, you can reconcile the cluster membership from the chassis to the Secure Firewall Management
Center. For example, a data unit might fail to register if the Firewall Management Center is occupied with certain processes, or if there is a network issue.
Procedure
Step 1
Choose Devices > Device Management, More () for the cluster, and then choose Cluster Live Status to open the Cluster Status dialog box.
You can also open the Cluster Status dialog box from the Devices > Device Management page General area, Cluster Live Status link.
You can monitor the cluster in Secure Firewall Management
Center and at the Firewall Threat Defense CLI.
Cluster Status dialog box, which is available from the Devices > Device Management, More () icon or from the Devices > Device Management and then chose Add, Cluster page, General area, and Cluster Live Status link.
The Control unit has a graphic indicator identifying its role.
Cluster member Status includes the following states:
In Sync.—The unit is registered with the Firewall Management Center.
Pending Registration—The unit is part of the cluster, but has not yet registered with the Firewall Management Center. If a unit fails to register, you can retry registration by clicking Reconcile All.
Clustering is disabled—The unit is registered with the Firewall Management Center, but is an inactive member of the cluster. The clustering configuration remains intact if you intend to later re-enable it,
or you can delete the unit from the cluster.
Joining cluster...—The unit is joining the cluster on the chassis, but has not completed joining. After it joins, it will
register with the Firewall Management Center.
For each unit, you can view the Summary or the History.
For each unit from the More () menu , you can perform the following status changes:
Disable Clustering
Enable Clustering
Change Role to Control
Click System (), and then click Tasks.
The Tasks page shows updates of the Cluster Registration task as each unit registers.
Devices > Device Management and then choose Add Device
cluster_name.
When you expand the cluster on the devices listing page, you can see all member units, including the control unit shown with
its role next to the IP address. For units that are still registering, you can see the loading icon.
show cluster {access-list [acl_name] | conn [count] | cpu [usage] | history | interface-mode | memory | resource usage | service-policy | traffic | xlate count}
To view aggregated data for the entire cluster or other information, use the show cluster command.
show cluster info [auto-join | clients | conn-distribution | flow-mobility counters | goid [options] | health | incompatible-config | loadbalance | old-members | packet-distribution | trace [options] | transport { asp | cp}]
To view cluster information, use the show cluster info command.
The Control unit has a graphic indicator identifying its role.
Cluster member Status includes these states:
In Sync.—The unit is registered with the Firewall Management Center.
Pending Registration—The unit is part of the cluster, but has not yet registered with the Firewall Management Center. If a unit fails to register, you can retry registration by clicking Reconcile All.
Clustering is disabled—The unit is registered with the Firewall Management Center, but is an inactive member of the cluster. The clustering configuration remains intact if you intend to later re-enable it,
or you can delete the unit from the cluster.
Joining cluster...—The unit is joining the cluster on the chassis, but has not completed joining. After it joins, it will
register with the Firewall Management Center.
For each unit, you can view the Summary or the History.
For each unit from the More () menu, you can perform these status changes:
Disable Clustering
Enable Clustering
Change Role to Control
Tasks page
Click System (), and then click Tasks.
The Tasks page shows updates of the Cluster Registration task as each unit registers.
Device management page
Devices > Device Management and then choose Add Device cluster_name.
When you expand the cluster on the devices listing page, you can see all member units, including the control unit shown with
its role next to the IP address. For units that are still registering, you can see the loading icon.
CLI commands for cluster monitoring
show cluster {access-list [acl_name] | conn [count] | cpu [usage] | history | interface-mode | memory | resource usage | service-policy | traffic | xlate count}
To view aggregated data for the entire cluster or other information, use the show cluster command.
show cluster info [auto-join | clients | conn-distribution | flow-mobility counters | goid [options] | health | incompatible-config | loadbalance | old-members | packet-distribution | trace [options] | transport { asp | cp}]
To view cluster information, use the show cluster info command.
Cluster Health Monitor Dashboard
When a Firewall Threat Defense is the control node of a cluster, the Firewall Management Center collects various metrics periodically from the device metric data collector.
The cluster health monitor is comprised of these components:
Overview dashboard: Displays information about the cluster topology, cluster statistics, and metric charts:
The topology section displays a cluster's live status, the health of individual threat defense, threat defense node type (control
node or data node), and the status of the device. The status of the device could be Disabled (when the device leaves the cluster), Added out of box (in a public cloud cluster, the additional nodes that do not belong to the Firewall Management Center), or Normal (ideal state of the node).
The cluster statistics section displays current metrics of the cluster with respect to the CPU usage, memory usage, input
rate, output rate, active connections, and NAT translations.
Note
The CPU and memory metrics display the individual average of the data plane and snort usage.
The metric charts, namely, CPU Usage, Memory Usage, Throughput, and Connections, diagrammatically display the statistics of
the cluster over the specified time period.
Load Distribution dashboard: Displays load distribution across the cluster nodes in two widgets:
The Distribution widget displays the average packet and connection distribution over the time range across the cluster nodes.
This data depicts how the load is being distributed by the nodes. Using this widget, you can easily identify any abnormalities
in the load distribution and rectify it.
The Node Statistics widget displays the node level metrics in table format. It displays metric data on CPU usage, memory usage,
input rate, output rate, active connections, and NAT translations across the cluster nodes. This table view enables you to
correlate data and easily identify any discrepancies.
Member Performance dashboard: Displays current metrics of the cluster nodes. You can use the selector to filter the nodes
and view the details of a specific node. The metric data include CPU usage, memory usage, input rate, output rate, active
connections, and NAT translations.
CCL dashboard: Displays, graphically, the cluster control link data namely, the input, and output rate.
Troubleshooting and Links: Provides convenient links to frequently used troubleshooting topics and procedures.
Time range: An adjustable time window to constrain the information that appears in the various cluster metrics dashboards
and widgets.
Custom Dashboard: Displays data on both cluster-wide metrics and node-level metrics. However, node selection only applies
for the threat defense metrics and not for the entire cluster to which the node belongs.
Viewing cluster health
The cluster health monitor provides a detailed view of the health status of a cluster and its nodes. This cluster health monitor
provides health status and trends of the cluster in an array of dashboards.
Before you begin
Ensure you have created a cluster from one or more devices in the Firewall Management Center.
Follow these steps to view the cluster health monitor:
Procedure
Step 1
Choose System () > Health > Monitor.
Use the Monitoring navigation pane to access node-specific health monitors.
Step 2
In the device list, click Expand() and Collapse () to expand and collapse the list of managed cluster devices.
Step 3
Click on the cluster name to view the cluster health statistics.
The cluster monitor reports health and performance metrics in several predefined dashboards by default. The metrics dashboards
include:
Overview: Highlights key metrics from the other predefined dashboards, including its nodes, CPU, memory, input and output
rates, connection statistics, and NAT translation information.
Load Distribution: Traffic and packet distribution across the cluster nodes.
Member Performance: Node-level statistics on CPU usage, memory usage, input throughput, output throughput, active connection,
and NAT translation.
CCL: Interface status and aggregate traffic statistics.
Configure the time range from the drop-down in the upper-right corner.
The time range can reflect a period as short as the last hour (the default) or as long as two weeks. Select Custom from the drop-down to configure a custom start and end date.
Click the refresh icon to set auto refresh to 5 minutes or to toggle off auto refresh.
Step 5
Click on deployment icon for a deployment overlay on the trend graph, with respect to the selected time range.
The deployment icon indicates the number of deployments during the selected time-range. A vertical band indicates the deployment
start and end time. For multiple deployments, multiple bands/lines appear. Click on the icon on top of the dotted line to
view the deployment details.
Step 6
View the Health Alerts for the node in the alert notification at the top of page, directly to the right of the device name.
Hover your pointer over the Health Alerts to view the health summary of the node. The popup window shows a truncated summary of the top five health alerts. Click on
the popup to open a detailed view of the health alert summary.
Step 7
View device monitor health and performance metrics in several predefined dashboards.
The metrics dashboards include:
Overview: Highlights key metrics from the other predefined dashboards, including CPU, memory, interfaces, connection statistics;
plus disk usage and critical process information.
CPU: CPU utilization, including the CPU usage by process and by physical cores.
Memory: Device memory utilization, including data plane and Snort memory usage.
Interfaces: Interface status and aggregate traffic statistics.
Connections: Connection statistics (such as elephant flows, active connections, peak connections, and so on) and NAT translation
counts.
Snort: Statistics that are related to the Snort process.
ASP drops: Statistics related to the dropped packets against various reasons.
Click the plus sign Add New Dashboard() in the upper right corner of the health monitor to create a custom dashboard by building your own variable set from the available
metric groups.
For cluster-wide dashboard, choose Cluster metric group, and then choose the metric.
Cluster metrics
The cluster health monitor tracks statistics that are related to a cluster and its nodes, and aggregate of load distribution,
performance, and CCL traffic statistics.
Table 2. Cluster Metrics
Metric
Description
Format
CPU
Average of CPU metrics on the nodes of a cluster (individually for data plane and snort).
percentage
Memory
Average of memory metrics on the nodes of a cluster (individually for data plane and snort).
percentage
Data Throughput
Incoming and outgoing data traffic statistics for a cluster.
bytes
CCL Throughput
Incoming and outgoing CCL traffic statistics for a cluster.
bytes
Connections
Count of active connections in a cluster.
number
NAT Translations
Count of NAT translations for a cluster.
number
Distribution
Connection distribution count in the cluster for every second.
number
Packets
Packet distribution count in the cluster for every second.
number
Troubleshoot the cluster
Use these methods to troubleshoot the devices and clusters:
Use Logs to generates troubleshooting files for all nodes in the cluster. Use this option when you need one cluster-level collection
instead of generating troubleshooting files from each node separately.
Use CLI to run a predefined set of cluster diagnostic commands and displays the output. Use this option to check cluster configuration,
member state, cluster health, control-plane transport statistics, packet drops, interface status, CPU usage, memory buffers,
ARP entries, and reachability. The CLI option displays command output; it does not open an interactive CLI session.
Commands
show running-config cluster: Review the cluster group configuration, local unit, cluster interface, priority, health-check, auto-rejoin, and cLACP settings.
show cluster info: Confirm that clustering is enabled and identify the control node, member state, software version, serial number, CCL IP
address, CCL MAC address, and last join or leave state.
show cluster info health: Check unit, interface, service, and overall cluster health.
show cluster info transport cp: Review control-plane transport counters, including reliable and unreliable message counters, errors, retransmits, drops,
and buffer conditions.
show version: Capture platform, software, build, UUID, LSP, VDB, uptime, resource, and license context.
show asp drop: Identify accelerated security path packet or flow drop reasons and counters.
show counters: Review protocol, feature, and cluster CCL counters.
show arp: Verify ARP entries for interfaces that participate in cluster communication.
show int ip brief: Check interface IP addresses and administrative and line protocol status.
show blocks: Check buffer availability and failed allocations.
show cpu detailed: Check data path, control point, and total CPU usage.
show interface
ccl_interface: Review interface state, MTU, MAC address, IP address, traffic counters, errors, and drops for the cluster-related interface.
ping
ccl_ip
size
ccl_mtu
repeat 2: Test reachability to a cluster peer by using the packet size selected by the tool.
Use the CCL Ping when you need to test cluster control link connectivity between joined cluster nodes.
Troubleshooting files—If a node fails to join the cluster, a troubleshooting file is automatically generated. You can also
generate and download troubleshooting files from the Devices > Device Management and then choose Add, ClusterGeneral area.
You can also generate files from the Device Management page. Click More () and choose Troubleshoot Files.
CLI output—Choose Devices > Device Management and then choose Add, ClusterGeneral area, you can view a set of pre-defined CLI outputs that can help you troubleshoot the cluster. These commands are automatically
run for the cluster:
You can also enter any show command in the Command field.
Perform a ping on the cluster control link
When a node joins the cluster, it checks MTU compatibility by sending a ping to the control node with a packet size matching
the cluster control link MTU. If the initial ping fails, the node tries a ping using a smaller packet size (the MTU divided
by 2, then by 4, then by 8) until a ping succeeds. A notification is generated so you can fix the MTU mismatch on connecting
switches and try again. This tool lets you manually ping all nodes that have already joined the cluster in case you are having
cluster control link connectivity problems.
Procedure
Step 1
Choose Devices > Device Management, click the More () icon next to the cluster, and choose Cluster Live Status.
Figure 6. Cluster status
Step 2
Expand one of the nodes, and click CCL Ping.
Figure 7. CCL ping
The node sends a ping on the cluster control link to every other node using a packet size that matches the maximum MTU.
Examples for Clustering
These examples include typical deployments.
Firewall on a stick
Data traffic from different security domains are associated with different VLANs. For example, VLAN 10 for the inside network
and VLAN 20 for the outside network. Each Threat Defense has a single physical port connected to the external switch or router. Trunking is enabled so that all packets on the physical
link are 802.1q encapsulated. The Threat Defense is the firewall between VLAN 10 and VLAN 20.
When using Spanned EtherChannels, all data links are grouped into one EtherChannel on the switch side. If the Threat Defense becomes unavailable, the switch will rebalance traffic between the remaining units.
Traffic segregation
Provides the necessary bootstrap and interface configurations to implement traffic segregation using spanned EtherChannels
in a cluster environment.
As shown in the diagram above, there is one Spanned EtherChannel on the left side that connects to the inside switch, and
the other on the right side to outside switch. You can also create VLAN subinterfaces on each EtherChannel if desired.
Reference for clustering
This section includes more information about how clustering operates.
Firewall Threat
Defense features and clustering
Some Firewall Threat Defense features are not supported with clustering, and some are only supported on the
control unit. Other features might have caveats for proper usage.
Unsupported features with clustering
These features cannot be configured with clustering enabled, and the commands will be rejected.
Note
To view FlexConfig features that are also not supported with clustering, for example WCCP inspection, see the ASA general operations configuration guide. FlexConfig lets you configure many ASA features that are not present in the Firewall Management Center GUI.
Remote access VPN (SSL VPN and IPsec VPN)
Site-to-site VPN (Policy-based and route-based) is not supported in public clouds.
DHCP client, server, and proxy. DHCP relay is supported.
Virtual Tunnel Interfaces (VTIs)
High Availability
Integrated Routing and Bridging
Firewall Management
Center UCAPL/CC mode
DHCP client, server, and proxy. DHCP relay is supported.
Centralized features for clustering
The following features are only supported on the control unit, and are not scaled for the cluster.
Note
Traffic for centralized features is forwarded from member units to the control unit over the cluster control link.
If you use the rebalancing feature, traffic for centralized features may be rebalanced to non-control units before the traffic
is classified as a centralized feature; if this occurs, the traffic is then sent back to the control unit.
For centralized features, if the control unit fails, all connections are dropped, and you have to re-establish the connections
on the new control unit.
Site-to-site VPN
The following application inspections:
DCERPC
NetBIOS
RSH
SUNRPC
TFTP
XDMCP
Dynamic routing
Static route monitoring
Connection settings
Connection limits are enforced cluster-wide. Each node has an
estimate of the cluster-wide counter values based on broadcast messages. Due to
efficiency considerations, the configured connection limit across the cluster
might not be enforced exactly at the limit number. Each node may overestimate or
underestimate the cluster-wide counter value at any given time. However, the
information will get updated over time in a load-balanced cluster.
Dynamic routing and clustering
The routing process only runs on the control unit, and routes are learned through the control unit and replicated to secondaries.
If a routing packet arrives at a data unit, it is redirected to the control unit.
Figure 8. Dynamic Routing
After the data units learn the routes from the control unit, each unit makes forwarding decisions independently.
The OSPF LSA database is not synchronized from the control unit to data units. If there is a control unit switchover, the
neighboring router will detect a restart; the switchover is not transparent. The OSPF process picks an IP address as its router
ID. Although not required, you can assign a static router ID to ensure a consistent router ID is used across the cluster.
See the OSPF Non-Stop Forwarding feature to address the interruption.
FTP and clustering
If FTP data channel and control channel flows are owned by
different cluster members, then the data channel owner will periodically send
idle timeout updates to the control channel owner and update the idle timeout
value. However, if the control flow owner is reloaded, and the control flow is
re-hosted, the parent/child flow relationship will not longer be maintained;
the control flow idle timeout will not be updated.
Multicast routing and clustering
The control unit handles all multicast routing packets and data packets until fast-path
forwarding is established. After the connection is established, each data unit can
forward multicast data packets.
NAT and clustering
NAT can affect the overall throughput of the cluster. Inbound and outbound NAT packets can be sent to different Firewall Threat Defenses in the cluster, because the load balancing algorithm relies on IP addresses and ports, and NAT causes inbound and outbound
packets to have different IP addresses and/or ports. When a packet arrives at the Firewall Threat Defense that is not the NAT owner, it is forwarded over the cluster control link to the owner, causing large amounts of traffic on
the cluster control link. Note that the receiving node does not create a forwarding flow to the owner, because the NAT owner
may not end up creating a connection for the packet depending on the results of security and policy checks.
If you still want to use NAT in clustering, then consider the following guidelines:
PAT with Port Block Allocation—See the following guidelines for this feature:
Maximum-per-host limit is not a cluster-wide limit, and is enforced on each node individually. Thus, in a 3-node cluster with
the maximum-per-host limit configured as 1, if the traffic from a host is load-balanced across all 3 nodes, then it can get
allocated 3 blocks with 1 in each node.
Port blocks created on the backup node from the backup pools are not accounted for when enforcing the maximum-per-host limit.
On-the-fly PAT rule modifications, where the PAT pool is modified with a completely new range of IP addresses, will result
in xlate backup creation failures for the xlate backup requests that were still in transit while the new pool became effective.
This behavior is not specific to the port block allocation feature, and is a transient PAT pool issue seen only in cluster
deployments where the pool is distributed and traffic is load-balanced across the cluster nodes.
When operating in a cluster, you cannot simply change the block allocation size. The new size is effective only after you
reload each device in the cluster. To avoid having to reload each device, we recommend that you delete all block allocation
rules and clear all xlates related to those rules. You can then change the block size and recreate the block allocation rules.
NAT pool address distribution for dynamic PAT—When you configure a PAT pool, the cluster divides each IP address in the pool
into port blocks. By default, each block is 512 ports, but if you configure port block allocation rules, your block setting
is used instead. These blocks are distributed evenly among the nodes in the cluster, so that each node has one or more blocks
for each IP address in the PAT pool. Thus, you could have as few as one IP address in a PAT pool for a cluster, if that is
sufficient for the number of PAT’ed connections you expect. Port blocks cover the 1024-65535 port range, unless you configure
the option to include the reserved ports, 1-1023, on the PAT pool NAT rule.
Same translation object in static and dynamic NAT rules—Do not use the same network object or object group as the translated
address in both static NAT rules and dynamic NAT rules in a cluster. Similarly, avoid using network objects or object groups
with overlapping address ranges across static and dynamic NAT rules. Use separate network objects or object groups for static
translations and dynamic translations. Mixing these configurations can cause translation ownership inconsistencies in the
cluster, which can result in traffic drops or intermittent connection failures.
Reusing a PAT pool in multiple rules—To use the same PAT pool in multiple rules, you must be careful about the interface selection
in the rules. You must either use specific interfaces in all rules, or "any" in all rules. You cannot mix specific interfaces
and "any" across the rules, or the system might not be able to match return traffic to the right node in the cluster. Using
unique PAT pools per rule is the most reliable option.
No round-robin—Round-robin for a PAT pool is not supported with clustering.
No extended PAT—Extended PAT is not supported with clustering.
Dynamic NAT xlates managed by the control node—The control node maintains and replicates the xlate table to data nodes. When
a data node receives a connection that requires dynamic NAT, and the xlate is not in the table, it requests the xlate from
the control node. The data node owns the connection.
Stale xlates—The xlate idle time on the connection owner does not get updated. Thus, the idle time might exceed the idle timeout.
An idle timer value higher than the configured timeout with a refcnt of 0 is an indication of a stale xlate.
No static PAT for the following inspections—
FTP
RSH
SQLNET
TFTP
XDMCP
SIP
If you have an extremely large number of NAT rules, over ten thousand, you should enable the transactional commit model using
the asp rule-engine transactional-commit nat command in the device CLI. Otherwise, the node might not be able to join the cluster.
SIP inspection and clustering
A control flow can be created on any node (due to load balancing); its
child data flows must reside on the same node.
SNMP and clustering
You should always use the Local address, and not the Main cluster IP
address for SNMP polling. If the SNMP agent polls the Main cluster IP address,
if a new control node is elected, the poll to the new control node will fail.
When using SNMPv3 with clustering, if you add a new
cluster node after the initial cluster formation, then SNMPv3 users are not
replicated to the new node. You must remove the users, and
re-add them, and then redeploy your configuration to force the users to
replicate to the new node.
Syslog and clustering
Each node in the cluster generates
its own syslog messages. You can configure logging so that each node
uses either the same or a different device ID in the syslog message
header field. For example, the hostname configuration is replicated and
shared by all nodes in the cluster. If you configure logging to use the
hostname as the device ID, syslog messages generated by all nodes look
as if they come from a single node. If you configure logging to use the
local-node name that is assigned in the cluster bootstrap configuration
as the device ID, syslog messages look as if they come from different
nodes.
TLS/SSL connections and clustering
The decryption states of TLS/SSL connections are not synchronized, and if the
connection owner fails, then the decrypted connections will be reset. New
connections will need to be established to a new unit. Connections that are not
decrypted (they match a do-not-decrypt rule) are not affected and are replicated
correctly.
Cisco TrustSec and clustering
Only the control node learns security group tag (SGT) information. The
control node then populates the SGT to data nodes, and data nodes can make a
match decision for SGT based on the security policy.
VPN and clustering
Site-to-site VPN is a centralized feature; only the control unit supports VPN connections.
Note
Remote access VPN is not supported with clustering.
VPN functionality is limited to the control unit and does not take advantage of the cluster high availability capabilities.
If the control unit fails, all existing VPN connections are lost, and VPN users will see a disruption in service. When a new
control unit is elected, you must reestablish the VPN connections.
When you connect a VPN tunnel to a Spanned interface address, connections are automatically forwarded to the control unit.
VPN-related keys and certificates are replicated to all units.
Performance scaling factor
When you combine multiple units into a cluster, you can expect the total cluster performance to
be approximately 80% of the maximum combined throughput.
For example, for TCP throughput, the Firepower 9300 with 3 SM-40 modules can handle approximately
135 Gbps of real world firewall traffic when running alone. For 2 chassis, the maximum
combined throughput will be approximately 80% of 270 Gbps (2 chassis x 135 Gbps): 216
Gbps.
Control unit election
The control unit election is a automated process where cluster members determine which unit manages centralized features.
Election process and rules
Members of the cluster communicate over the cluster control link to elect a control unit as follows:
When you deploy the cluster, each unit broadcasts an election request every 3 seconds.
Any other units with a higher priority respond to the election request; the priority is set when you deploy the cluster and
is not configurable.
If after 45 seconds, a unit does not receive a response from another unit with a higher priority, then it becomes the control
unit.
If a unit later joins the cluster with a higher priority, it does not automatically become the control unit; the existing
control unit always remains as the control unit unless it stops responding, at which point a new control unit is elected.
In a split brain scenario when there are temporarily multiple control units, then the unit with highest priority retains the role while the
other units return to data unit roles.
Note
You can manually force a unit to become the control unit. For centralized features, if you force a control unit change, then
all connections are dropped, and you have to re-establish the connections on the new control unit.
High availability within the cluster
Clustering provides
high availability by monitoring chassis, unit, and interface health and by
replicating connection states between units.
Chassis-application monitoring
Chassis-application health monitoring is always enabled. The Firepower 4100/9300 chassis supervisor checks the Firewall Threat Defense application periodically (every second). If the Firewall Threat Defense device is up and cannot communicate with the Firepower 4100/9300 chassis supervisor for 3 seconds, the Firewall Threat Defense device generates a syslog message and leaves the cluster.
If the Firepower 4100/9300 chassis supervisor cannot communicate with the application after 45 seconds, it reloads the Firewall Threat Defense device. If the Firewall Threat Defense device cannot communicate with the supervisor, it removes itself from the cluster.
Unit health monitoring
Each unit periodically sends a broadcast keepaliveheartbeat packet over the
cluster control link. If the control node does not receive any keepaliveheartbeat packets or other
packets from a data node within the configurable timeout period, then the control node removes the data node
from the cluster. If the data nodes do not receive packets from the control node,
then a new control node is elected from the remaining node.
If nodes cannot reach each other over the cluster control link because of a network failure
and not because a node has actually failed, then the cluster may go into a "split
brain" scenario where isolated data nodes will elect their own control nodes. For
example, if a router fails between two cluster locations, then the original control
node at location 1 will remove the location 2 data nodes from the cluster.
Meanwhile, the nodes at location 2 will elect their own control node and form their
own cluster. Note that asymmetric traffic may fail in this scenario. After the
cluster control link is restored, then the control node that has the higher priority
will keep the control node’s role. See Control unit election for more information.
Interface monitoring
Each node monitors the link status of all hardware interfaces in use, and reports status changes
to the control node. For clustering on
multiple chassis, Spanned EtherChannels use the cluster Link Aggregation Control
Protocol (cLACP). Each chassis monitors the link status and the cLACP protocol
messages to determine if the port is still active in the EtherChannel, and informs
the Firewall Threat Defense application if the interface is down. When you enable health monitoring, all physical interfaces are monitored by
default (including the main EtherChannel for EtherChannel interfaces). Only named
interfaces that are in an Up state can be monitored. For example, all member ports of an
EtherChannel must fail before a named EtherChannel is removed from the cluster. You can optionally disable monitoring per
interface.
If a monitored interface fails on a particular node, but it is active on other nodes, then the
node is removed from the cluster. The amount of time before the Firewall Threat Defense device removes a node from the cluster depends on whether the node is an established member
or is joining the cluster. The Firewall Threat Defense device does not monitor interfaces for the first 90 seconds that a node joins the cluster.
Interface status changes during this time will not cause the Firewall Threat Defense device to be removed from the cluster. For an established member, the node is removed after
500 ms.
For clustering on multiple chassis, if you add or
delete an EtherChannel from the cluster, interface health-monitoring is suspended for 95
seconds to ensure that you have time to make the changes on each chassis.
Decorator application monitoring
When you install a decorator application on an interface, such as the Radware DefensePro application, then both the Firewall Threat Defense device and the decorator application must be operational to remain in the cluster. The unit does not join the cluster until both
applications are operational. Once in the cluster, the unit monitors the decorator application health every 3 seconds. If
the decorator application is down, the unit is removed from the cluster.
Status after failure
When a node in the cluster fails, the connections hosted by that node are
seamlessly transferred to other nodes; state information for traffic flows is
shared over the control node's cluster control link.
If the control node fails, then another member of the cluster with the
highest priority (lowest number) becomes the control node.
The Firewall Threat Defense automatically tries to rejoin the cluster, depending on the failure event.
Note
When the Firewall Threat Defense becomes inactive and fails to automatically rejoin the cluster, all data
interfaces are shut down; only the Management interface
can send and receive traffic.
Rejoining the cluster
After a cluster member is removed from the cluster, how it can rejoin the cluster depends on why it was removed:
Rejoining scenarios and automatic retry behavior
Failed cluster control link when initially joining—After you resolve the problem with the cluster control link, you must manually
rejoin the cluster by re-enabling clustering.
Failed cluster control link after joining the cluster—The Firewall Threat Defense automatically tries to rejoin every 5 minutes, indefinitely.
Failed data interface—The Firewall Threat Defense automatically tries to rejoin at 5 minutes, then at 10 minutes, and finally at 20 minutes. If the join is not successful
after 20 minutes, then the Firewall Threat Defense application disables clustering. After you resolve the problem with the data interface, you have to manually enable clustering.
Failed node—If the node was removed from the cluster because of a node health check failure, then rejoining the cluster depends
on the source of the failure. For example, a temporary power failure means the node will rejoin the cluster when it starts
up again as long as the cluster control link is up. The Firewall Threat Defense application attempts to rejoin the cluster every 5 seconds.
Internal error—Internal failures include: application sync timeout; inconsistent application statuses; and so on.
Failed configuration deployment—If you deploy a new configuration from Firewall Management Center, and the deployment fails on some cluster members but succeeds on others, then the nodes that failed are removed from the
cluster. You must manually rejoin the cluster by re-enabling clustering. If the deployment fails on the control node, then
the deployment is rolled back, and no members are removed. If the deployment fails on all data nodes, then the deployment is rolled back, and no members are removed.
Failed Chassis-Application Communication—When the Firewall Threat Defense application detects that the chassis-application health has recovered, it tries to rejoin the cluster automatically.
Data path connection state replication
Every connection has one owner and at least one backup owner in
the cluster. The backup owner does not take over the connection in the event of
a failure; instead, it stores TCP/UDP state information, so that the connection
can be seamlessly transferred to a new owner in case of a failure. The backup
owner is usually also the director.
Some traffic requires state information above the TCP or UDP
layer. See the following table for clustering support or lack of support for
this kind of traffic.
Table 3. Features Replicated Across the Cluster
Traffic
State Support
Notes
Up time
Yes
Keeps track of the system up time.
ARP Table
Yes
—
MAC address table
Yes
—
User Identity
Yes
—
IPv6 Neighbor database
Yes
—
Dynamic routing
Yes
—
SNMP Engine ID
No
—
How the cluster manages connections
Connections can be load-balanced to multiple nodes of the cluster.
Connection roles determine how connections are handled in both normal operation
and in a high availability situation.
Connection roles
See the following roles defined for each connection:
Owner—Usually, the node that initially receives the connection. The owner maintains the TCP state and processes packets. A
connection has only one owner. If the original owner fails, then when new nodes receive packets from the connection, the director
chooses a new owner from those nodes.
Backup owner—The node that stores TCP/UDP state information received from the owner, so that the connection can be seamlessly
transferred to a new owner in case of a failure. The backup owner does not take over the connection in the event of a failure.
If the owner becomes unavailable, then the first node to receive packets from the connection (based on load balancing) contacts
the backup owner for the relevant state information so it can become the new owner.
As long as the director (see below) is not the same node as the owner, then the director is also the backup owner. If the
owner chooses itself as the director, then a separate backup owner is chosen.
For clustering on the Firepower 9300, which can include up to 3 cluster nodes in one chassis, if the backup owner is on the
same chassis as the owner, then an additional backup owner will be chosen from another chassis to protect flows from a chassis
failure.
Director—The node that handles owner lookup requests from forwarders. When the owner receives a new connection, it chooses
a director based on a hash of the source/destination IP address and ports (see below for ICMP hash details), and sends a message
to the director to register the new connection. If packets arrive at any node other than the owner, the node queries the director
about which node is the owner so it can forward the packets. A connection has only one director. If a director fails, the
owner chooses a new director.
As long as the director is not the same node as the owner, then the director is also the backup owner (see above). If the
owner chooses itself as the director, then a separate backup owner is chosen.
ICMP/ICMPv6 hash details:
For Echo packets, the source port is the ICMP identifier, and the destination port is 0.
For Reply packets, the source port is 0, and the destination port is the ICMP identifier.
For other packets, both source and destination ports are 0.
Forwarder—A node that forwards packets to the owner. If a forwarder receives a packet for a connection it does not own, it
queries the director for the owner, and then establishes a flow to the owner for any other packets it receives for this connection.
The director can also be a forwarder. Note that if a forwarder receives the SYN-ACK packet, it can derive the owner directly
from a SYN cookie in the packet, so it does not need to query the director. (If you disable TCP sequence randomization, the
SYN cookie is not used; a query to the director is required.) For short-lived flows such as DNS and ICMP, instead of querying,
the forwarder immediately sends the packet to the director, which then sends them to the owner. A connection can have multiple
forwarders; the most efficient throughput is achieved by a good load-balancing method where there are no forwarders and all
packets of a connection are received by the owner.
Note
We do not recommend disabling TCP sequence randomization when using clustering. There is a small chance that some TCP sessions
won't be established, because the SYN/ACK packet might be dropped.
Fragment Owner—For fragmented packets, cluster nodes that receive a fragment determine a fragment owner using a hash of the
fragment source IP address, destination IP address, and the packet ID. All fragments are then forwarded to the fragment owner
over the cluster control link. Fragments may be load-balanced to different cluster nodes, because only the first fragment
includes the 5-tuple used in the switch load balance hash. Other fragments do not contain the source and destination ports
and may be load-balanced to other cluster nodes. The fragment owner temporarily reassembles the packet so it can determine
the director based on a hash of the source/destination IP address and ports. If it is a new connection, the fragment owner
will register to be the connection owner. If it is an existing connection, the fragment owner forwards all fragments to the
provided connection owner over the cluster control link. The connection owner will then reassemble all fragments.
Port Address Translation Connections
New connection ownership
When a new connection is directed to a node of the cluster via load balancing, that node owns
both directions of the connection. If any connection packets arrive at a different node,
they are forwarded to the owner node over the cluster control link. If a reverse flow
arrives at a different node, it is redirected back to the original node.
Sample data flow for TCP
The following example shows the establishment of a new
connection.
The SYN packet originates from the client and is delivered to one Firewall Threat Defense (based on the load balancing method), which becomes the owner. The
owner creates a flow, encodes owner information into a SYN cookie, and
forwards the packet to the server.
The SYN-ACK packet originates from the server and is delivered to a
different Firewall Threat Defense (based on the load balancing method). This Firewall Threat Defense is the forwarder.
Because the forwarder does not own the connection, it decodes
owner information from the SYN cookie, creates a forwarding flow to the owner,
and forwards the SYN-ACK to the owner.
The owner sends a state update to the director, and forwards the
SYN-ACK to the client.
The director receives the state update from the owner, creates a
flow to the owner, and records the TCP state information as well as the owner.
The director acts as the backup owner for the connection.
Any subsequent packets delivered to the forwarder will be
forwarded to the owner.
If packets are delivered to any additional nodes, it will query the
director for the owner and establish a flow.
Any state change for the flow results in a state update from the
owner to the director.
Sample data flow for ICMP and UDP
The following example shows the establishment of a new connection.
Figure 9. ICMP and UDP Data Flow
The first UDP packet originates from the client and is delivered
to one Firewall Threat Defense (based on the load balancing method).
The node that received the first packet queries the director node that is chosen based on a
hash of the source/destination IP address and ports.
The director finds no existing flow, creates a director flow and forwards the packet back
to the previous node. In other words, the director has elected an owner
for this flow.
The owner creates the flow, sends a state update to the director, and
forwards the packet to the server.
The second UDP packet originates from the server and is delivered to the
forwarder.
The forwarder queries the director for ownership information. For
short-lived flows such as DNS, instead of querying, the forwarder
immediately sends the packet to the director, which then sends it to the
owner.
The director replies to the forwarder with ownership information.
The forwarder creates a forwarding flow to record owner information and
forwards the packet to the owner.
The owner forwards the packet to the client.
History for clustering
Table 4.
Feature
Minimum Firewall Management Center
Minimum Firewall Threat Defense
Details
MTU ping test on cluster node join provides more information by
trying smaller MTUs
10.0.0
10.0.0
When a node joins the cluster, it checks MTU compatibility by sending
a ping to the control node with a packet size matching the cluster
control link MTU. If the ping fails, it tries the MTU divided by 2
and keeps dividing by 2 until an MTU ping is successful. The
successful ping value is shown in show cluster info
trace so you can fix the MTU to a working
value and try again.
Even if the ping fails, the node is allowed to join the cluster. In
this case, you need to resolve the MTU mismatch as soon as
possible.
We recommend increasing the switch MTU size to the recommended value,
but if you can't change the switch configuration, a working value
for the cluster control link will let you form the cluster.
Added/modified commands: show cluster info
trace, show cluster
history.
MTU ping test from data node on node
join
7.6.0
7.6.0
When a node joins the cluster, it checks MTU compatibility by
sending a ping to the control node with a packet size twice
the cluster control link MTU. Previously, only the control
node sent a ping. If the ping fails, a notification is
generated so you can fix the MTU mismatch on connecting
switches and try again.
Added/modified commands: show cluster
history.
Cluster control link ping
tool.
7.2.6/7.4.1
Any
You can check to make sure all the cluster nodes can reach
each other over the cluster control link by performing a
ping. One major cause for the failure of a node to join the
cluster is an incorrect cluster control link configuration;
for example, the cluster control link MTU may be set higher
than the connecting switch MTUs.
New/modified screens: Devices > Device Management > More > Cluster Live Status.
Troubleshooting file generation
and download available from Device and Cluster
pages.
7.4.1
7.4.1
You can generate and download troubleshooting files for each device on the Device page and also for all cluster nodes on the
Cluster page. For a cluster, you can download all files as a single compressed file. You can also include cluster logs for
the cluster for cluster nodes. You can alternatively trigger file generation from the Devices > Device Management > More > Troubleshoot Files menu.
New/modified screens:
Devices > Device Management > Device > General
Devices > Device Management > Cluster > General
View CLI output for a device or device
cluster.
7.4.1
Any
You can view a set of pre-defined CLI outputs that can help
you troubleshoot the device or cluster. You can also enter
any show command and see the
output.
New/modified screens: Devices > Device Management > Cluster > General
If you previously configured these settings using FlexConfig, be
sure to remove the FlexConfig configuration before you deploy.
Otherwise the FlexConfig configuration will overwrite the
management center configuration.
Cluster health monitor dashboard.
7.3.0
Any
You can now view cluster health on the cluster health monitor
dashboard.
New/Modified screens: System > Health > Monitor
Support for 16-node clusters.
7.2.0
7.2.0
You can now configure 16 node clusters for the Firepower 4100/9300.
Previously, the maximum was 6 units.
New/Modified screens: none.
Supported platforms: Firepower 4100/9300
Cluster deployment for firewall changes completes faster.
7.1.0
7.1.0
Cluster deployment for firewall changes now completes faster.
New/Modified screens: none.
Improved PAT port block allocation for clustering.
7.0.0
7.0.0
The improved PAT port block allocation ensures that the control unit
keeps ports in reserve for joining nodes, and proactively reclaims
unused ports. To best optimize the allocation, you can set the
maximum nodes you plan to have in the cluster using the
cluster-member-limit command using
FlexConfig. The control unit can then allocate port blocks to the
planned number of nodes, and it will not have to reserve ports for
extra nodes you don't plan to use. The default is 16 nodes. You can
also monitor syslog 747046 to ensure that there are enough ports
available for a new node.
New/Modified commands: cluster-member-limit
(FlexConfig), show nat pool cluster
[summary] , show nat pool ip
detail
Cluster deployment for Snort changes completes faster, and fails
faster when there is an event.
6.7.0
6.7.0
Cluster deployment for Snort changes now completes faster. Also, when a cluster has an
event that causes a Firewall Management Center deployment to fail, the failure now occurs more quickly.
New/Modified screens: none.
Improved cluster management.
6.7.0
6.7.0
Firewall Management
Center has improved cluster management functionality that formerly you
could only accomplish using the CLI, including:
Enable and disable cluster units
Show cluster status from the Device Management page,
including History and Summary per unit
Change the role to the control unit
New/Modified screens:
Devices > Device Management > More menu
Devices > Device Management > Cluster > General area > Cluster Live
Status link Cluster
Status
Supported platforms: Firepower 4100/9300
Multi-instance clustering.
6.6.0
6.6.0
You can now create a cluster using container instances. On the
Firepower 9300, you must include one container instance on each
module in the cluster. You cannot add more than one container
instance to the cluster per security engine/module. We recommend
that you use the same security module or chassis model for each
cluster instance. However, you can mix and match container instances
on different Firepower 9300 security module types or Firepower 4100
models in the same cluster if required. You cannot mix Firepower
9300 and 4100 instances in the same cluster.
New/Modified FXOS commands: set port-type
cluster
New/modified Firepower Chassis Manager screens:
Logical Devices > Add Cluster
Interfaces > All Interfaces > Add New drop-down menuSubinterface Type field
Supported platforms: Firewall Threat Defense on the Firepower 4100/9300
Configuration sync to data units in parallel.
6.6.0
6.6.0
The control unit now syncs configuration changes with data units in
parallel by default. Formerly, synching occurred sequentially.
New/Modified screens: none.
Messages for cluster join failure or eviction added to
show cluster history.
6.6.0
6.6.0
New messages were added to the show cluster
history command for when a cluster unit either
fails to join the cluster or leaves the cluster.
New/Modified commands: show cluster
history
New/Modified screens: none.
Initiator and responder information for Dead Connection Detection
(DCD), and DCD support in a cluster.
6.5.0
6.5.0
If you enable Dead Connection Detection (DCD), you can use the
show conn detail command to get
information about the initiator and responder. Dead Connection
Detection allows you to maintain an inactive connection, and the
show conn output tells you how
often the endpoints have been probed. In addition, DCD is now
supported in a cluster.
New/Modified commands: show conn (output
only).
Supported platforms: Firewall Threat Defense on the Firepower 4100/9300
Adding clusters is easier.
6.3.0
6.3.0
You can now add any unit of a cluster to the Firewall Management Center, and the other cluster units are detected automatically.
Formerly, you had to add each cluster unit as a separate device, and
then group them into a cluster. Adding a cluster unit is also now
automatic. Note that you must delete a unit manually.
Devices > Device Management > Cluster tabGeneral areaCluster Registration Status Current Cluster Summary link Cluster Status dialog box
Supported platforms: Firewall Threat Defense on the Firepower 4100/9300
Support for site-to-site VPN with clustering as a centralized
feature.
6.2.3.3
6.2.3.3
You can now configure site-to-site VPN with clustering. Site-to-site
VPN is a centralized feature; only the control unit supports VPN
connections.
Supported platforms: Firewall Threat Defense on the Firepower 4100/9300
Automatically rejoin the cluster after an internal failure.
6.2.3
6.2.3
Formerly, many internal error conditions caused a cluster unit to be
removed from the cluster, and you were required to manually rejoin
the cluster after resolving the issue. Now, a unit will attempt to
rejoin the cluster automatically at the following intervals: 5
minutes, 10 minutes, and then 20 minutes. Internal failures include:
application sync timeout; inconsistent application statuses; and so
on.
New/Modified command: show cluster info auto-join
No modified screens.
Supported platforms: Firewall Threat Defense on the Firepower 4100/9300
Clustering on multiple chassis for 6 modules; Firepower 4100
support.
6.2.0
6.2.0
With FXOS 2.1.1, you can now enable clustering on multiple chassis of
the Firepower 9300 and 4100. For the Firepower 9300, you can include
up to 6 modules. For example, you can use 1 module in 6 chassis, or
2 modules in 3 chassis, or any combination that provides a maximum
of 6 modules. For the Firepower 4100, you can include up to 6
chassis.
Note
Inter-site clustering is also supported. However, customizations
to enhance redundancy and stability, such as site-specific MAC
and IP addresses, director localization, site
redundancy, and cluster flow mobility, are only
configurable using the FlexConfig feature.
No modified screens.
Supported platforms: Firewall Threat Defense on the Firepower 4100/9300
Clustering on multiple modules with one
Firepower 9300 chassis.
6.0.1
6.0.1
You can cluster up to 3 security modules within
the Firepower 9300 chassis. All modules in the chassis must belong
to the cluster.
New/Modified screens:
Devices > Device Management > Add > Add Cluster
Devices > Device Management > Cluster
Supported platforms: Firewall Threat Defense on the Firepower 9300

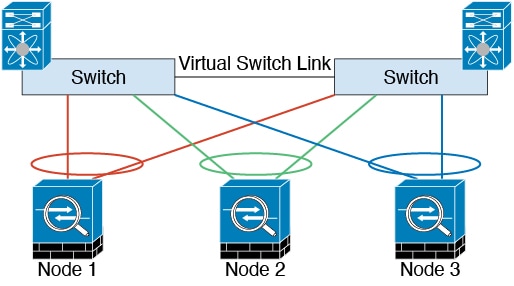
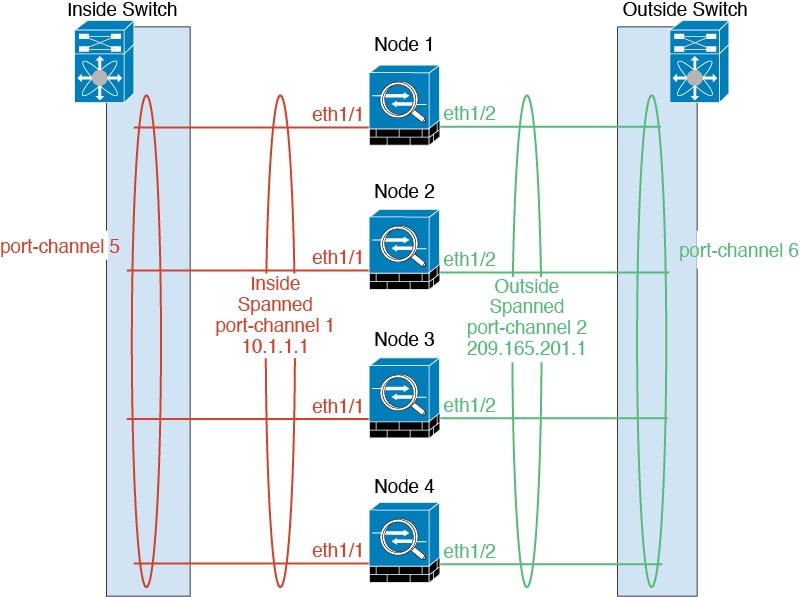
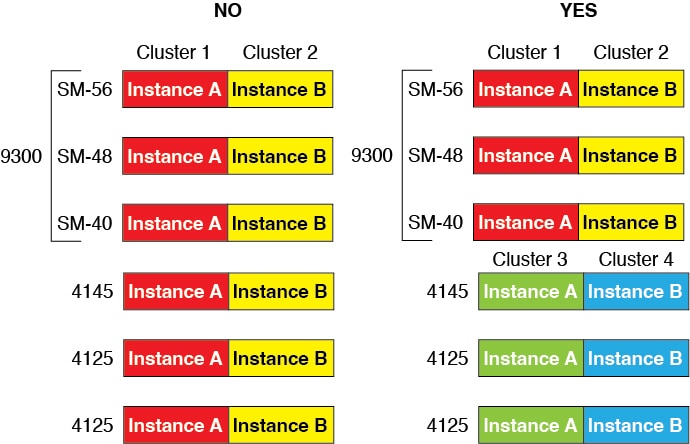
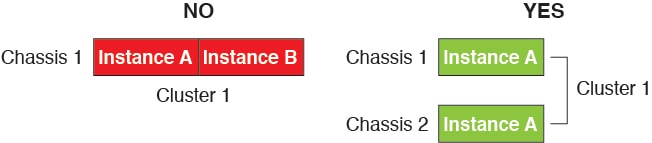
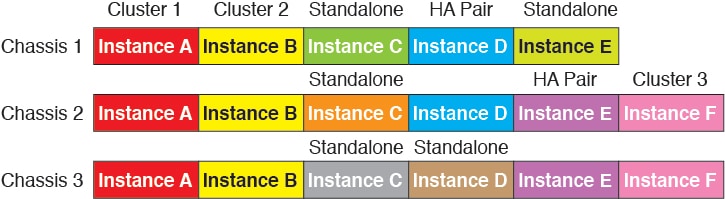
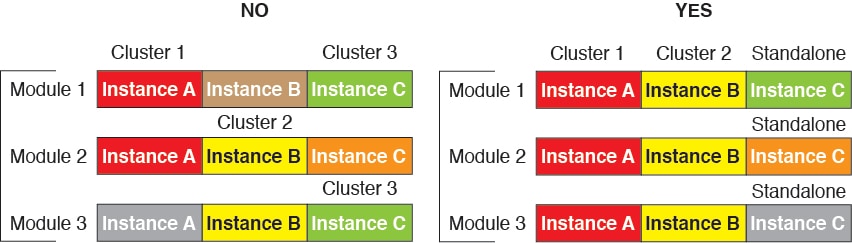
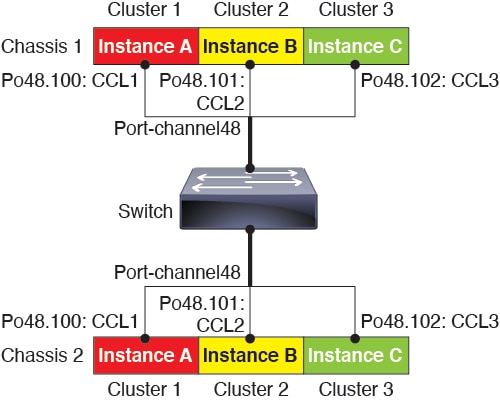
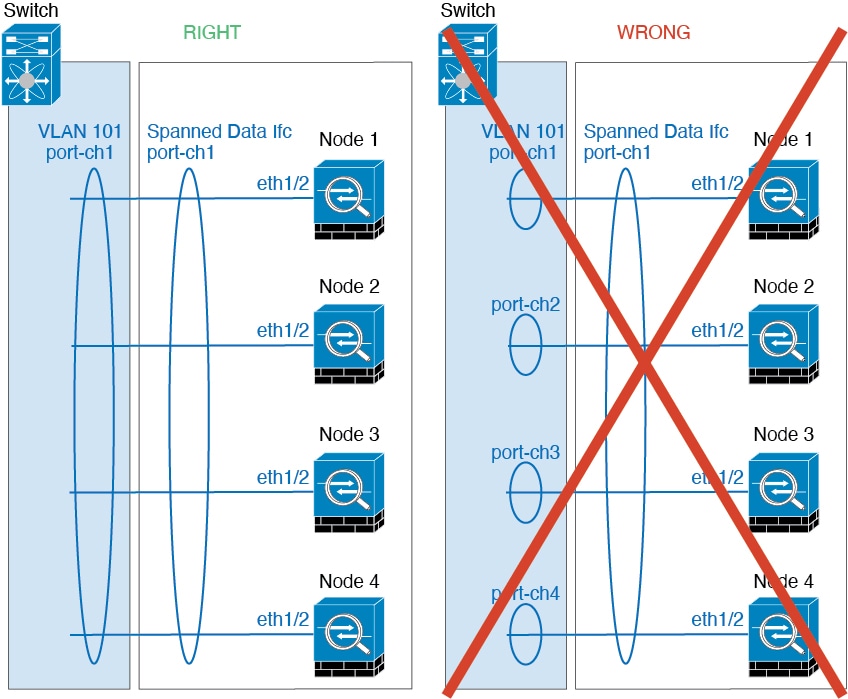
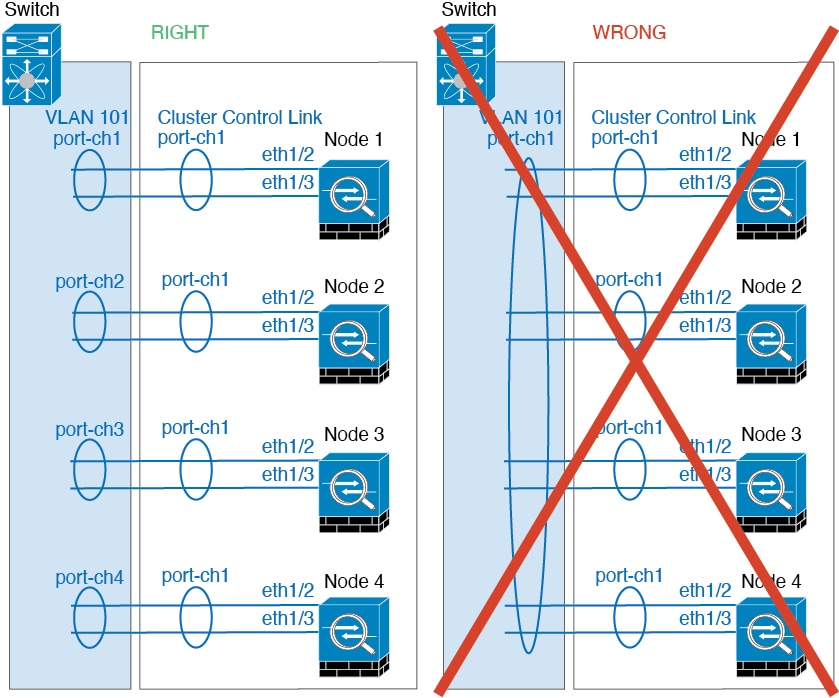
 ) for the instance, then click Refresh (
 ) on the area.
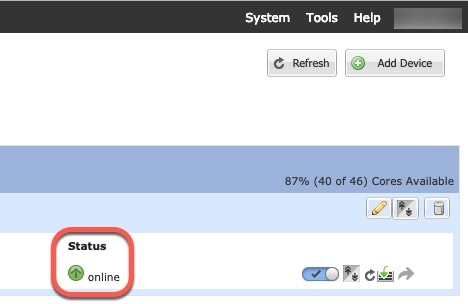
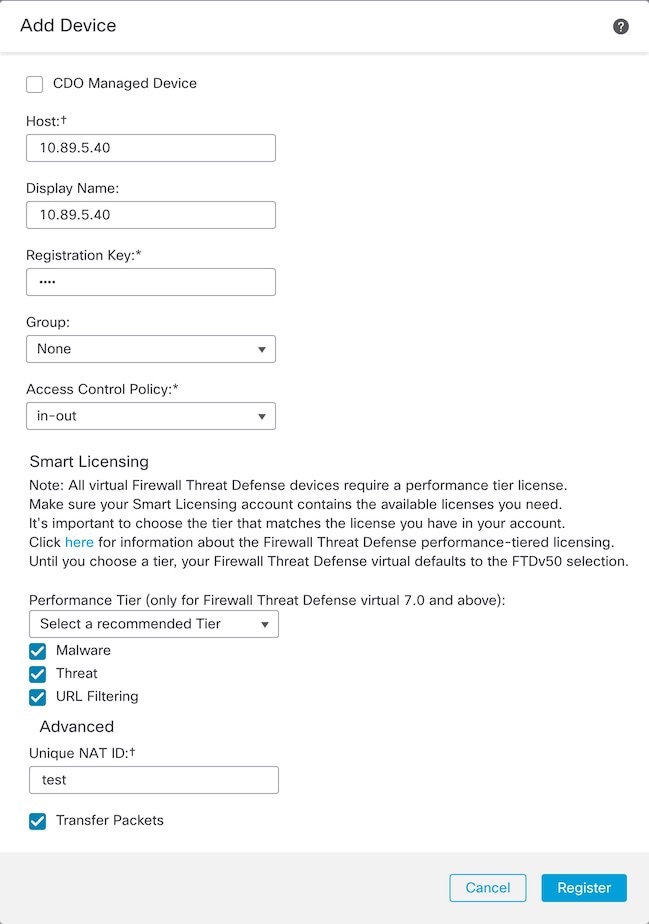
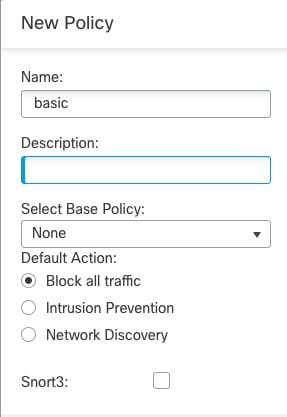
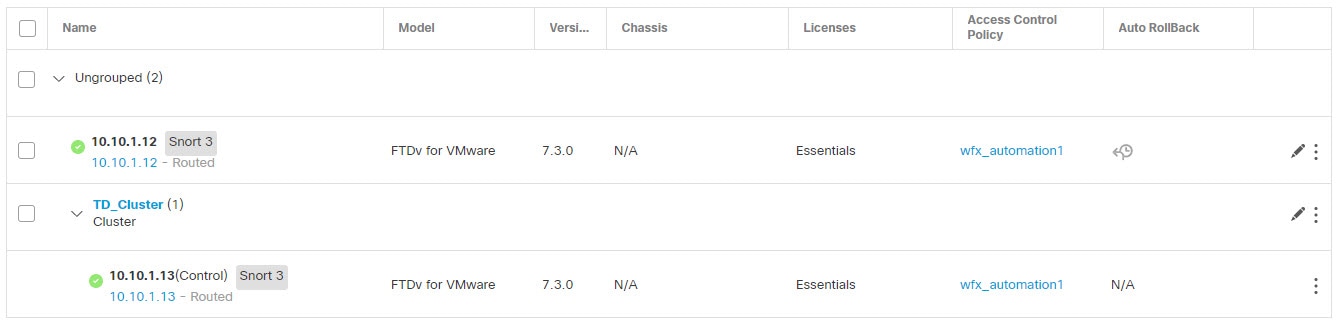
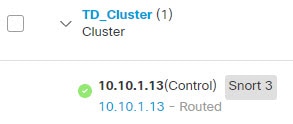
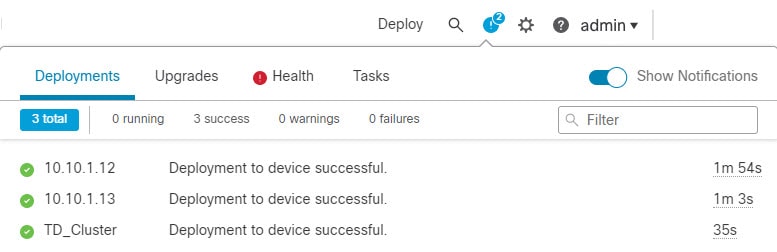

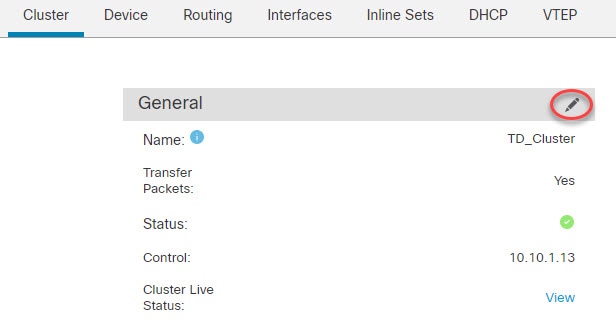
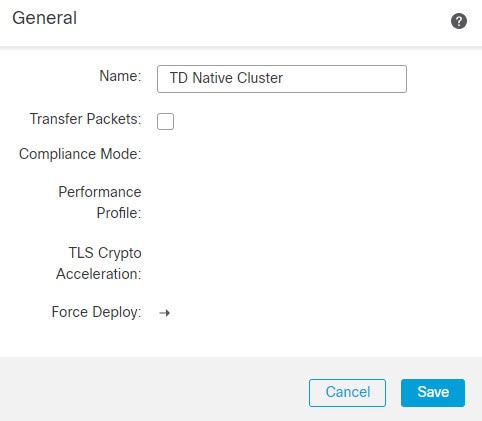
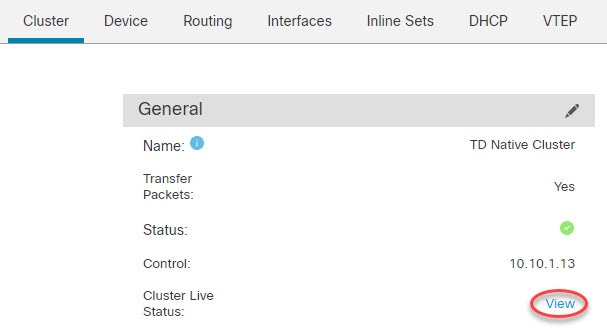
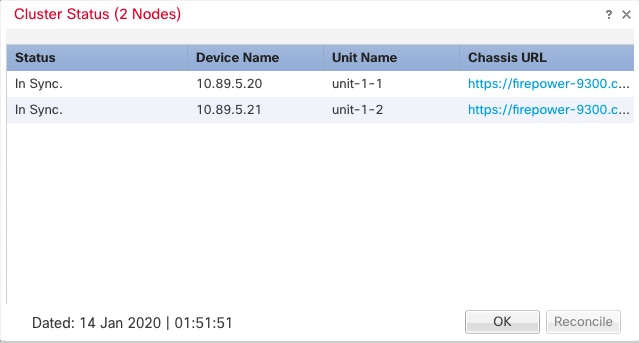
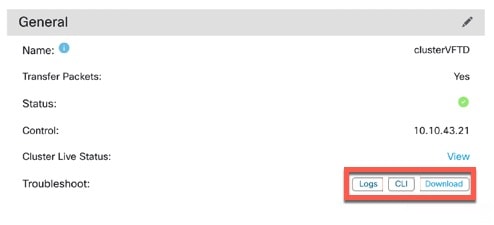
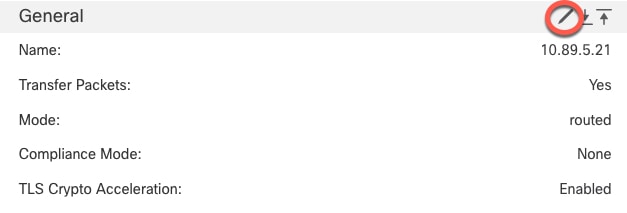
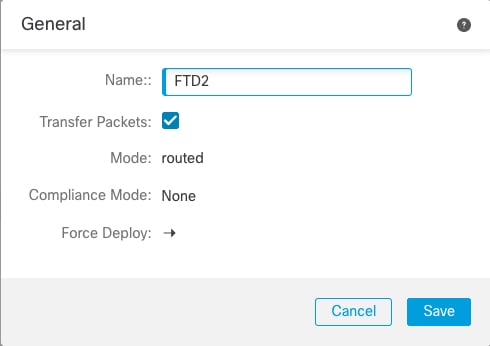

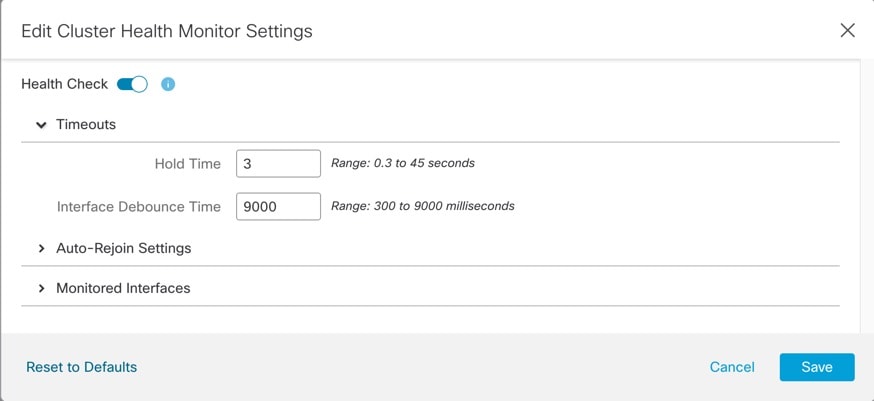
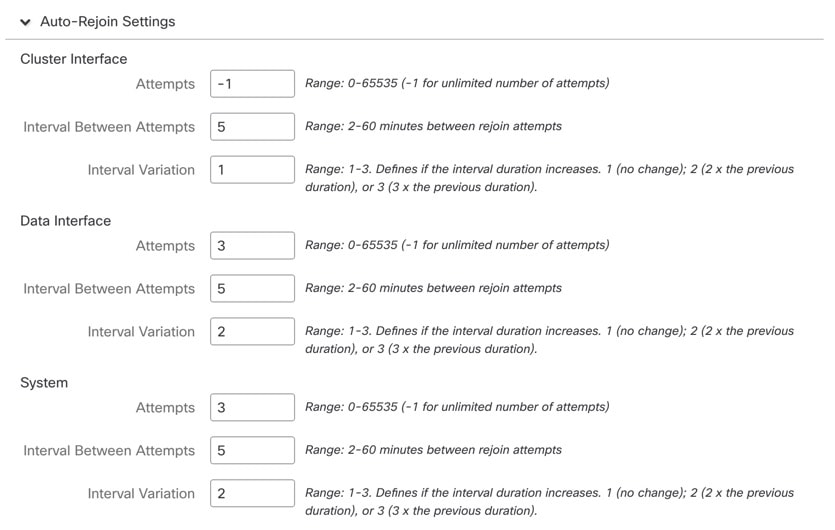
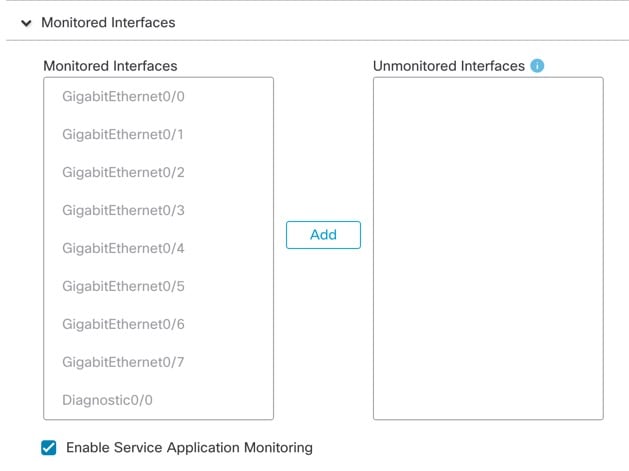
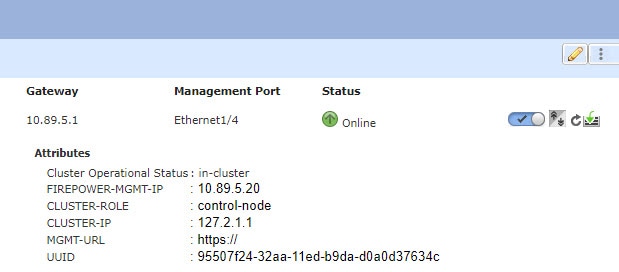


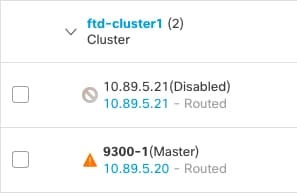


 ) icon or from the and then chose Add, Cluster page, General area, and Cluster Live Status link.
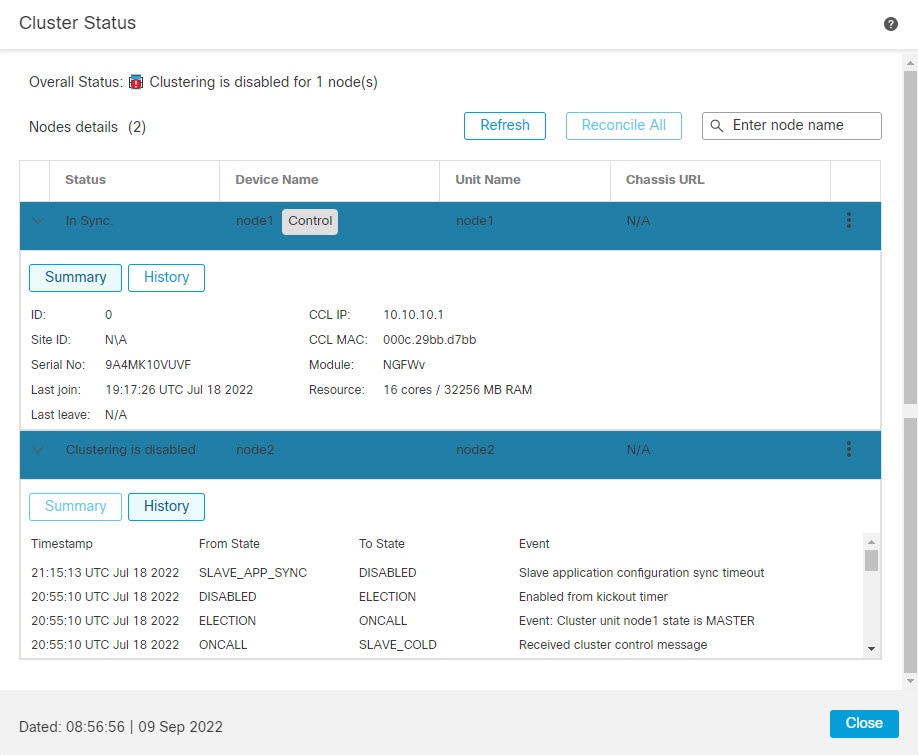
 ), and then click Tasks.


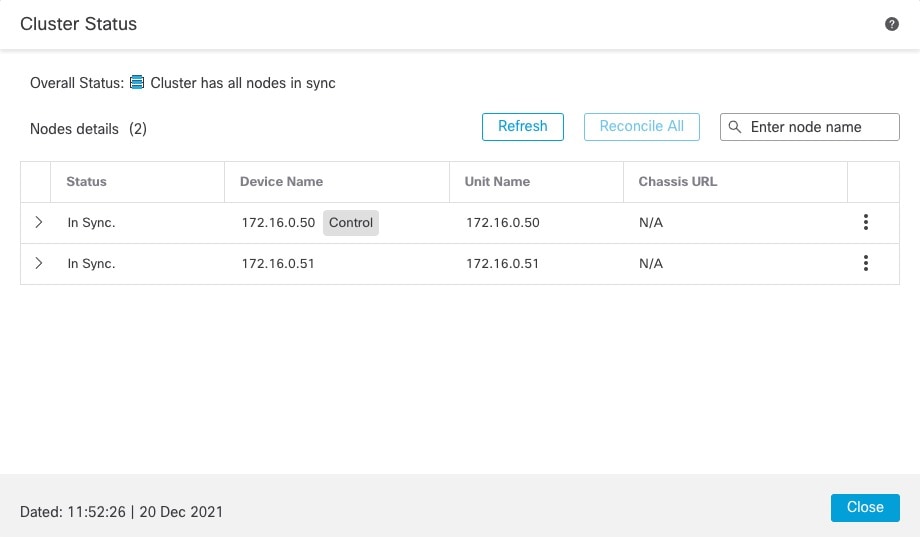
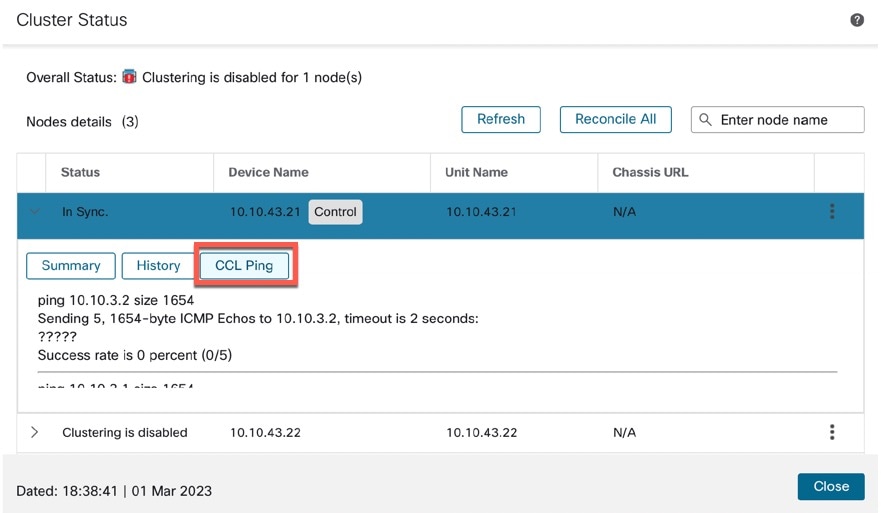
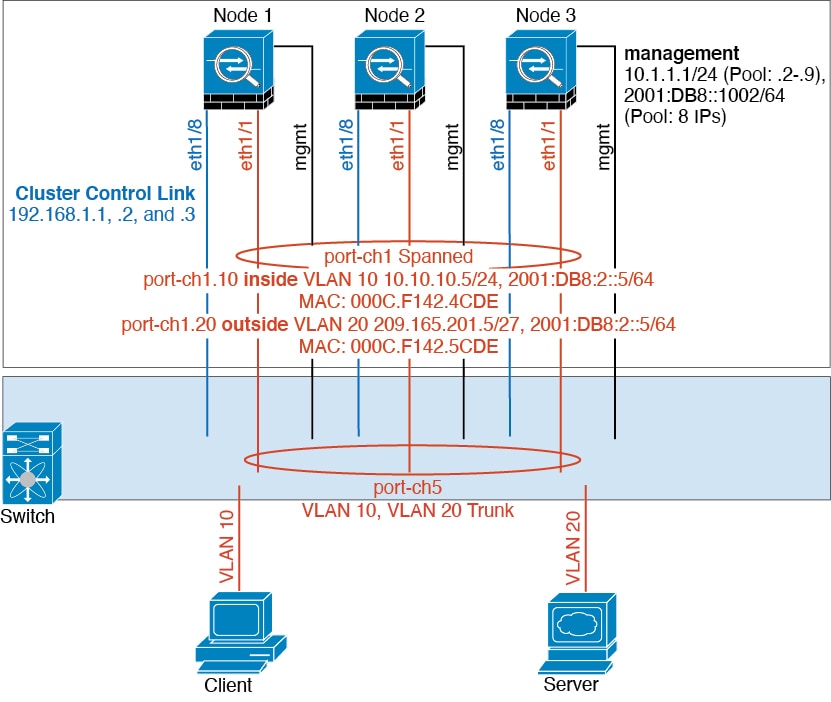
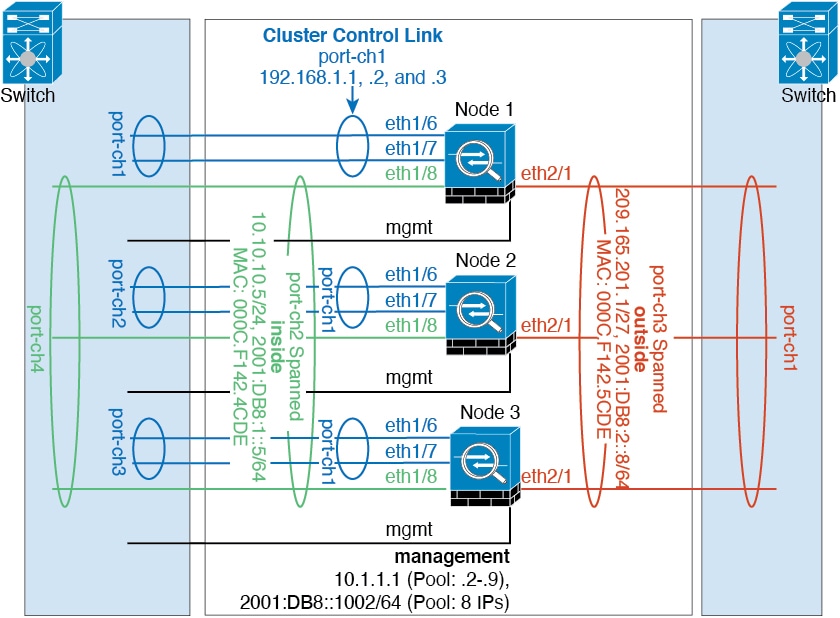
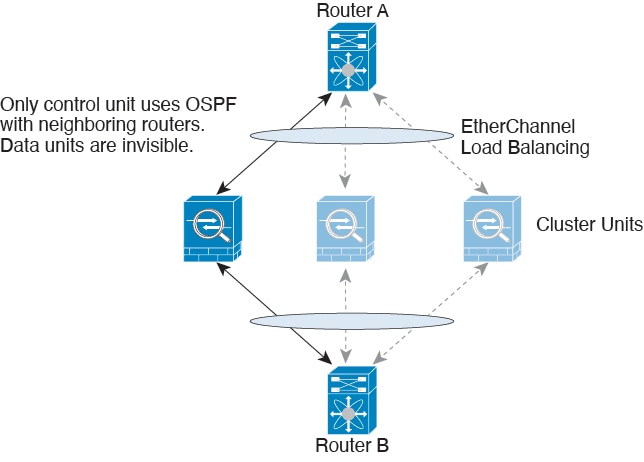
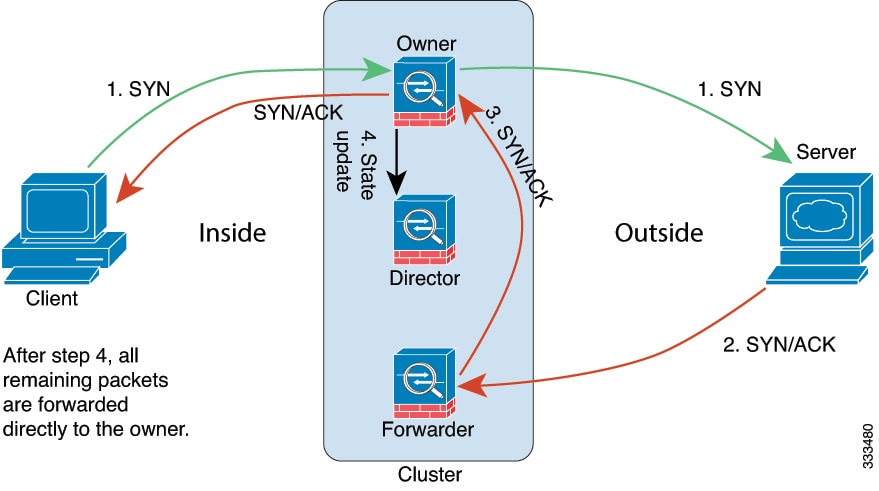
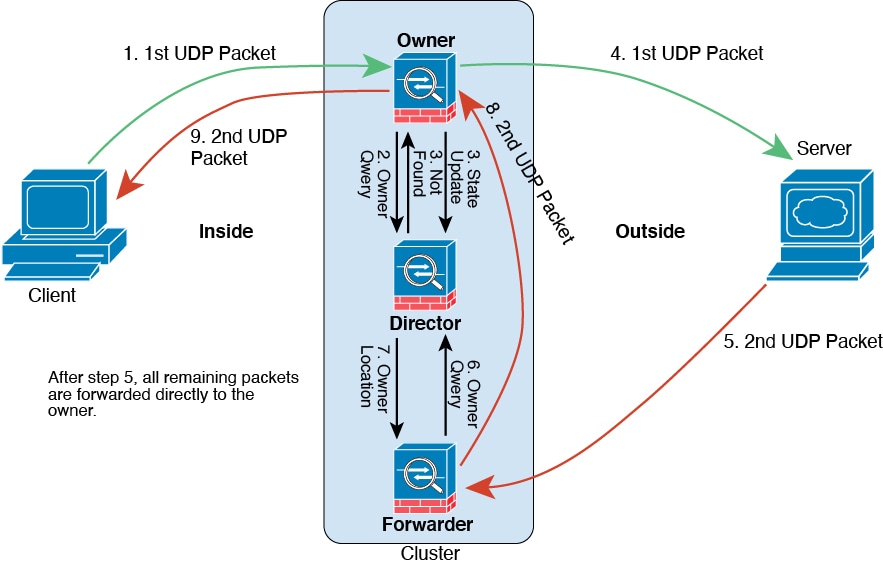
 Feedback