eStreamer eNcore Operations Guide v 0.8
Available Languages

Firepower eNcore Operations Guide
First Published: November 11, 2017
Last Updated: July 6, 2021
 Table of Contents
3.1.1 Python 2.7 or Python 3.6+ Installation
3.1.3 EPEL Repo Dependency for RHEL
3.1.4 Running eNcore CLI on Azure
3.1.5 Running eNcore CLI on Windows
3.2 Installing eStreamer eNcore CLI
3.2.1 Build the eNcore Client from Source
3.3 eStreamer eNcore CLI Configuration
4 Cisco eStreamer eNcore for Sentinel
4.1.1 Configuring Encore to Stream UDP
4.1.2 Creating a Sentinel Workspace
4.1.3 Setting up the CEF Data Connector
5 Cisco eStreamer eNcore Add-on for Splunk 8.1+ (TA-eStreamer)
5.2.1 Installing the eNcore Add-on for Splunk (TA-eStreamer)
5.2.2 Installing the eNcore Dashboard for Splunk (eStreamer Dashboard)
5.3 eNcore Add-on for Splunk Setup Configuration
5.3.3 eNcore Add-on Setup Configuration
6 Firepower Dashboard for Splunk
6.1 Inbound/Outbound Subnet Configuration
7 Configuration Options – All Platforms
7.9 Advanced Configuration Settings
8.3 Frequently Asked Questions
11.1 Firepower Management Center eStreamer Client Certificate Creation
11.2 Example Configuration File
About This Guide
| Author |
Seyed Khadem (skhademd) |
| Change Authority |
Cisco Systems Advanced Services, Security & Collaboration IDT, Implementation Americas |
| Content ID |
|
| Project ID |
Revision History
| Revision |
Date |
Name or User ID |
Comments |
| 1.0 |
00/00/2021 |
Initial Release |
Conventions
This document uses the following conventions.
| Convention |
Indication |
| bold font |
Commands and keywords and user-entered text appear in bold font. |
| italic font |
Document titles, new or emphasized terms, and arguments for which you supply values are in italic font. |
| [ ] |
Elements in square brackets are optional. |
| {x | y | z } |
Required alternative keywords are grouped in braces and separated by vertical bars. |
| [ x | y | z ] |
Optional alternative keywords are grouped in brackets and separated by vertical bars. |
| String |
A non-quoted set of characters. Do not use quotation marks around the string or the string will include the quotation marks. |
| courier font |
Terminal sessions and information the system displays appear in courier font. |
| < > |
Nonprinting characters such as passwords are in angle brackets. |
| [ ] |
Default responses to system prompts are in square brackets. |
| !, # |
An exclamation point (!) or a pound sign (#) at the beginning of a line of code indicates a comment line. |
Note: Means reader take note. Notes contain helpful suggestions or references to material not covered in the manual.
Caution: Means reader be careful. In this situation, you might perform an action that could result in equipment damage or loss of data.
1 Introduction
2 Document Purpose
This document outlines the background and usage of the eStreamer eNcore client for CLI, Splunk, and Sentinel to assist users with installation and execution.
2.1 Background
The Cisco Event Streamer (eStreamer) allows users to stream system intrusion, discovery, and connection data from a Firepower Management Center or managed device (the eStreamer server) to external client applications. eStreamer responds to client requests with terse, compact, binary encoded messages that facilitate high performance.
Historically, the eStreamer SDK has been wrapped with some additional code to create separate Perl applications (e.g., the Cisco eStreamer for Splunk app and the CEF agent).
2.2 Application Summary
eStreamer eNcore is a multi-platform, multi-process Python application that is compatible with Firepower Management Center versions 6.0 and above.
eNcore is an all-purpose client, which requests all possible events from eStreamer, parses the binary content, and outputs events in various formats to support other Security Information and Event Management tools (SIEMs). eNcore was built from scratch in Python with a scalable and fast multi-process architecture. It supports version 6.0 of Firepower Management Center. It was built and tested on CentOS 7, but should work with any Linux distribution that supports the pre-requisites. The software will run on Windows but is not supported.
There are three packages associated with eStreamer eNcore:
· eNcore CLI
· eNcore Add-on for Splunk
· eNcore Dashboard for Splunk
This guide addresses all the three packages.
3 Cisco eNcore CLI
eNcore CLI is a command line interface for eStreamer eNcore. It runs as a standalone application that requests events from the Firepower Management Center eStreamer server and outputs these events in one of these formats:
· Key-value pairs designed to maintain compatibility with previous Splunk collectors
· JSON
· CEF for Arcsight which maintains backwards compatibility with the previous cef-agent.
The output can be streamed to files, a TCP or UDP network port, or stdout.
3.1 eNcore CLI Prerequisites
eNcore CLI works with any Linux distribution that supports the prerequisites. It will run on Windows although it has not been made production-ready.
There are two main prerequisites for the platform on which eNcore will be installed:
· Python 2.7 or Python 3.6+
· pyOpenSSL
The CLI version of eNcore can be run on either Python 2.7 or Python 3.6+. You must also have a means of splitting the Firepower Management Center’s PKCS12 file. The default approach is to install pyOpenSSL and let eNcore do the work for you.
Note: The encore.sh script should guide you through all these points if you wish to get going immediately, but it is worth being familiar with these points prior to install.
To check whether Python 2.7 is present, use following command:
which python
To test where Python 2.7 is present, use the following command:
whereis python
If Python has been installed, the which Python command provides the path to the installation directory. For example, if the output of the command is /usr/bin/python, then Python has been installed. To determine whether the installed Python is v2.7, list the contents of the parent of the installation directory (in the above example, the /usr/bin directory). For example, suppose the listing shows an entry such as the following:
lrwxrwxrwx 1 root root 9 Dec 9 2015 python -> python2.7*
This entry shows that python is a link to the python2.7 directory, where Python v2.7 is installed. Another command, whereis python, can also be used to show if a python2.7 directory exists.
Note: If you are installing the CLI version on a device running Splunk, then it is worth noting that Splunk has its own version of Python. The Splunk Python has been compiled differently from the normal distribution – specifically, it is built with PyUnicodeUCS2. The encore.sh script will detect this and warn you. If you encounter this problem, then you will need to create a new user and run eStreamer-eNcore as that user. You should consider running the Splunk add-on instead.
To check for pyOpenSSL, use the following command:
pip list | grep -i pyOpenSSL
Alternatively using the python3 version will no longer require the pyUnicodeUS4 complication. To access the python3 branch perform the following: git checkout python3
3.1.1 Python 2.7 or Python 3.6+ Installation
To install Python on CentOS, use the following command:
sudo yum install python
3.1.2 pyOpenSSL Installation
pyOpenSSL may have been installed as part of the Python 2.7 installation. To check whether it is installed, use the following command:
pip list | grep -i pyOpenSSL
If pip is not installed, it can be installed on CentOS with this command:
sudo python get-pip.py
Install pyOpenSSL with the following command:
sudo yum install python-pip python-devel openssl-devel gcc
sudo pip install pyOpenSSL
If you are using python3 branch, then run the following command:
sudo pip3 install pyOpenSSL
3.1.3 EPEL Repo Dependency for RHEL
If you are having problems installing these packages, then you may need to enable the EPEL repository. Instructions for installing and enabling the EPEL repository are available in the internet.
Red Hat's guide to EPEL:
https://access.redhat.com/solutions/3358
https://www.redhat.com/en/blog/whats-epel-and-how-do-i-use-it
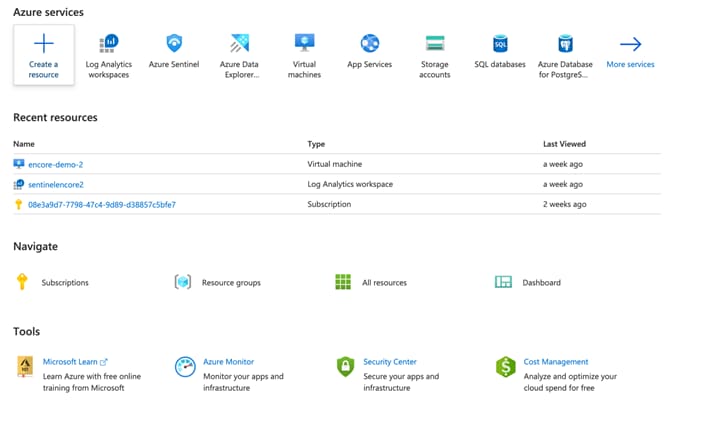
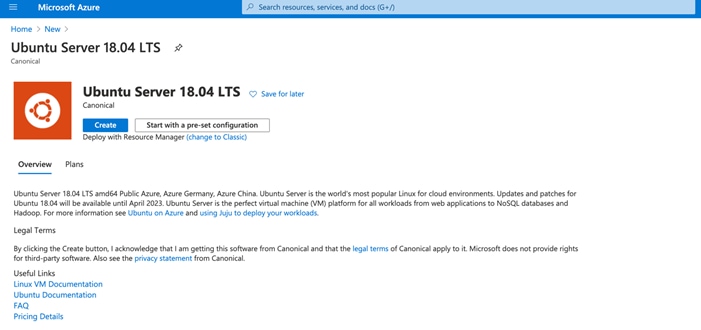
3.1.4 Running eNcore CLI on Azure
1 Create a new Linux resource, such as Ubuntu 18.04 LTS:
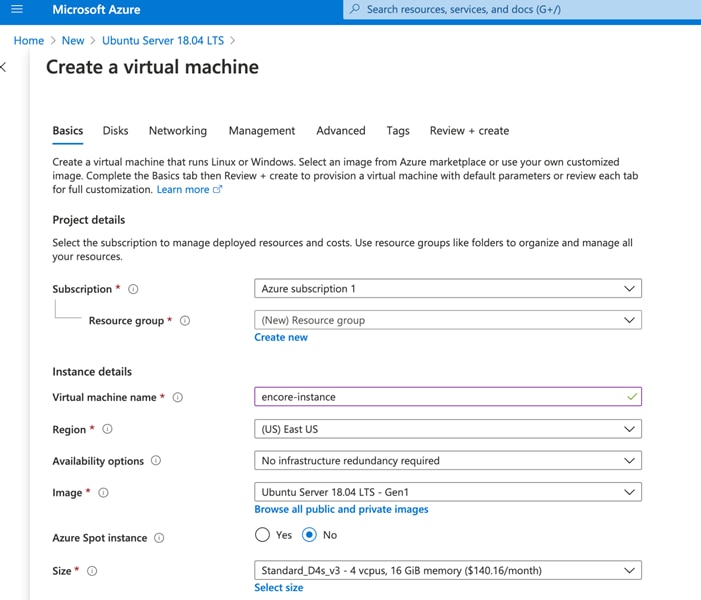
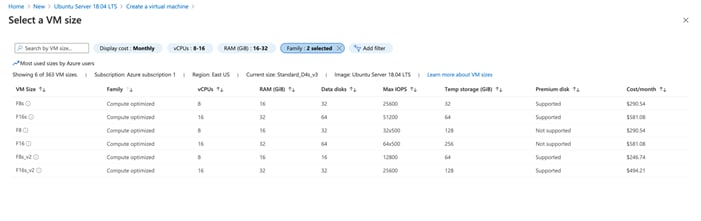
2 Assign CPU(s) to the Virtual Instance. eNcore CLI can support up to 12 threads. We recommend using 8-16 cores optimized computer. eNcore CLI can support up to 7k events/second using the 16 CPU F16s_v2 option.
3 Scale according to the expected volume of your organization, the minimum recommended number of CPUs is 4 for low volume (<500 events/second) operations.
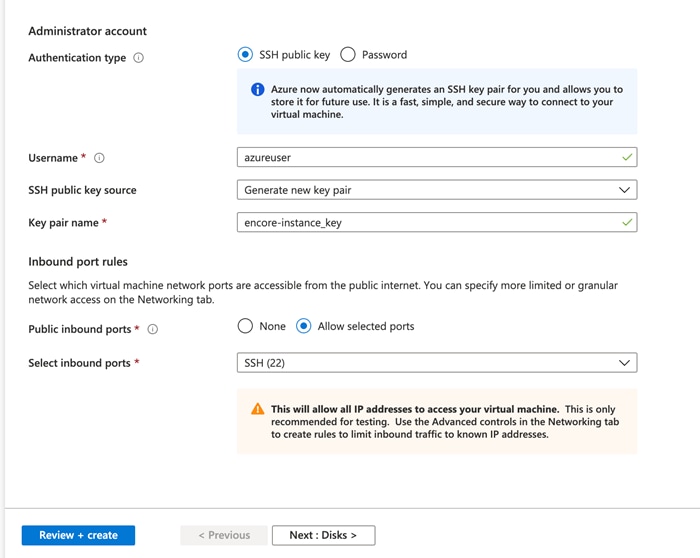
4 Name your instance and download the PEM certificates.
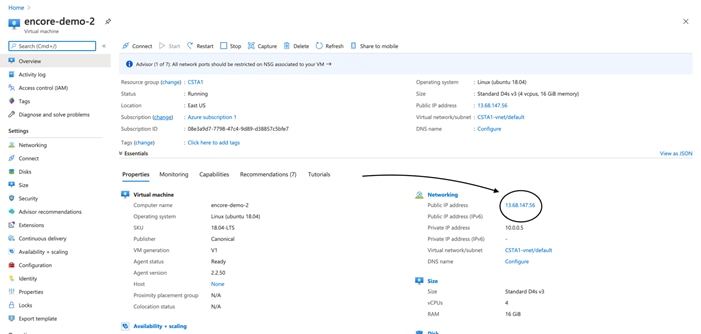
Make a note of the Public IP assigned to your instance, you will use this to create a certificate in the Firepower Management Center eStreamer.
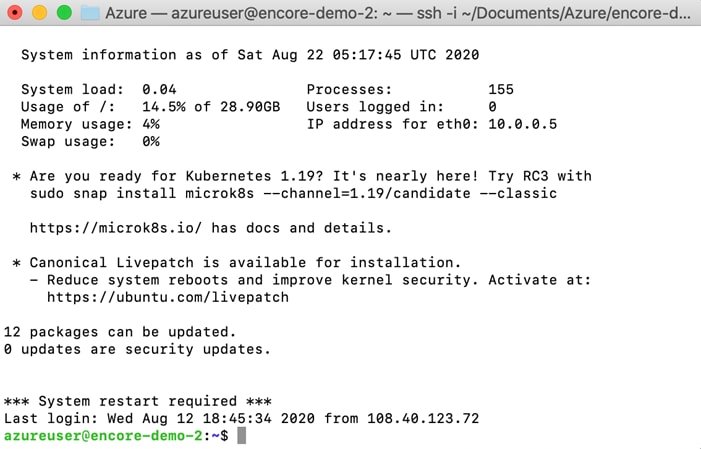
5 Connect to the Command Line version of your instance using the .pem file. Now you are ready to proceed with the installation. Azure also has a shortcut to enable a quick command line connection.
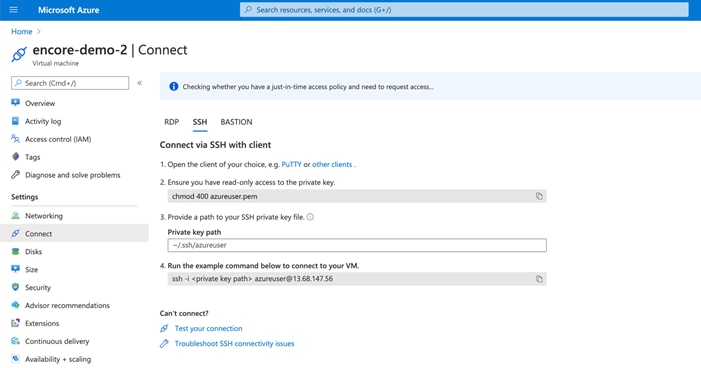
ssh -I <private key path> azureuser@<public ip>
3.1.5 Running eNcore CLI on Windows
Warning: Windows is not yet supported for production execution. If, however, you wish to attempt an installation for the CLI version, then you will need to run the following commands: pip install pyOpenSSL, pip install win-inet-pton.
3.2 Installing eStreamer eNcore CLI
3.2.1 Build the eNcore Client from Source
Use the following command to copy the latest version to your target client:
git clone https://github.com/CiscoSecurity/fp-05-firepower-cef-connector-arcsight
For prior versions: https://github.com/CiscoSecurity/fp-05-microsoft-sentinel-connector/releases
3.2.2 Create PKCS12 File
The eStreamer server must be able to authenticate and authorize client connections. This requires a PKCS12 file on the eStreamer server that identifies the eStreamer client, and this file must be copied to the eNcore server.
See Appendix for instructions on how to create a PKCS12 file in the Firepower Management Center and download it.
3.2.3 Install PKCS12 File
Use the following command to securely copy the PKCS12 file to the eNcore CLI installation:
scp -i /path/to/pem/encore-demo-2_key.pem /local/path/<public ip>.pkcs12 azureuser@<Public Ip>:/tmp/
Copy the certificate from /tmp to the runtime path of the Git project:
cp /tmp/client.pkcs12 ~/fp-05-microsoft-sentinel-connector
3.2.4 Test
1 Change the working directory to eStreamer-eNcore using the following command:
cd ~/fp-05-microsoft-sentinel-connector
2 Run the encore.sh shell script – you will be guided through any additional configuration:
./encore.sh test
The script will verify that you have the pre-requisites installed, notably:
· Python 2.7, Python 3.6+ requires “python3” branch from Git
· The correct build of Python
· pyOpenSSL
· A client.pkcs12 file
· A valid host
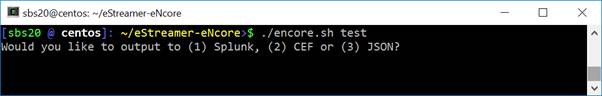
3 Choose whether to output data for Splunk, CEFt, or JSON. In this guide, we use the CEF outputter, however, future versions may use JSON or other custom formats on depending on the Sentinel Connector being used.
Figure 1. Choosing your output
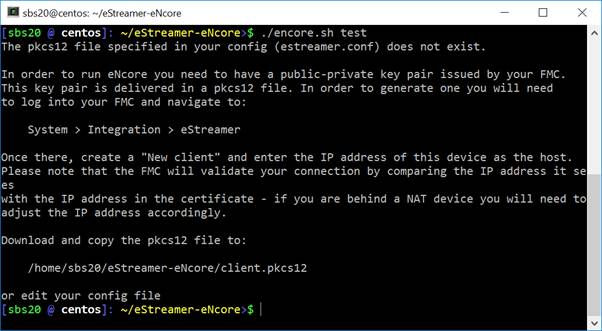
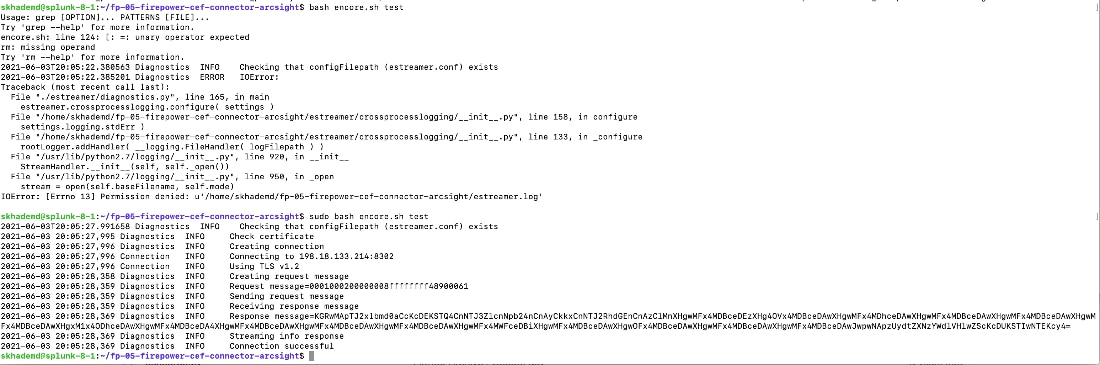
If there are any missing items, you will receive with an explanation. An example explanation is in the following figure:
Figure 2: Missing pkcs12 File
4 Enter the IP / FQDN of the Firepower Management Center and the PKCS12 file password.
Figure 3: Enter Password
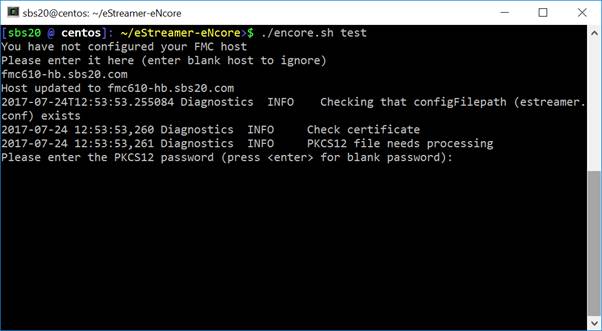
Figure 4: Successful Test
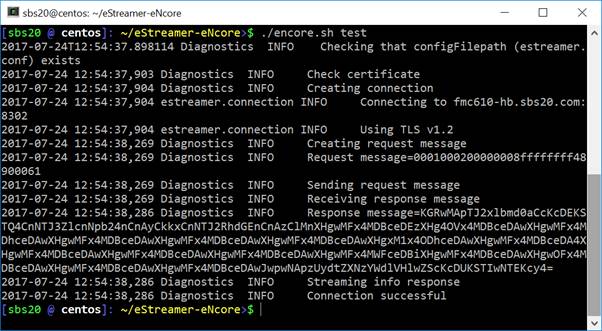
If the test is successful, installation of eNcore CLI is complete.
3.2.5 Running eNcore CLI
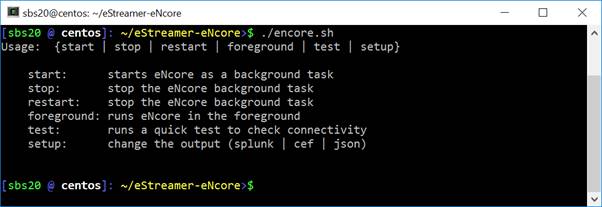
If you run encore.sh without any parameters, you will be presented with brief instructions.
Figure 5: Help Screen
For your first run, run it in the foreground so you can see what is happening. Every two minutes, the screen will update with a note of how many records have been processed. If you wish to change the update frequency, see the monitor.period configuration setting.
Figure 6: Running in the Foreground with Monitor Status
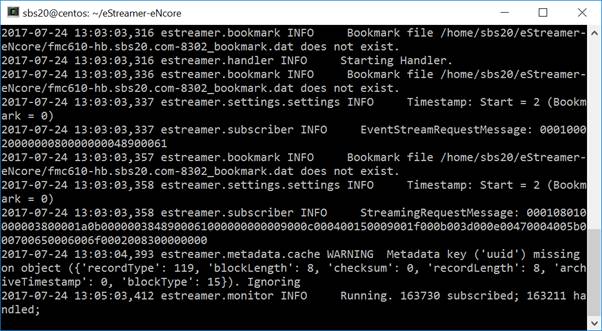
Note: To stop the foreground process, enter Ctrl+C.
3.3 eStreamer eNcore CLI Configuration
The eNcore CLI installation process covered in Section 2.2 requires configuration of basic items, such as the Firepower Management Center IP address, to establish a connection to the Firepower Management Center eStreamer server. This section covers general configuration of the application so that it will fulfill the solution requirements.
The configuration is stored in the estreamer.conf file in the eStreamer-eNcore directory. Initially, it contains default settings which can be changed as needed. The file is in JSON format and contains keys that provide the configuration information. This section details the keys and sections that are most likely to be changed.
The default configuration file is set up to run out of the box. Following is a brief explanation of each setting that you can customize.
3.3.1 Subscription Server
This is the Firepower Management Center host and associated information. If you encounter TLS difficulties and are willing to downgrade, then you can change tlsVersion to 1.0.
Note: Downgrading the TLS version is useful for debugging and seeing the software work, but it is not a recommended long-term strategy. It is recommended instead to fix the root cause.
The subscription key contains two major subsections:
· The records section allows the user to select which types of events eNcore will request upon connecting to the Firepower Management Center eStreamer server.
· The servers section contains the Firepower Management Center host IP and associated information.
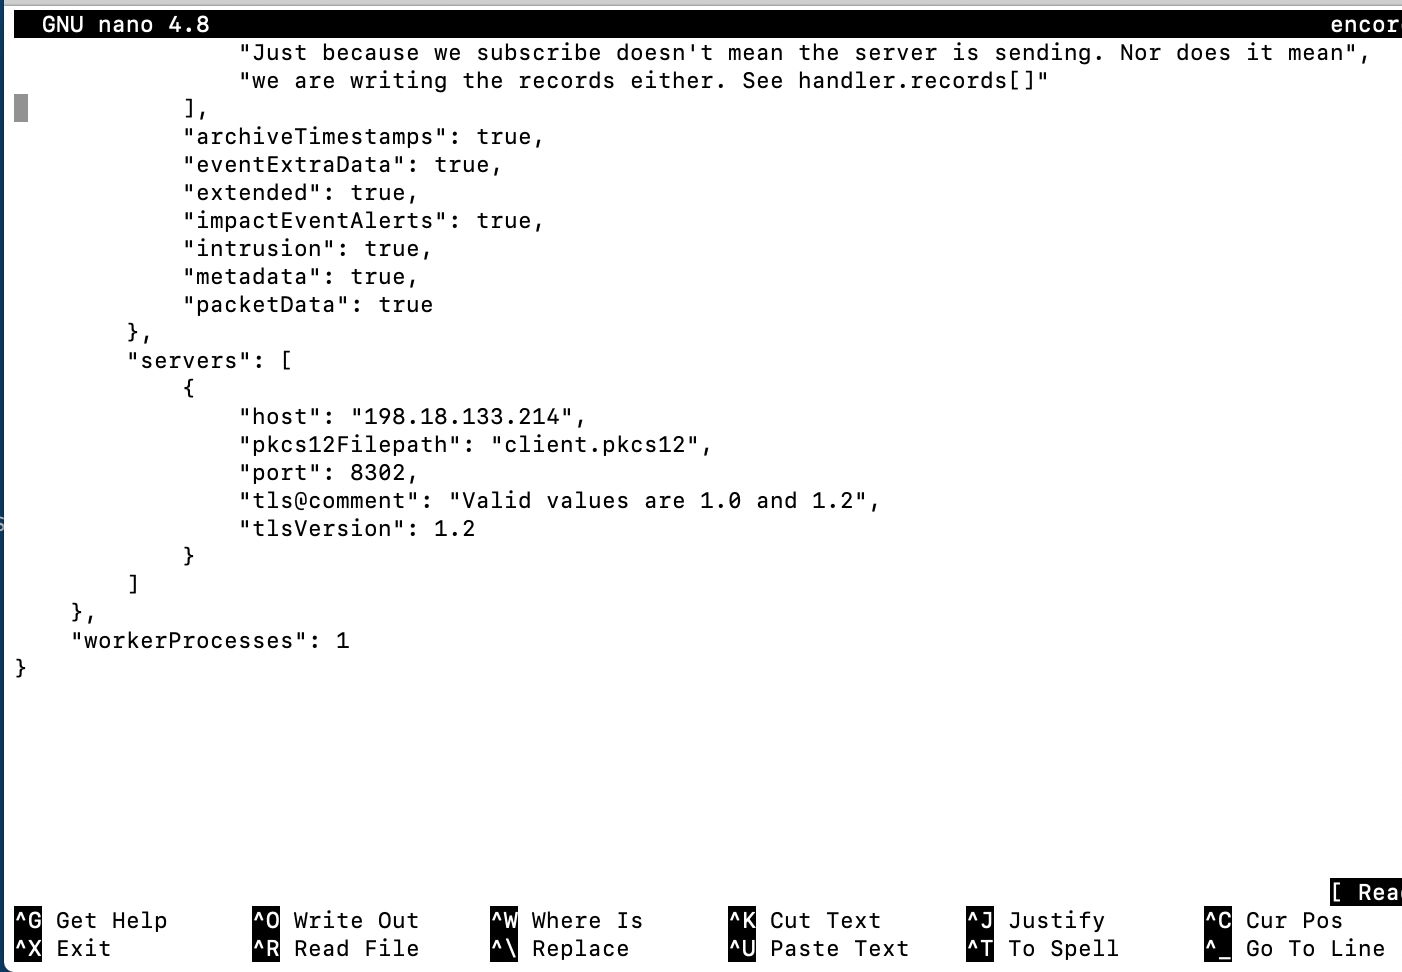
An example of this key and its value is shown below:
Figure 8: Subscription Server Screen
"subscription": {
"records": {
"@comment": [
"Just because we subscribe doesn't mean the server is sending. Nor does it mean",
"we are writing the records either. See handler.records[]"
],
"archiveTimestamps": true,
"eventExtraData": true,
"extended": true,
"impactEventAlerts": true,
"intrusion": true,
"metadata": true,
"packetData": true
},
"servers": [
{
"host": "1.2.3.4",
"port": 8302,
"pkcs12Filepath": "client.pkcs12",
"@comment": "Valid values are 1.0 and 1.2",
"tlsVersion": 1.2
}
], …
3.3.2 Outputters
The Outputters section specifies how eNcore will write the events to output. eNcore CLI can provide output in one of these formats:
· Splunk
· JSON
· CEF for Arcsight
The output can be sent to a SIEM or another collector over a network connection or written to a file.
The examples below show:
· The ArcSight CEF outputter that is configured to send output to an ArcSight connector over UDP.
· The ArcSight CEF outputter that will write the same events to a local file. The {0} notation in the URI specifies that a UNIX timestamp should be placed in the filename.
"outputters": [
{
"name": "CEF",
"adapter": "cef",
"enabled": true,
"stream": {
"uri": "udp://10.0.1.2:514",
}
},
{
"name": "CEFfile",
"adapter": "cef",
"enabled": true,
"stream": {
"uri": "relfile:///data/data.{0}.cef",
"options": {
"rotate": false,
"maxLogs": 9999
}
}
}
]
3.3.3 Records
The Records section specifies which records eNcore will process. There are two modes in which events are identified for handling (or for exclusion from handling).
1. The user can specify that a class of events, such as connections, should be processed by setting that class's value to true. An example of this is the key-value pair "connections": true. Conversely, the user can also specify that a class of events should not be processed by setting that class's value to false.
2. The user can specify exceptions to the handling of classes of events on a per-record-type basis by writing the record type as a value for the include or exclude keys. Multiple values should be comma-separated in the JSON array. As an example, to exclude record types 98 and 170, the exclude key-value pair would read:
"exclude": [98, 170],
An example of the records key-value pair is shown below:
Note: Note that for classes of records to be handled, they must first be selected in the Firepower Management Center eStreamer configuration. They must also be configured for subscription in the records portion of the subscription section of the eNcore configuration.
"records": {
"connections": true,
"core": true,
"excl@comment": [
"These records will be excluded regardless of above (overrides 'include')",
"e.g. to exclude flow and IPS events use [ 71, 400 ]"
],
"exclude": [],
"inc@comment": "These records will be included regardless of above",
"include": [],
"intrusion": true,
"metadata": false,
"packets": true,
"rna": true,
"rua": true
}
3.3.4 Enabled
The value of the enabled key must be set to true for eNcore to request events from the Firepower Management Center and to begin streaming operations. An example of this key is:
"enabled": true,
3.3.5 Execution
Once you have fully configured all items as described, you can use eNcore CLI to stream and write events.
Various shell scripts options are available.
During installation and initial setup – or perhaps for debugging purposes, it is useful to run the following commands:
./encore.sh test
And
./encore.sh foreground
In all other cases, it is expected that eNcore will be run in the background, for which the following commands are pertinent.
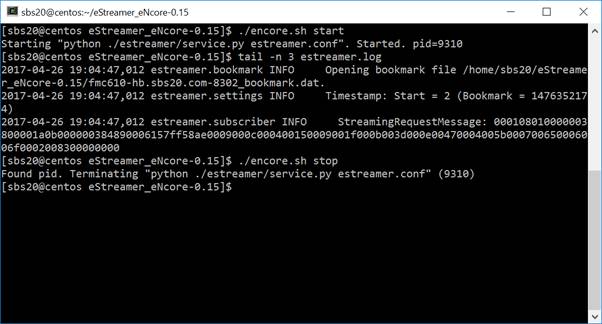
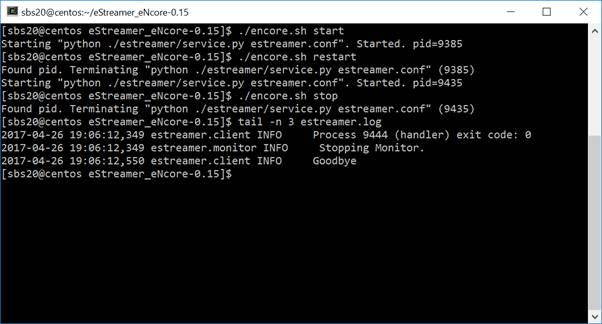
./encore.sh start
./encore.sh stop
./encore.sh restart
Figure 12: Start, Tail Log, Stop
3.3.6 Logging
By default, eNcore will output an estreamer.log application to log in its working directory with a log level of INFO. The format of the log file can be adjusted using the logging.format configuration setting. The level can also be adjusted. It is recommended that the default settings are left in place for production execution.
4 Cisco eStreamer eNcore for Sentinel
4.1 Sending Data to Sentinel
4.1.1 Configuring Encore to Stream UDP
Configure encore to stream CEF data using UDP on port 25226. If encore is already in process, use the encore.sh stop/start command to restart encore.
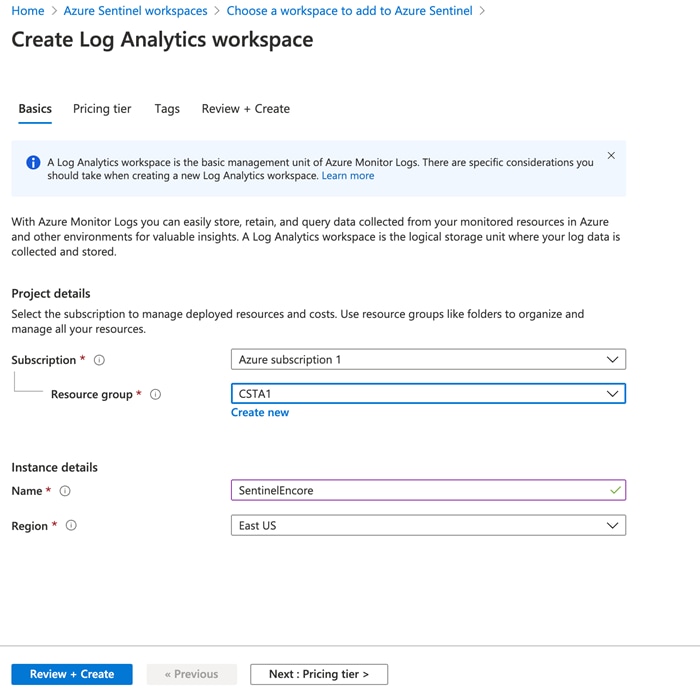
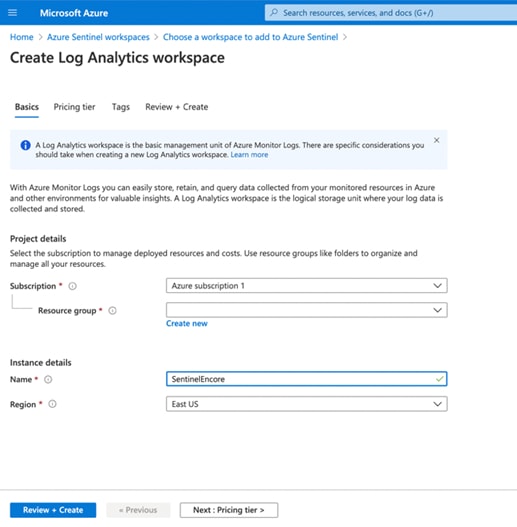
4.1.2 Creating a Sentinel Workspace
Once you’ve established a working eNcore connection between the Firepower Management Center and your Azure instance, you can route your data outputs to Sentinel using an agent collector.
If you don’t have a Sentinel Workspace proceed with the following:
4.1.3 Setting up the CEF Data Connector
Once you’ve established a working eNcore connection between the Firepower Management Center and your Azure instance, you can route your data outputs to Sentinel using an agent collector. Please refer the official Microsoft guide (https://docs.microsoft.com/en-us/azure/sentinel/connect-cef-agent?tabs=rsyslog).

Accessing the connector documentation guide directly from Sentinel is preferred as the docs and prepopulated commands will contain workspace and primary key information specific to your Azure instance.
The following steps below are directly from the Azure Sentinel setup guide for reference.
Note: It is better to use direct documentation with the Sentinel platform because it contains the exact command and workspace/primary ids that will need to be run when installing the agent collector.
Run the deployment script:
1. From the Azure Sentinel navigation menu, click Data connectors.
2. From the list of connectors, click the Common Event Format (CEF) tile, and then the Open connector page button on the lower right.
3. Under 1.2 Install the CEF collector on the Linux machine, copy the link provided under Run the following script to install and apply the CEF collector, or from the text below:
sudo wget https://raw.githubusercontent.com/Azure/Azure-Sentinel/master/DataConnectors/CEF/cef_installer.py&&sudo python cef_installer.py [WorkspaceID] [Workspace Primary Key]
4. While the script is running, check to make sure you don't get any error or warning messages.
Note: Use the same machine to forward both plain Syslog and CEF messages.
If you plan to use this log forwarder machine to forward Syslog messages as well as CEF, then to avoid the duplication of events to the Syslog and CommonSecurityLog tables, you need do the following:
· On each source machine that sends logs to the forwarder in CEF format, edit the Syslog configuration file to remove the facilities that are being used to send CEF messages. This way, the facilities that are sent in CEF won't also be sent in Syslog. See Configure Syslog on Linux agent for detailed instructions on how to do this.
· Run the following command on those machines to disable the synchronization of the agent with the Syslog configuration in Azure Sentinel. This ensures that the configuration change you made in the previous step does not get overwritten.
sudo su omsagent -c 'python /opt/microsoft/omsconfig/Scripts/OMS_MetaConfigHelper.py --disable'
https://docs.microsoft.com/en-us/azure/sentinel/connect-cef-agent?tabs=rsyslog
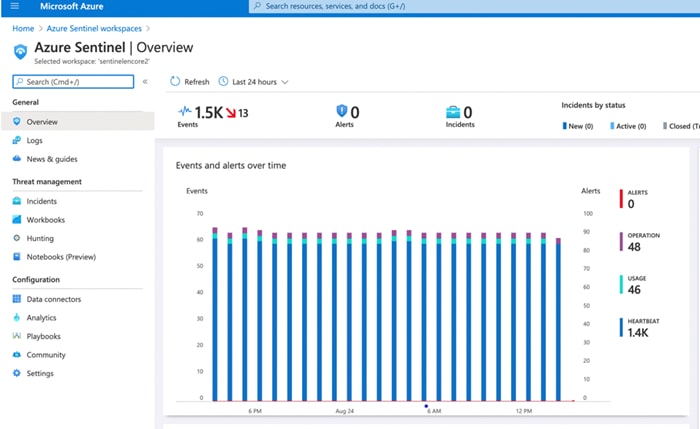
After running the validation script, you should be able to see data coming into the Azure Sentinel Analytics screen.
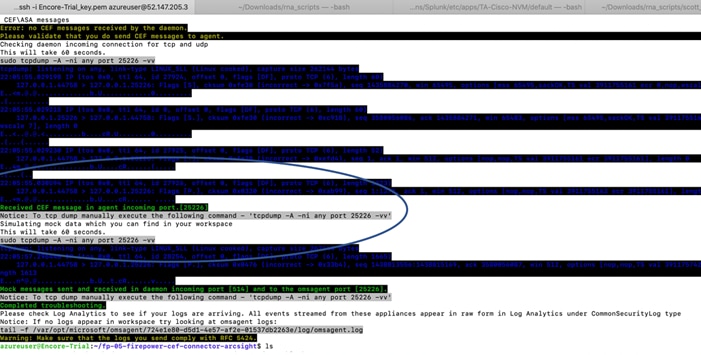
Note: Seeing the Messaging Received CEF message in agent (incoming port 25226) is an indicator that the validation and configuration of the agent was successful.
5 Cisco eStreamer eNcore Add-on for Splunk 8.1+ (TA-eStreamer)
Cisco eStreamer eNcore add-on for Splunk (TA-eStreamer)
The eStreamer eNcore add-on for Splunk is a technology add-on that contains the core eNcore eStreamer client code as well as:
· Data inputs (inputs.conf) for data, logs, and status
· Parsing hints (props.conf)
· An extension which allows eNcore to live and die with Splunk
Note: The eNcore for Splunk add-on is not supported on Splunk for Windows.
Cisco eStreamer eNcore Dashboard for Splunk (eStreamer Dashboard)
This is an application which includes the same user interface elements as the old Cisco eStreamer for Splunk app (https://splunkbase.splunk.com/app/1629/). The application contains no code or collector elements, however. It is simply a UI application with some pre-defined searches, macros, event types, and workflow actions.
5.1 Prerequisites
The eNcore add-on for Splunk and the eNcore Dashboard for Splunk do not require any special prerequisites. They are downloadable from Splunkbase and are installed in the search head in the same way as other add-ons and applications.
The eNcore add-on for Splunk requires Python 3.6+ and openSSL, in the latest Splunk 8.1 release Python3 is included, however the Python mods for openSSL are not included, which require additional configuration steps outlined in this update. If the Splunk install has been customized and is missing one or both components, they will need to be installed for the add-on to function.
5.2 Installation
Note: The eNcore for Splunk add-on is not supported on Splunk for Windows.
5.2.1 Installing the eNcore Add-on for Splunk (TA-eStreamer)
To install the eNcore add-on for Splunk, do one of the following:
· Download the add-on from http://apps.splunk.com/app/3662, and use the “Install app from file” feature in Splunk to upload and install the add-on.
· Use the “Browse more apps” feature in Splunk and search for eNcore, then look for Cisco eStreamer add-on for Splunk in the search results and click Install for that add-on.
You must install a PKCS12 certificate for your Splunk server, which allows the Firepower Management Center to authenticate the identity of the add-on when the eNcore client contacts the Firepower Management Center and establishes a secure tunnel:
· Create the PKCS12 certificate on the Firepower Management Center.
· Download the certificate.
· Copy the certificate to these two (2) location(s) on the Splunk server (renaming it to client.pkcs12):
$SPLUNK_HOME/etc/apps/TA-eStreamer/bin/encore/client.pkcs12
$SPLUNK_HOME/etc/apps/TA-eStreamer/bin/client.pkcs12
For more information on creating a PKCS12 certificate and copying it to the Splunk server, see Appendix.
5.2.2 Installing the eNcore Dashboard for Splunk (eStreamer Dashboard)
To install the eNcore Dashboard for Splunk, do one of the following:
· Download the app from http://apps.splunk.com/app/3663, and use the "Install app from file" feature in Splunk to upload and install the add-on.
· Use the "Browse more apps" feature in Splunk and search for “eNcore”, then look for Cisco Firepower eNcore App for Splunk in the search results, and click Install for that app.
5.3 eNcore Add-on for Splunk Setup Configuration
5.3.1 Enable Data Inputs
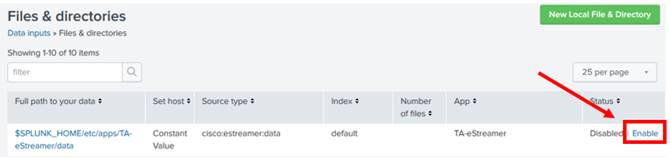
The eNcore add-on for Splunk writes events to log files in the installation's data directory. Splunk must be configured with a Data Input that reads the events from this directory.
To do this, go to Settings > Data Inputs > Files & Directories, and enable the data input with the following path: $SPLUNK_HOME/etc/apps/TA-eStreamer/data and Source type cisco:estreamer:data.
5.3.2 Enable Scripts
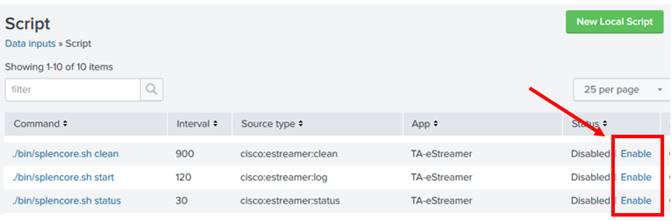
The eNcore add-on for Splunk has three scripts that perform important operations:
· cisco:estreamer:clean – has no output but is used to delete data files older than 12 hours.
· cisco:estreamer:log – uses the stdout of eNcore to take program log data. This becomes very useful where things are not going to plan. More importantly, it is the script which starts the eStreamer eNcore process.
· cisco:estreamer:status–runs periodically to maintain a clear status of whether the program is running.
To enable the scripts, go to Settings > Data Inputs > Scripts, and click Enable for the three TA-eStreamer scripts.
5.3.3 eNcore Add-on Setup Configuration
Go to the TA-eStreamer bin directory, located in $SPLUNK_HOME/etc/apps/TA-eStreamer/bin, where $SPLUNK_HOME represents the home directory of your Splunk Heavy Forwarder installation.
To set the homepath (SPLUNK_HOME) of your SPLUNK_HOME install variable, execute the following command:
export SPLUNK_HOME=/opt/splunk
Where /opt/splunk is the home location of your Splunk install if this is different change accordingly.
You will then likely see the following error if you run the startup/test script:
**/opt/splunk/bin/openssl: error while loading shared libraries: libssl.so.1.0.0: cannot open shared object file: No such file or directory**
To resolve this, add one additional setup variable for the Splunk Lib path, it is commented out in the script, you will need to run the following command prior to executing the setup script:
export LD_LIBRARY_PATH=$SPLUNK_HOME/lib
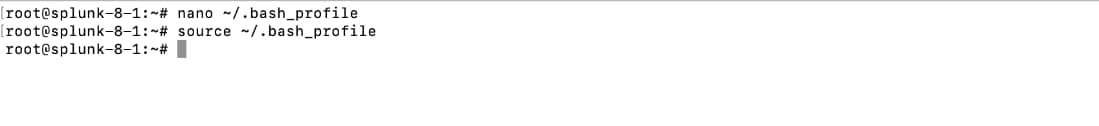
Setting the SPLUNK_HOME and LD_LIBRARY_PATH is contained to the local terminal session, to persist these values perform the following: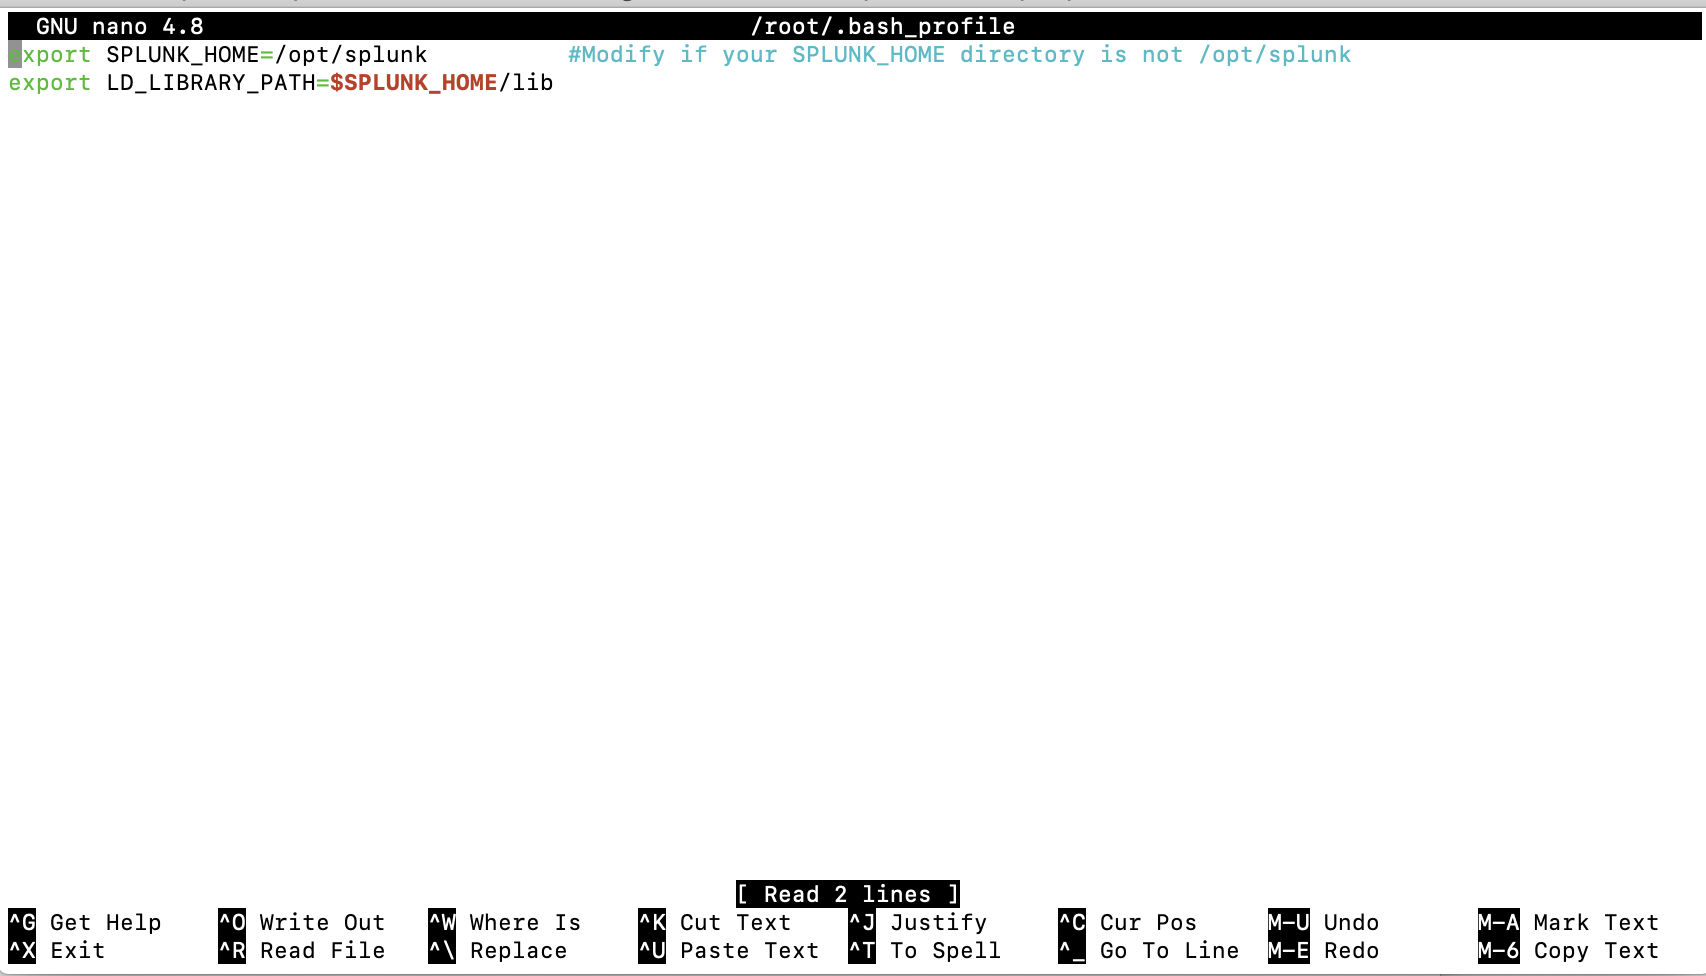
On Ubuntu:
1 Edit the ~/.bash_profile file.
2 Add the export variables from above as follows:
§ export SPLUNK_HOME = /opt/splunk
§ export LD_LIBRARY_PATH=SPLUNK_HOME/lib
3 Save the file, then run source ~/.bash_profile.
On CentOS:
1 The bash profile is likely uses a different alias, try ~./profile or ~/.bashrc.
2 Edit the file, save and run this source command above
https://community.splunk.com/t5/Developing-for-Splunk-Enterprise/How-to-get-Splunk-Python-on-CentOS-to-use-SSL-Crypto/m-p/310051.
Modify the estreamer.conf file to point to your Firepower Management Center server host IP address
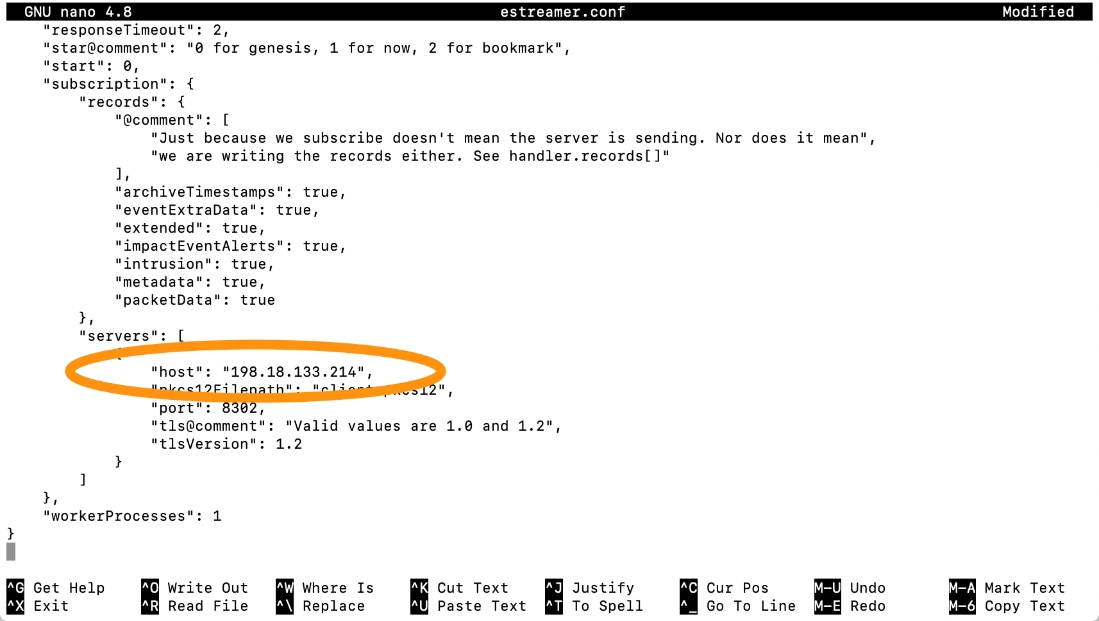
3 Edit the settings: false, change it to true.
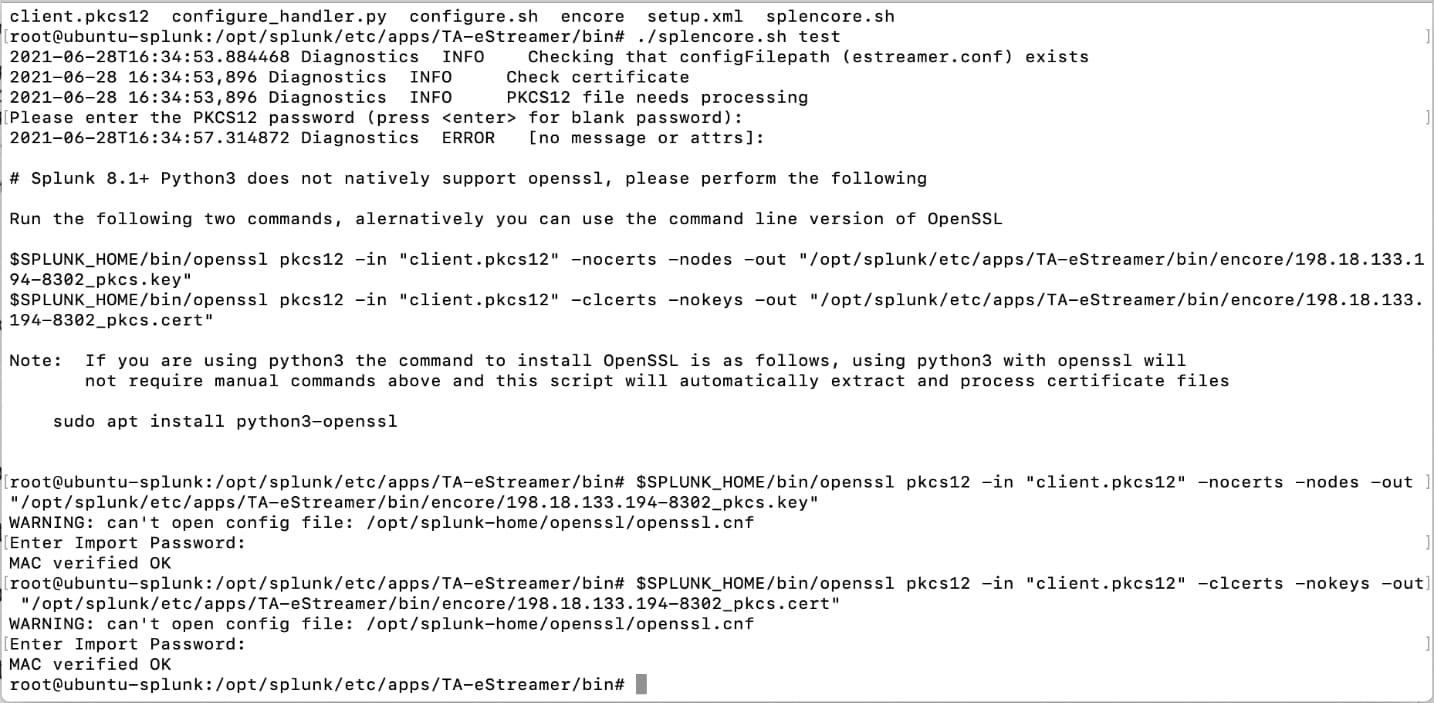
4 Run the ./splencore.sh test command.
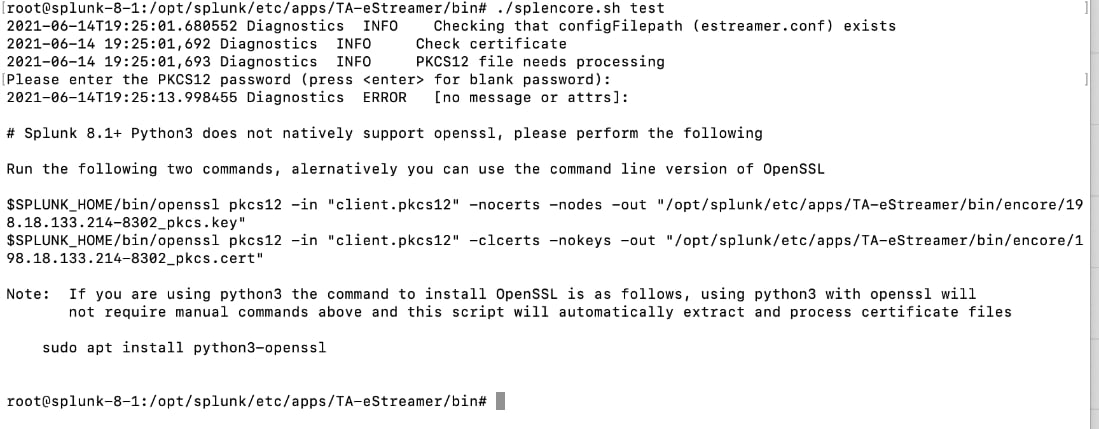
5 Enter the password for the client.pkcs certificate, it will fail initially and prompt you to enter in the following commands:
Command #1:
$SPLUNK_HOME/bin/openssl pkcs12 -in "client.pkcs12" -nocerts -nodes -out "/opt/splunk/etc/apps/TA-eStreamer/bin/encore/198.18.133.214-8302_pkcs.key"
Command #2:
$SPLUNK_HOME/bin/openssl pkcs12 -in "client.pkcs12" -clcerts -nokeys -out "/opt/splunk/etc/apps/TA-eStreamer/bin/encore/198.18.133.214-8302_pkcs.cert"
Note: Substitute 19.18.133.214 with your Firepower Management Center Server host IP address.
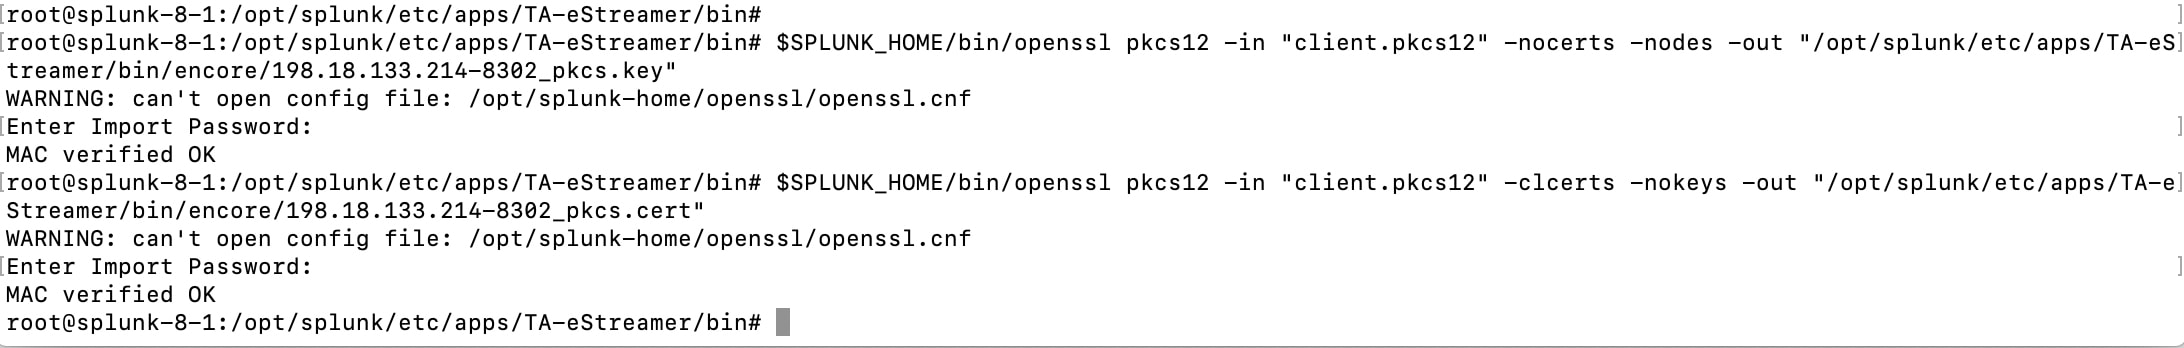
6 Enter the Firepower Management Center client.pkcs certificate password after each prompt, if successful you will see the text "MAC verified OK" after each command.
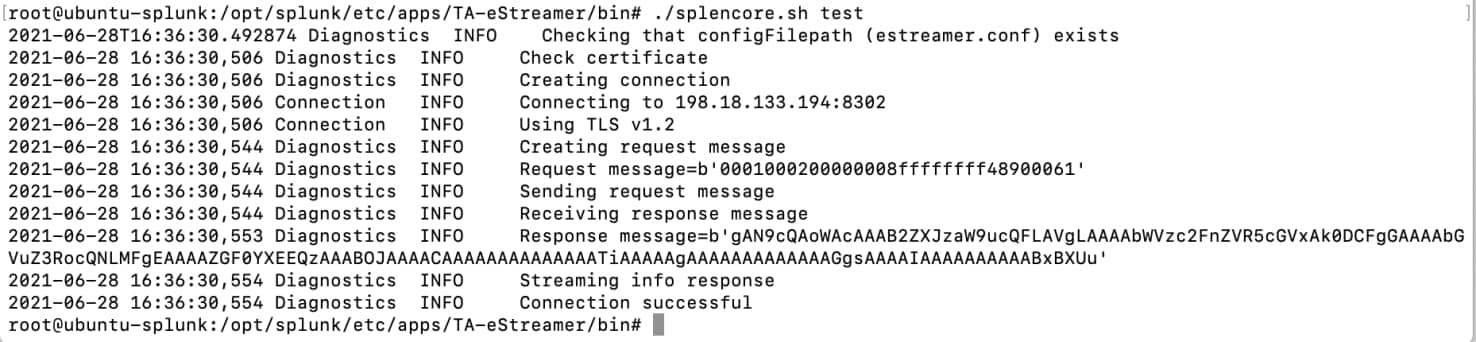
7 Run the ./splencore.sh test command, you should see the following:
5.4 Operation
Once you have fully configured all items as described in section 4, the eNcore add-on for Splunk is started by checking the Is enabled check box on the add-on setup page and clicking Save as described in section 4.3.
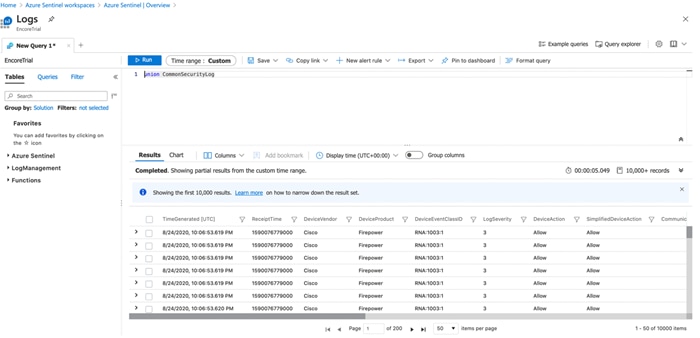
Following execution, the operation of the add-on can be monitored by searching for status, log, and data events:
· To check the status, search for sourcetype="cisco:estreamer:status".
· To check more detailed log output, search for sourcetype="cisco:estreamer:log".
· To look for eStreamer data, search for sourcetype=" cisco:estreamer:data".
For further analysis of the Firepower events consider installing Cisco Firepower App for Splunk.
6 Firepower Dashboard for Splunk
6.1 Inbound/Outbound Subnet Configuration
There is a default configuration provided by the eNcore for each platform in the estreamer.conf file that provides an optimal configuration for many deployments. However, some options that may need to be adjusted by the user in certain circumstances. This section provides details regarding several of these options.
6.2 Records
The records section specifies which records eNcore will process. There are two modes in which events are identified for handling (or for exclusion from handling):
· The user can specify that a class of events, such as connections, should be processed by setting that class's value to true.
An example of this is the key-value pair "connections": true. Conversely, the user can also specify that a class of events should not be processed by setting that class's value to false.
· The user can specify exceptions to the handling of classes of events on a per-record-type basis by writing the record type as a value for the include or exclude keys. Multiple values should be comma-separated in the JSON array.
As an example, to exclude record types 98 and 170, the exclude key-value pair would read:
"exclude": [98, 170],
An example of the records key-value pair is shown below:
Note: Note that for classes of records to be handled, they must first be selected in the Firepower Management Center eStreamer configuration. They must also be configured for subscription in the records portion of the subscription section of the eNcore configuration.
"records": {
"connections": true,
"core": true,
"excl@comment": [
"These records will be excluded regardless of above (overrides 'include')",
"e.g. to exclude flow and IPS events use [ 71, 400 ]"
],
"exclude": [],
"inc@comment": "These records will be included regardless of above",
"include": [],
"intrusion": true,
"metadata": false,
"packets": true,
"rna": true,
"rua": true
}
6.3 Monitor
The monitor is a separate thread that runs monitoring and maintenance tasks. By default, it runs every two minutes. It writes the number of events handled to the eNcore log and checks the status of subprocesses. If there are any problems with subprocesses, the monitor places the client into an error state and the client shuts itself down.
An example of messages written to the log by the monitor thread is shown below:

Several aspects of the log messages can be configured in the monitor section of the estreamer.conf configuration file, which is located in:
Splunk: $SPLUNK_HOME/etc/apps/TA-eStreamer/bin/encore/estreamer.conf
Sentinel/CEF: / fp-05-firepower-cef-connector-arcsight/estreamer.conf
The aspects that can be configured are:
· period: The interval in seconds at which the monitor performs its check of subprocesses and writes status messages to the log.
· bookmark: If true, the bookmark (the time of the latest event in Unix time format) is included in each monitor log message.
· handled: If true, the number of events that eNcore has handled since being started.
· details: If true, then in addition to the brief status message that the monitor writes to the log, it will also write a detailed message containing many status items related to the operation of the eNcore client.
An example of the configuration of these parameters in the estreamer.conf file:
"monitor": {
"period": 120,
"bookmark": false,
"handled": true,
"details": true
},
6.4 Start Time
The eStreamer server expects the client request to state the start time, which specifies that the Firepower Management Center should only send events that occurred after the start time. There are three options:
· 0: Send all events from the earliest point available on the Firepower Management Center.
· 1: Send all events that occur after receiving the client request.
· 2: Use a bookmark to pick up where we left off. First run is from 0.
An example of the start configuration in the estreamer.conf file is shown here:
"@startComment": "0 for genesis, 1 for now, 2 for bookmark",
"start": 2,
6.5 Outputters
By default, only the Splunk outputter is enabled. It writes its data to a relative file location, but you may want to output the data to a different location. To change it, alter the stream.uri property to file:///absolute/file/path/filename{0}.ext where {0} is the timestamp placeholder.
An example of the outputters configuration in the estreamer.conf file:
"outputters": [
{
"name": "Splunk default",
"adapter": "splunk",
"enabled": true,
"stream": {
"uri": "relfile:///data/splunk/encore.log{0}",
"options": {
"rotate": true,
"maxLogs": 9999
}
}
},
"outputters": [
{
"name": "Arcsight",
"adapter": "cef",
"enabled": true,
"stream": {
"uri": "relfile:///data/cef/encore{0}.cef",
"options": {
"rotate": true,
"maxLogs": 9999
}
}
},
6.6 Performance Tuning
The performance of the eNcore for Splunk add-on has been improved in version 4.x with the addition of multi-processing. By default, four worker processes operate on the incoming messages to achieve higher throughput.
While multiple processes can provide significant performance gains, these gains are highly dependent on the platform because for each platform, the processing bottlenecks may be different. Multiple processes also require additional overhead for managing task distribution, so that increasing the number of processes could, actually, decrease the performance on platforms with a low number of CPU cores.
The number of worker processes is configurable through the workerProcesses parameter in the estreamer.conf file. The number can be set from 1 to 12. Generally, the more capable the platform (i.e., more CPU cores, better I/O, etc.), the more throughput is achieved through a higher number of worker processes. However, the only reliable approach is to test performance with various settings, such as 1, 2, 4, 8, and 12, and in many cases the best performance may be gained with just one worker process because no process marshalling is required.
One scenario for testing is to:
1. Disable the add-on's Data Input in Splunk because the same events will be requested multiple times during the testing.
2. Configure a set number of workerProcesses (such as 8), and then start eNcore with a start parameter of 0 (for genesis) or at least an old start time.
3. Request connection events from the Firepower Management Center (or in some other way request the Firepower Management Center send millions of backlogged events).
4. Observe the event rate reported by the monitor process in the estreamer.log file.
5. Repeat the test with a different number of workerProcesses.
6. When the optimal number has been determined, set the workerProcesses to that number and enable the add-on's Data Input to resume production operations.
An example of the workerProcesses configuration in the estreamer.conf file:
| Event Rate (per second) |
Worker Threads |
Batch Size (recommended) |
| Less than <100 |
1 |
2 |
| 100 – 2000 |
1 |
100 (default) |
| 2000-4000 |
4 |
100 (default) |
| 4000-6000 |
8 |
250 |
| 8000+ |
12 |
500 |
A typical Splunk heavy forward can handle on average 4000-5000 events per second, however, this rate is subject to the available resources on the operating system, additional background tasks, or other TA’s (Technical Add-On's) may result in lower performance rate.,
If using a dedicated VM, the specs will largely depend on how much volume you wish to process. A typical installation handling roughly 4000 events per second should be installed on an 8 Core @ 3.6 GHz CPU, 32 GB RAM machine or (a c5.2x large ec2 instance). For light weight clients only processing a handful events per day (<100 events), eNore has been tested and known to work with a minimal spec of 4 cores, and 1GB RAM.
6.7 Batch Size
The eNcore for Splunk add-on also attempts to improve performance by batching received events and only writing them to output when the threshold for the batch has been reached. The default batch size is 100 events.
If the event rate is very low, then a batch size of 100 events could cause an unwanted delay in the appearance of events in Splunk.
For example, if intrusion events are the only events that are handled and the intrusion event rate averages 100 events per hour, then the first event in a batch will often be delayed an hour or more while the batch completes and is written to disk. To reduce such delays, the batchSize can be set to a lower value, or to eliminate them entirely, the batchSize can be set to 1.
The disadvantage of setting batchSize to 1 is that in high-throughput environments the overall event rate will be lower. Additionally, file locking and rotation could be problematic as events are constantly written to disk, so it highly recommended that the minimum batchSize be set to 2.
An example of the batchSize configuration in the estreamer.conf file:
"batchSize": 50
For high volume configurations, you can set the batchSize as high as 500 to achieve optimal performance. Again, a higher batchSize reduces the frequency in which the client writes to disk, less File I/O means additional compute at a cost of a slight delay to processing events.
6.8 Persisting a connection
It can be advantageous to persist the client indefinitely to listen for a stream of data from the Firepower Management Center, or have eNcore automatically restart after a Splunk outage, this can be achieved by setting the following configuration value to true:
"alwaysAttemptToContinue": true
6.9 Host
By default, a generic place holder is defined within the estreamer.conf file, you will want to change this to the IP or HOST name of your Firepower Management Center. As of this writing, only IPv4 addresses are supported.
“host”: “1.2.3.4”
6.10 Advanced Configuration Settings
The table describes the key definitions for the estreamer.conf file.
| Key |
Definition |
| alwaysAttemptToContinue |
true | false. Controls whether the eNcore client will persist a connection even if the CLI process has been terminated. |
| batchSize |
The number of events that will be stored in memory before being written to disk. The default is 100, adjust this lower for low volume traffic as events will be queued in memory until this threshold is met. Adjust higher for high volume implementations, this will limit the number of file I/O access request and increase your clients’ performance, but events may be delayed. The delay factor is relative to your ingest rate. For example, if your ingest rate is 100 events/sec and your batchSize is 500, then every 5 seconds your data will be written to disk. |
| enabled |
true | false. Controls whether eNcore will run. |
| connectTimeout |
The duration in seconds the client will wait for a connection to establish before failing. |
| responseTimeout |
The duration in seconds the client will wait for a response before timing out. |
| monitor.period |
The period in seconds between each execution of monitor tasks. Default is 120. Lower numbers are useful for debugging but will create more log traffic. |
| monitor.velocity |
true | false. True will display the speed at which the client is processing records. A positive value means the client is processing events faster than eStreamer is sending them. Negative is slower. Once up to date, this should hover around zero. |
| monitor.bookmark |
true | false. True will show the last bookmark timestamp. This is useful to see how far behind the eNcore client is. |
| monitor.subscribed |
true | false. True will report the total number of events subscribed. |
| monitor.handled |
true | false. True will report the total number of events written to output. |
| Start |
0 specifies the oldest data available. 1 specifies data as of now. 2 specifies use of bookmark. |
| logging.level |
Levels include FATAL, ERROR, WARNING, INFO, DEBUG, VERBOSE, and TRACE. Select the level of logging as per your requirement. It is strongly recommended that you do not use anything above INFO for production environments. DEBUG will generate very large log files and TRACE will significantly affect performance. |
| logging.format |
This describes the format of the log and how they are stored. Default configuration setting for message format is “{date-time}{name of module}-{level of logging-message}”. |
| logging.stdOut |
true | false. This determines whether log output is also shown in Standard Output. |
| logging.filepath |
This specifies the location of the application log. |
| maxQueueSize |
Maximum number of messages buffered before throttling takes place. It is essentially a buffer size. The larger this number, the longer it will take to shut down. Default configuration setting is 100. Do not change it. |
| subscription.servers[] |
While this is an array, eNcore can only currently support one server. The array is to support the future ability to connect to multiple hosts. |
| server.host |
The IP address of the Firepower Management Center (eStreamer Server). Default configuration is 1.2.3.4. If you change the host entry after having run eNcore, then new cache, bookmark, and metadata files will be generated. |
| server.port |
The server port to connect to. Default is 8302. |
| server.pkcs12Filepath |
The PKCS12 filepath location. If you change this having already run eNcore, then you must also delete the cached public and private key; otherwise, eNcore will continue to use those. They are called {host}-{port}_pkcs.cert and {host}-{port}_pkcs.key. |
| server.tlsVersion |
Valid options are 1.0 and 1.2. |
| subscription.records |
Do not change these values. |
| handler.records.metadata |
true | false. If you wish to exclude the output of metadata (since it has no timestamp information), then set this value to false. |
| handler.records.flows |
true | false. If you wish to exclude connection flow records, then set this value to false. |
| handler.outputters[] |
An array of outputter controllers which define the behavior and format of what gets written by eNcore. |
| outputter.name |
This is a human readable name for your convenience. It is unused by the code. |
| outputter.adapter |
Data is read from eStreamer and stored in a structured internal format. The adapter transforms the data to a desired format. Recognized values are: · splunk · json |
| outputter.enabled |
true | false. You can have more than one outputter specified at once. If you wish to disable a specific outputter, set this flag to false. If all outputters are false (or there are no outputters), then it behaves as a sink. |
| outputter.passthru |
true | false. If true, then data flowing through bypasses decoding and metadata processing. It is very fast but of limited use. Its primary purpose is for debugging. |
| outputter.stream.uri |
Specify the location where the output will be stored. You can specify a file URI as normal (e.g., file:///absolute/path/to/file) or a relative file path (relfile:////relative/path/to/file). Only file URLs are supported currently. |
| outputter.stream.options |
File-based streams require additional options. |
| option.rotate |
true | false. Set if you want log rotation. Default configuration setting is true. Please note that eNcore will not delete any old files. If you wish to do that, you will need to script it separately and schedule it. Example: Call this from a cron job. #!/bin/bash |
| option.maxLogs |
Specify the size of the log (number of lines). Default configuration is 10,000. You can have fewer, larger files (e.g., 50,000). |
7 Troubleshooting
7.1 Error messages
The eNcore for Splunk add-on is engineered to provide meaningful error messages. Below is an example error message:
The eStreamer service has closed the connection - There are a number of possible causes which may show above in the error log.
If you see no errors, then this could be that:
· The server is shutting down.
· There has been a client authentication failure (please check that your outbound IP address matches that associated with your certificate - note that if your device is subject to NAT then the certificate IP must match the upstream NAT IP).
· There is a problem with the server. If you are running Firepower Management Center v6.0, you may need to install "Sourcefire 3D Defense Center S3 Hotfix AZ 6.1.0.3-1").
If you encounter errors that do not make sense or require further explanation, then please contact support so that we can fix the problem and improve the error messages.
7.2 Common eNcore Problems
Problem: The following information will help you to quickly resolve common problems experienced by customers using the Firepower eNcore for Splunk TA. From dealing with many scores of reported issues the common themes are stability, connectivity, and configuration problems. The list below describes several of these scenarios and offers solutions for quick resolution, however should you still experience problems please do not hesitate to create a TAC support ticket if you encounter issues installing Microsoft Sentinel Agent
Recommendation:
Install the Microsoft agent on Azure, then try reinstalling the OMS
https://support.microsoft.com/en-us/help/4131455/how-to-reinstall-operations-management-suite-oms-agent-for-linux.
Problem: No data is coming into Splunk.
Recommendation:
· Examine the data directory with the Splunk TA located in:
$SPLUNK_HOME/etc/apps/TA-eStreamer/bin/encore/data/splunk (default configuration)
· Search for the records that are missing, a popular method is grep:
cat "encore*" | grep “rec_type=400" (400 for intrusion events)
If no results are displayed, then this could be a certificate issue or you may be filtering out certain event types, examine the estreamer.log for any errors or indication of a disk failure.
Additionally, be sure to examine the inputs.conf file so that the monitor points to the data directory above should look like the following (by default):
# Where data is written to
[monitor://$SPLUNK_HOME/etc/apps/TA-eStreamer/bin/encore/data]
disabled = 0
source = encore
sourcetype = cisco:estreamer:data
crcSalt = <SOURCE>
Problem: Too much data, the clean utility is not sufficient in purging what I need.
Recommendation:
If you use Splunk, you can change the inputs.conf monitor stanza to batch, this will delete files upon ingest:
[monitor://$SPLUNK_HOME/etc/apps/TA-eStreamer/bin/encore/data]
Changes to
# Where data is written to
[batch://$SPLUNK_HOME/etc/apps/TA-eStreamer/bin/encore/data]
disabled = 0
source = encore
sourcetype = cisco:estreamer:data
crcSalt = <SOURCE>
Restart Splunk for the changes to take effect.
On CLI/CEF Arcsight editions, the ./encore.sh clean utility can provide some relief however it is very basic, and a more robust file retention policy should be employed by the operating system, file rotation, crons that purge on a given frequency, or Apache Kafka are alternatives for file/disk management.
Problem: I can’t establish a connection. No data is coming into Splunk.
Recommendation:
There are a few steps to establish a connection:
· Established a client certificate that is accessible by the Firepower Management Center. <Training guide link here>
· Once the certificate is in place, you can run the routine ./splencore.sh test or ./encore.sh test to determine if a connection is enabled. The client is only as good as the network behind it, and, commonly, that generic connection is disabled, or NAT IP error is shown. In these cases, run a ping script from your endpoint to the Firepower Management Center to ensure there is nothing on the network blocking the connection. Remember, port 8042 is open for the eStreamer protocol.
Another issue we see on the data distribution of eNcore is that data is being forwarded to a Load Balancer or across a network using TCP. We highly recommend you save data locally to the client and use a dedicated service to ensure distribution across a network. eNcore can be enabled in "persistent" mode by using the following variable in the estreamer.conf:
“alwaysAttemptContinue”: true
If a load balancer terminates a connection or something restarts eNcore on the network, this mode will automatically kick off a Python process to reinitiate communication.
Problem: I get a bunch of Intrusion Events in a burst and then I don’t see any for hours or days.
Recommendation:
It’s likely that the client is handling a very low volume of events. By default, eNcore will write events to disk or whatever output stream was configured every 100 events by default. It is designed in this way to maximize performance by limiting File I/O operations. This can be tuned in the configuration using the following variable in the estreamer.conf:
“batchSize”: 2.
Setting the batchSize to 2 will result in immediate delivery of events, but it will come at a performance cost, while conversely increasing the batchSize will increase performance but will delay the time which they are written to disk. This may prove useful if the number of events received exceeds 2000+ per second, in that case, a batchSize of 500 could be a better threshold for your implementation.
Additionally, having a high batchSize and worker thread count when only sending a low volume of events can potentially lead to problems as data is queued in memory until the batch threshold is met, which may mean days or even weeks until data is sent to Splunk.
The number of working processes a server can support is determined by the number and speed of processer cores and load on the server.
| Event Rate (per second) |
Worker Threads |
Batch Size (recommended) |
| Less than <100 |
1 |
2 |
| 100 – 2000 |
1 |
100 (default) |
| 2000-4000 |
4 |
100 (default) |
| 4000-6000 |
8 |
250 |
| 8000+ |
12 |
500 |
Q: Should I set my batchSize to 1?
A: This was advocated in prior versions of this document however this can cause some devastating effects.
Setting the batchSize to 1 will immediately write all information from the Firepower Management Center to disk/stream without hesitation, while this may be preferred in some environments it can cause dead locking on the file system when other commands such as clean or monitor are executed which why we recommend setting this value to a minimum of 2 so that in between writing processes other actions on the data store can be taken.
Problem: I see recurring gaps in my event data over time. When I graph it, I get a sawtooth like chart.
Recommendation:
A few key considerations should be made when this is observed on the ingest analytics. Look out if your analytics is showing ingest time or event time. Splunk ingest, especially elsewhere ingesting multiple data sources is based on what is most efficient, Splunk will prioritize ingest according to several factors outside the control of the application.
It’s also possible that some of the events are purged frequently. Examine the data retention policy and ensure that the client is keeping up with the load from the Firepower Management Center. If there is an extended delay, events could be purged before they are ingested by Splunk, and as a result gaps in the time will be present.
Examine the raw data files in the estreamer.conf data directory, search for events within the time ranges that detailed gaps in the analytic, and if the raw data is still present then there could be an issue with Splunk ingest or the analytic could be excluding the data from results.
Problem: I can’t run the ./encore.sh script
Recommendation:
This could be a permissions issue, examine the logged in user vs the permission on the files and directory of the Git download, you can always use sudo to run the test and start scripts if there is a permissions issue.
Screenshot below shows an example of a permissions error when attempting to run a test script on the ./encore.sh script and the effect of modifying how the command is run with elevated permissions:
7.3 Frequently Asked Questions
Can I output my data to a different server?
Yes. Currently eNcore only writes to the filesystem, but you could mount an NFS or SMB share and specify its path as above. This may impact performance.
Can I run more than one instance?
Yes, using the CLI version.
Although currently the encore.sh shell script only supports one instance. The underlying Python program prefixes temporary files (e.g., metadata, certificates, bookmarks) with the host and port. You will also need to update the outputter locations (e.g., [Splunk] … directory = splunk) in order to avoid data collision.
If you wish to run more than one instance, it is recommended to extract additional copies of eStreamer-eNcore and configure separately in order to avoid changing encore.sh.
Can I connect to more than one Firepower Management Center?
Currently not within a single instance. However, you can configure multiple instances as above.
What are the different record types in firepower?
There well over 500+ record types in Firepower, a link to the full guide is below, however a quick reference table is here for your convenience.
| Record Type |
Block Type |
Series |
Description |
Record Status |
Data Format Described in... |
| 2 |
N/A |
N/A |
Packet Data (Version 4.8.0.2+) |
Current |
|
| 4 |
N/A |
N/A |
Priority Metadata |
Current |
|
| 9 |
20 |
1 |
Intrusion Impact Alert |
Legacy |
|
| 9 |
153 |
1 |
Intrusion Impact Alert |
Current |
|
| 62 |
N/A |
N/A |
User Metadata |
Current |
|
| 66 |
N/A |
N/A |
Rule Message Metadata (Version 4.6.1+) |
Current |
|
| 67 |
N/A |
N/A |
Classification Metadata (Version 4.6.1+) |
Current |
|
| 69 |
N/A |
N/A |
Correlation Policy Metadata (Version 4.6.1+) |
Current |
|
| 70 |
N/A |
N/A |
Correlation Rule Metadata (Version 4.6.1+) |
Current |
|
| 104 |
N/A |
N/A |
Intrusion Event (IPv4) Record 4.9 - 4.10.x |
Legacy |
Earlier versions of the product |
| 105 |
N/A |
N/A |
Intrusion Event (IPv6) Record 4.9-4.10.x |
Legacy |
Earlier versions of the product |
| 110 |
4 |
2 |
Intrusion Event Extra Data (Version 4.10.0+) |
Current |
|
| 111 |
5 |
2 |
Intrusion Event Extra Data Metadata (Version 4.10.0+) |
Current |
|
| 112 |
128 |
1 |
Correlation Event for 5.1-5.3.x |
Legacy |
|
| 112 |
156 |
1 |
Correlation Event for 5.4+ |
Current |
|
| 115 |
14 |
2 |
Security Zone Name Metadata |
Current |
|
| 116 |
14 |
2 |
Interface Name Metadata |
Current |
|
| 117 |
14 |
2 |
Access Control Policy Name Metadata |
Current |
|
| 118 |
15 |
2 |
Intrusion Policy Name Metadata |
Current |
|
| 119 |
15 |
2 |
Access Control Rule ID Metadata |
Current |
|
| 120 |
N/A |
N/A |
Access Control Rule Action Metadata |
Current |
|
| 121 |
N/A |
N/A |
URL Category Metadata |
Current |
|
| 122 |
N/A |
N/A |
URL Reputation Metadata |
Current |
|
| 123 |
N/A |
N/A |
Managed Device Metadata |
Current |
|
| 125 |
N/A |
2 |
Malware Event Record (Version 5.1.1+) |
Current |
|
| 125 |
24 |
2 |
Malware Event (Version 5.1.1+) |
Current |
|
| 125 |
33 |
2 |
Malware Event (Version 5.2.x) |
Legacy |
|
| 125 |
35 |
2 |
Malware Event (Version 5.3) |
Legacy |
|
| 125 |
44 |
2 |
Malware Event (Version 5.3.1) |
Legacy |
|
| 125 |
47 |
2 |
Malware Event (Version 5.4+) |
Current |
|
| 127 |
14 |
2 |
Collective Security Intelligence Cloud Name Metadata (Version 5.1+) |
Current |
|
| 128 |
N/A |
N/A |
Malware Event Type Metadata (Version 5.1+) |
Current |
|
| 129 |
N/A |
N/A |
Malware Event Subtype Metadata (Version 5.1+) |
Current |
|
| 130 |
N/A |
N/A |
FireAMP Detector Type Metadata (Version 5.1+) |
Current |
|
| 131 |
N/A |
N/A |
FireAMP File Type Metadata (Version 5.1+) |
Current |
|
| 132 |
N/A |
N/A |
Security Context Name |
Current |
|
| 207 |
N/A |
N/A |
Intrusion Event (IPv4) Record 5.0.x - 5.1 |
Legacy |
|
| 208 |
N/A |
N/A |
Intrusion Event (IPv6) Record 5.0.x - 5.1 |
Legacy |
|
| 260 |
19 |
2 |
ICMP Type Data Data Block |
Current |
|
| 270 |
20 |
2 |
ICMP Code Data Block |
Current |
|
| 400 |
34 |
2 |
Intrusion Event Record 5.2.x |
Legacy |
|
| 400 |
41 |
2 |
Intrusion Event Record 5.3 |
Legacy |
|
| 400 |
42 |
2 |
Intrusion Event Record 5.3.1 |
Legacy |
|
| 400 |
45 |
2 |
Intrusion Event Record 5.4+ |
Current |
|
| 500 |
32 |
2 |
File Event (Version 5.2.x) |
Legacy |
|
| 500 |
38 |
2 |
File Event (Version 5.3) |
Legacy |
|
| 500 |
43 |
2 |
File Event (Version 5.3.1) |
Legacy |
|
| 500 |
46 |
2 |
File Event (Version 5.4+) |
Current |
|
| 502 |
32 |
2 |
File Event (Version 5.2.x) |
Legacy |
|
| 502 |
38 |
2 |
File Event (Version 5.3) |
Legacy |
|
| 502 |
43 |
2 |
File Event (Version 5.3.1) |
Legacy |
|
| 502 |
46 |
2 |
File Event (Version 5.4+) |
Current |
|
| N/A |
27 |
2 |
File Event SHA Hash for 5.3+ |
Current |
|
| 510 |
N/A |
N/A |
File Type ID Metadata for 5.3+ |
Current |
|
| 511 |
40 |
2 |
File Event SHA Hash for 5.3+ |
Current |
|
| 520 |
28 |
2 |
Geolocation Data Block for 5.2+ |
Current |
|
| 530 |
N/A |
N/A |
File Policy Name |
Current |
|
| 600 |
N/A |
N/A |
SSL Policy Name |
Current |
|
| 602 |
N/A |
N/A |
SSL Cipher Suite |
Current |
|
| 604 |
N/A |
N/A |
SSL Version |
Current |
|
| 605 |
N/A |
N/A |
SSL Server Certificate Status |
Current |
|
| 606 |
N/A |
N/A |
SSL Actual Action |
Current |
|
| 607 |
N/A |
N/A |
SSL Expected Action |
Current |
|
| 608 |
N/A |
N/A |
SSL Flow Status |
Current |
|
| 613 |
N/A |
N/A |
SSL URL Category |
Current |
|
| 614 |
50 |
2 |
SSL Certificate Details Data Block for 5.4+ |
Current |
|
| 700 |
N/A |
N/A |
Network Analysis Policy Record |
Current |
Firepower Event Streamer Integration Guide:
https://www.cisco.com/c/en/us/support/security/defense-center/products-programming-reference-guides-list.html
Can eNcore de-duplicate data to keep my SIEM costs lower?
No. however explore the dedup commands in Splunk and potentially create commands that would eliminate duplicate entries, this is of course very manual intensive and error prone.
Splunk guide on deduping events:
https://docs.splunk.com/Documentation/SCS/current/SearchReference/DedupCommandExamples
Can I run two instances of eNcore in a HA pair?
Yes and no. It is technically possible to run two side-by-side, but they will be completely ignorant of each other, and output double the data. It may be preferable to run them in a hot-stand-by configuration where the primary client’s state and configuration data is regularly copied to the secondary client.
The state and configuration data in question is estreamer.conf; x.x.x.x-port_bookmark.dat; x.x.x.x-port_cache.dat; x.x.x.x-port_pkcs.cert; x.x.x.x-port_pkcs.key; x.x.x.x-port_status.dat
Can I increase the logging granularity?
Yes, change logging.level in the .conf file.
Please note that while it is possible to increase this level to VERBOSE, the performance impact will be crippling. DEBUG may be useful but slow. We strongly recommend not going above INFO for standard production execution.
8 Cisco Support
Support is provided by Cisco TAC.
The application is free to use and is community supported. Questions can be emailed to encore-community@cisco.com.
9 Links and Resources
A complete up-to-date listing of CSTA partners is here:
https://www.cisco.com/c/m/en_us/products/security/technical-alliance-partners.html
9.1 Useful links
· Splunkbase: https://splunkbase.splunk.com/
· eNcore TA for Firepower 6.x customers: https://splunkbase.splunk.com/app/3662/
· Firepower App for Splunk (2019): https://splunkbase.splunk.com/app/4388/#/overview
· FTA and Dashboard for Firepower 5.4 (2014): https://splunkbase.splunk.com/app/1629/
· FTD TA: https://splunkbase.splunk.com/app/3955/
· FTD Dashboard: https://splunkbase.splunk.com/app/4010/
· Cisco Security Suite: https://splunkbase.splunk.com/app/525/
· Sourcefire TA for Firepower 5.4: https://splunkbase.splunk.com/app/1808/
· eNcore CLI Version: https://github.com/CiscoSecurity/fp-05-firepower-cef-connector-arcsight
· Firepower App for Splunk Overview on SalesConnect: https://www.cisco.com/c/dam/en/us/products/collateral/security/solution-overview-c22-741993.pdf
10 Appendix
10.1 Firepower Management Center eStreamer Client Certificate Creation
The steps to generate an eStreamer client certificate are as follows:
1 Go to the web interface of the Firepower Management Center at https://fmc-ip-address and log in with your Firepower Management Center credentials.
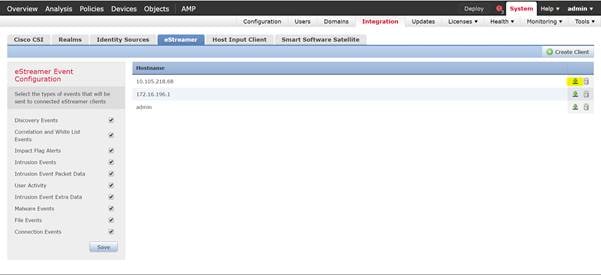
2 In the Firepower Management Center 6.x GUI, go to System > Integration > eStreamer.
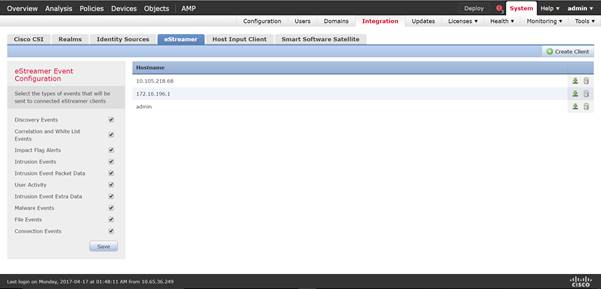
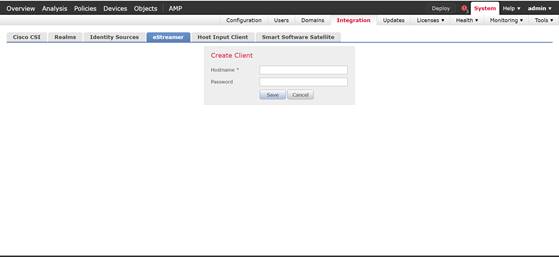
3 Click Create Client.
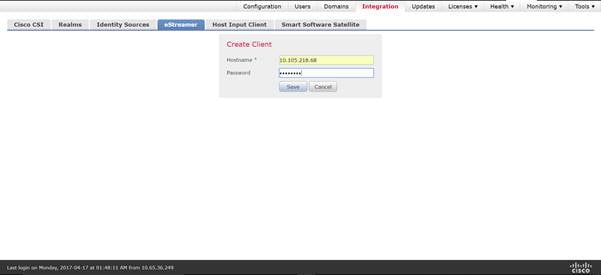
4 Provide the hostname and password.
Note: This should be the IP of the client, which will be collecting the event data from the Firepower Management Center. The password you enter here will be required when you first execute eStreamer eNcore.
Please note that the IP address you enter here must be the IP address of the eStreamer-eNcore client from the perspective of the Firepower Management Center. In other words, if the client is behind a NAT device, then the IP address must be that of the upstream NAT interface.
5 Create a Client Hostname and Password Screen.
6 Click Save.
7 Create a Client Save Screen.
8 Download the PKCS12 file by clicking the Download icon at the right.
9 Download Screen.
10 Copy the PKCS12 file to the desired location in the target device.
By default, eStreamer-eNcore will look for /path/eStreamer_eNcore/client.pkcs12. If you wish to use a different filename, then you must edit the estreamer.conf file.
10.2 Example Configuration File
The eNcore for Splunk add-on comes with a default estreamer.conf file. For reference purposes, an example configuration file is provided below:
{
"connectTimeout": 10,
"responseTimeout": 10,
"@startComment": "0 for genesis, 1 for now, 2 for bookmark",
"start": 2,
"monitor": {
"period": 120,
"bookmark": false,
"handled": true,
"details": true
},
"logging": {
"@comment": "Levels include FATAL, ERROR, WARNING, INFO, DEBUG, VERBOSE and TRACE",
"level": "INFO",
"format": "%(asctime)s %(name)-12s %(levelname)-8s %(message)s",
"stdOut": true,
"filepath": "estreamer.log"
},
"@queueComment": [
"Maximum number of messages buffered before throttling takes place. The more powerful",
"your CPU and more RAM you have, the larger this number can be. It's essentially a",
"buffer size. Beyond a certain size you won't see any performance gain and it will",
"just take longer to stop"
],
"maxQueueSize": 100,
"subscription": {
"servers": [
{
"host": "1.2.3.4",
"port": 8302,
"pkcs12Filepath": "client.pkcs12",
"@comment": "Valid values are 1.0 and 1.2",
"tlsVersion": 1.2
}
],
"records": {
"@comment": [
"Just because we subscribe doesn't mean the server is sending. Nor does it mean",
"we are writing the records either. See handler.records[]"
],
"packetData": true,
"extended": true,
"metadata": true,
"eventExtraData": true,
"impactEventAlerts": true,
"intrusion": true,
"archiveTimestamps": true
}
},
"handler": {
"records": {
"core": true,
"metadata": true,
"flows": true,
"packets": true,
"intrusion": true,
"rua": true,
"rna": true,
"@includeComment": "These records will be included regardless of above",
"include": [],
"@excludeComment": [
"These records will be excluded regardless of above (overrides 'include')",
"e.g. to exclude flow and IPS events use [ 71, 400 ]"
],
"exclude": []
},
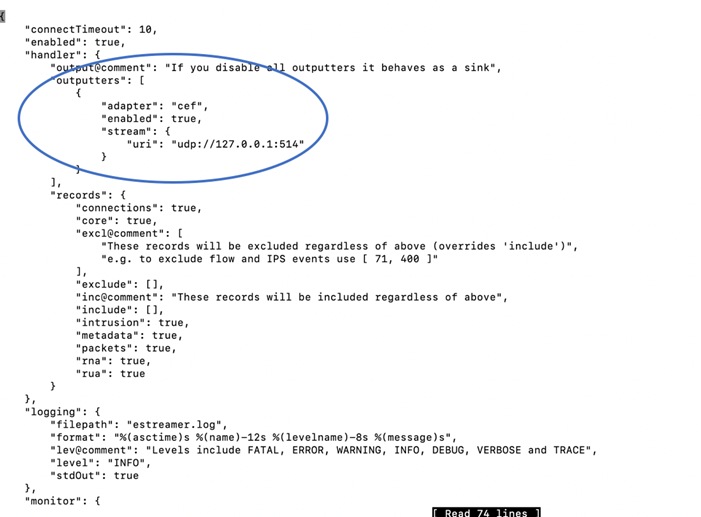
"@comment": "If you disable all outputters it behaves as a sink",
"outputters": [
{
"name": "Splunk default",
"adapter": "splunk",
"enabled": true,
"stream": {
"uri": "relfile:///data/splunk/encore.log{0}",
"options": {
"rotate": true,
"maxLogs": 9999
}
}
},
{
"name": "JSON",
"adapter": "json",
"enabled": false,
"stream": {
"uri": "relfile:///data/json/log{0}.json",
"options": {
"rotate": true,
"maxLogs": 9999
}
}
}
]
}
}
11 Disclaimer
THE SPECIFICATIONS AND INFORMATION REGARDING THE PRODUCTS IN THIS MANUAL ARE SUBJECT TO CHANGE WITHOUT NOTICE. ALL STATEMENTS, INFORMATION, AND RECOMMENDATIONS IN THIS MANUAL ARE BELIEVED TO BE ACCURATE BUT ARE PRESENTED WITHOUT WARRANTY OF ANY KIND, EXPRESS OR IMPLIED. USERS MUST TAKE FULL RESPONSIBILITY FOR THEIR APPLICATION OF ANY PRODUCTS.
THE SOFTWARE LICENSE AND LIMITED WARRANTY FOR THE ACCOMPANYING PRODUCT ARE SET FORTH IN THE INFORMATION PACKET THAT SHIPPED WITH THE PRODUCT AND ARE INCORPORATED HEREIN BY THIS REFERENCE. IF YOU ARE UNABLE TO LOCATE THE SOFTWARE LICENSE OR LIMITED WARRANTY, CONTACT YOUR CISCO REPRESENTATIVE FOR A COPY.
The Cisco implementation of TCP header compression is an adaptation of a program developed by the University of California, Berkeley (UCB) as part of UCB’s public domain version of the UNIX operating system. All rights reserved. Copyright © 1981, Regents of the University of California.
NOTWITHSTANDING ANY OTHER WARRANTY HEREIN, ALL DOCUMENT FILES AND SOFTWARE OF THESE SUPPLIERS ARE PROVIDED “AS IS” WITH ALL FAULTS. CISCO AND THE ABOVE-NAMED SUPPLIERS DISCLAIM ALL WARRANTIES, EXPRESSED OR IMPLIED, INCLUDING, WITHOUT LIMITATION, THOSE OF MERCHANTABILITY, FITNESS FOR A PARTICULAR PURPOSE AND NONINFRINGEMENT OR ARISING FROM A COURSE OF DEALING, USAGE, OR TRADE PRACTICE.
IN NO EVENT SHALL CISCO OR ITS SUPPLIERS BE LIABLE FOR ANY INDIRECT, SPECIAL, CONSEQUENTIAL, OR INCIDENTAL DAMAGES, INCLUDING, WITHOUT LIMITATION, LOST PROFITS OR LOSS OR DAMAGE TO DATA ARISING OUT OF THE USE OR INABILITY TO USE THIS MANUAL, EVEN IF CISCO OR ITS SUPPLIERS HAVE BEEN ADVISED OF THE POSSIBILITY OF SUCH DAMAGES.
Any Internet Protocol (IP) addresses and phone numbers used in this document are not intended to be actual addresses and phone numbers. Any examples, command display output, network topology diagrams, and other figures included in the document are shown for illustrative purposes only. Any use of actual IP addresses or phone numbers in illustrative content is unintentional and coincidental.
All printed copies and duplicate soft copies are considered un-Controlled copies and the original on-line version should be referred to for latest version.
Cisco has more than 200 offices worldwide. Addresses, phone numbers, and fax numbers are listed on the Cisco website at www.cisco.com/go/offices.
Cisco and the Cisco logo are trademarks or registered trademarks of Cisco and/or its affiliates in the U.S. and other countries. To view a list of Cisco trademarks, go to this URL: www.cisco.com/go/trademarks. Third-party trademarks mentioned are the property of their respective owners. The use of the word partner does not imply a partnership relationship between Cisco and any other company. (1110R)
© 2021 Cisco Systems, Inc. All rights reserved.
 Feedback
Contact Cisco
- Open a Support Case

- (Requires a Cisco Service Contract)