- Client Network Time [sum/min/max]
- Long Lived Client Network Time [sum/min/max/num-samples]
- Server Network Time [sum/min/max]
- Long Lived Server Network Time [sum/min/max/num-samples]
- Network Time [sum/min/max]
- Long Lived Network Time [sum/min/max/num-samples]
- Server Response Time [sum/min/max]
- Response Time [sum/min/max]
- Total Response Time [sum/min/max]
- Total Transaction Time [sum/min/max]
- ART Client Bytes/Packets(Layer 4)
- ART Server Bytes/Packet(Layer 4)
- ART Client Bytes(Layer 3)
- ART Server Bytes(Layer 3)
- ART Count New Connections
- ART Concurrent Sessions
- ART Count Responses
- Responses Histogram Buckets (7-Bucket Histogram)
- ART Count Late Responses
- ART Count Transactions
- ART Client Retransmissions Bytes
- ART Client Retransmissions Packets
- ART Server Retransmissions Bytes
- ART Server Retransmissions Packets
- Client Bytes
- ART All Metrics
Cisco AVC Metric Definitions
NBAR2 Metrics
Next Generation Network-Based Application Recognition (NBAR2) metrics are the metrics and application information with the latest protocol pack that comes with the number of applications supported.
Field IDs represent the fields in a record. The format of the record consists of the order of the fields, which is communicated to the NetFlow template.
Table 2-1 lists the NBAR2 metric summary.
|
|
|
|
|---|---|---|
URI Statistics (Hit Count) |
||
For information about HTTP proxy, see the “HTTP Proxy” section. For information about the Cisco IOS-XE-specific extracted fields, see the Cisco Application Visibility and Control User Guide.
NBAR2 Application ID
The following table lists information about the NBAR2 application ID metric.
Table 2-2 Information About NBAR2 Application ID Metric
|
|
Provides the Layer 7-level information for a particular flow. |
|
|
|
|
|
|
|
|
Figure 2-1 illustrates the Flexible NetFlow Application ID format.
Figure 2-1 Flexible NetFlow Application ID Format

An ID exported by AVC explains which application a particular flow belongs to. Figure 2-1 shows that the Application ID is divided into two parts:
- Engine ID— A unique identifier for the engine that determined the Selector ID. The Classification Engine ID defines the context for the Selector ID. The Engine ID is the first eight bits that provide information about the engine that classifies the flow. IANA-L4, CANA-L3, and so on, are some of the engines that can be classified using an engine ID. Note that the Engine ID does not represent the NBAR2 mechanism used to classify the application. For more information about the engine IDs, see the information available here: http://tools.ietf.org/html/rfc6759
- Selector ID—The remaining 24 bits that provide information about the application. 495(MS office) is one of the applications that can be classified using the classification ID.
The collect application name command exports only the application ID, which is a number that may not be understood by a collector. To export a mapping table between an application ID to application name and description, use the option application-table command in flow exporter configuration.
The following example shows the output of the show flow exporter option application table command:
The following example shows an application-table option. Note that the format of the record is the same for all the export formats, but the Field IDs differ based on the export format protocol. Use show flow exporter <exporter_name> templates command to see the format output.
For more information about various attributes of a particular application, use the option application-attributes command in configuration mode.
The output of the option command in the periodic export of NBAR are sent to the collector for each protocol. The following are the different types of application attributes:
- Category—Provides the first-level categorization for each application.
- Sub-Category—Provides the second-level categorization for each application.
- Application-Group—Identifies the group application that belongs to the same networking application.
- P2P Technology—Specifies whether an application is based on peer-to-peer technology.
- Tunnel Technology—Specifies whether an application tunnels the traffic of other protocols.
- Encrypted—Specifies whether an application is an encrypted networking protocol.
The following example shows how the data looks in an export format:
NBAR2 HTTP Fields
AVC supports the following NBAR2-related fields in Cisco IOS Release 15.2(4)M2, Cisco IOS XE Release 3.9S, and later releases:
HTTP Host
Table 2-3 lists information about HTTP host metric:
|
|
|
|
|
|
|
|
|
|
|
One hostname is exported per flow record.
Figure 2-2 shows the Flexible NetFlow Subapplication ID format.
Figure 2-2 Flexible NetFlow Sub-Application ID Format

The following example shows how the information is exported for HTTP host metric.
URL: http://www.cisco.com/go/avc
The host in this example is www.cisco.com.
The following is a list of the various characteristics of the HTTP Host metric:
- The collector identifies the extracted field name and type based on the Application ID and Subapplication ID that are embedded in it. For an HTTP Host, the Application ID is generally 0x03000050. The first byte specifies the Engine ID and the following three bytes are for the Selector ID. The Subapplication ID for the host is 0x3402. The value is the host string, as shown in the following example:
Selector ID: decimal 80 for HTTP
- The host is collected only when it is configured. It is an independent field and is not related to URI field.
- In IOS platform, P is exported as hostname if HTTP proxy is used.
- If the flow is terminated during the export interval, both the URI and hostname fields will be exported.
- In IOS platform, the maximum length of a hostname is 512 characters long. If a hostname exceeds 512 characters, it will be truncated to 512 bytes and the trailing characters will be dropped. In IOS XE, all extracted fields are variable length fields with a limit of 2KB.
- Multiple transactions are not supported for a host extraction on IOS.
- If the HTTP host is configured for a non-HTTP flow, this field will be exported with no value or zero value size. Microsoft exchange and Telnet are two examples for non-HTTP flows.
URI Statistics
Table 2-4 lists information about URI statistics.
|
|
|
|
|
|
|
|
|
|
|
On XE platform, the URI hits can be configured when the keys used are "match connection id" or "match connection transaction-id". Therefore only one URI is reported with hits=1.
URI and URI hit count are collected and exported using the following format:
uri <delimiter> count <delimiter> uri <delimiter> count <delimiter>...
NULL (\0) is the delimiter. Count is a 2-byte value and is encoded as an integer, while URI is encoded as a string.

Note![]() The collected and exported URI is limited to the first ‘/’. For example, if the URL is http://www.cisco.com/router/isr/g2, the URI collected is ‘/router’.
The collected and exported URI is limited to the first ‘/’. For example, if the URL is http://www.cisco.com/router/isr/g2, the URI collected is ‘/router’.
A pattern is used to export the list of URIs and the corresponding hit counts. For example, if we have the following flows during the 5-minute window (src-ip 1.1.1.1, dest-ip 2.2.2.2. des-port80, protocol TCP):
The result will be exported as: 1.1.1.1, 2.2.2.2, 80, TCP, www.yahoo.com, /music:5/video:3/data:10.
The following are the various characteristics of a URI metric and a URI statistic metric:
- If the collect app http host command is configured in the flow record, the hostname www.yahoo.com will be exported.
- The delimiter is NULL (\0) URI, and the count is always represented in binary format using fixed length or 2 bytes. The delimiters colon (:) and double colon (::) are used here for demonstration purposes.
- The collector parses the URI through the basis of delimiters.
- A FNF export field (42125) is used to export the list of URIs and the corresponding hit counts. The Encoding will be done as follows:
NULL terminated string, followed by 2-byte hit count and so on. For example: [music\05video\03data\010].
- Multiple transactions are not supported for host extraction. If there are multiple transactions in the same TCP connection, NBAR will provide host information from only the first transaction.
- If the flow is terminated in this export interval, both the URI and hostname fields will be exported.
- The maximum length of one URI instance is 512 characters long. If a URI name exceeds 512 characters, it will be truncated to 512 bytes and trailing characters will be dropped and will not be exported.
- The URI hit count is a 2-byte variable. The maximum URI hit count is 65,535.
- If the HTTP URI statistic is configured for non-HTTP flows, this field will be exported as NULL.
- If there are multiple transactions in the same TCP connection, NBAR will provide URI information from only the first transaction. Multi-transaction scenario is not supported for URI extraction.
- AVC on IOS supports tunneled protocol.
- AVC on IOS provides hit count for NULL URIs.
- All the parameters appearing after “?” in the URI will be stripped off and not exported. For example, if the URI is “path?h:test”, the URI that is exported will be “path” only; “h:test” will be stripped off.
- If the URI is index.html, it will be exported as a separate URI and will not be aggregated with first- level " " URI hit count.
HTTP Proxy
In case of HTTP Proxy, the hostname will be a part of the URI. For example, if the browser URL is ‘http://www.cisco.com/go/avc’, and if there is no HTTP proxy, the output will be:
If HTTP proxy is present, the NBAR output will be:
URI: http://www.cisco.com/go [Hostname is part of the URI, and the URI is at first-level only. In this case, it is ‘go’]
If HTTP proxy is not present, there will be one host name per 4-tuple flow. The hostname will be exported. For example, the hostname will be ‘www.cisco.com’ and URI will be ‘go’.
Application Response Time Metrics
Application Response Time (ART) metrics are metrics extracted or calculated by the ART engine. These metrics are available only for TCP flows. ART client/server bytes and packets are for Layer 3 and Layer 4 measurements.
Figure 2-3 illustrates the TCP performance in the context of different types of delay and response time.
Figure 2-3 CP Diagram for Application Response Time Metrics
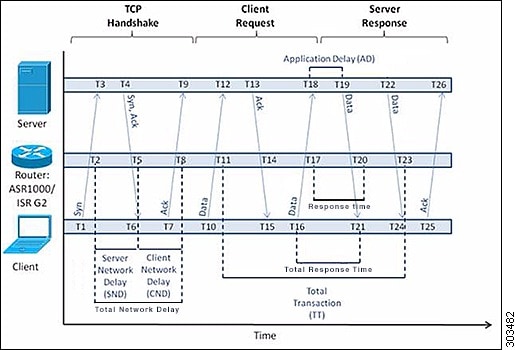
Some of the metrics are available only after certain protocol stages:
- Network time-related metrics are exported only after the TCP three-way handshake.
- Transaction time is measured and exported upon receiving either a new request from a client (which indicates the end of a current transaction) or the first FIN packet.
- Response time is measured and exported only after receiving the first response from the server.
In addition, the collector might occasionally observe zero values for TCP performance metric’s active flows. Possible reasons are:
- The value of the metrics is zero according to the derived metrics calculation formula.
- Some delay metric could be less than 1 millisecond, which is the smallest granularity supported in TCP performance.
From the exported TCP Performance metrics, more metrics can be derived at the collector side.
Average Application Delay (AD) = Connection Delay Application Sum/ Connection Counter Server Responses
Table 2-5 lists the ART metrics summary.
|
|
|
|---|---|
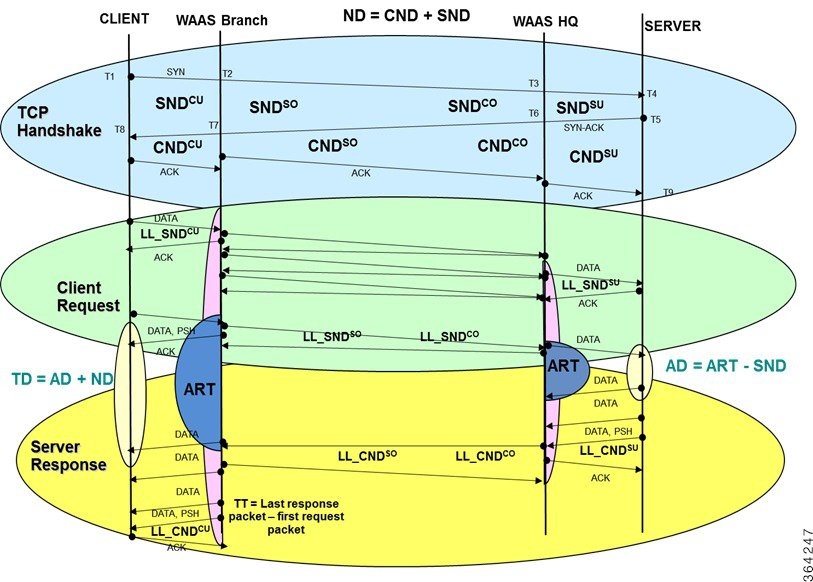
Figure 2-4 Segment Diagram for Application Response Time Metrics
Client Network Time [sum/min/max]
Table 2-6 lists information about the Client Network Time metric.
Table 2-6 Client Network Time Metric
In Figure 2-3, CND is calculated from T5 and T8. Therefore, CND = T8 - T5.
Table 2-7 lists information about the Client Network Time metric with WAAS.
Table 2-7 Client Network Time Metric with WAAS
Note![]() In case of WAAS, CNDCU can be used to calculate the CND. This will include CND + WAAS delay on both headend and branch. WAAS Delays on branch can be obtained by subtracting CNDSO from CNDCU. WAAS delay on HQ is CNDCO - CNDSU
In case of WAAS, CNDCU can be used to calculate the CND. This will include CND + WAAS delay on both headend and branch. WAAS Delays on branch can be obtained by subtracting CNDSO from CNDCU. WAAS delay on HQ is CNDCO - CNDSU
Long Lived Client Network Time [sum/min/max/num-samples]
If you configure mum-sample for network delay, then Long Lived network delays are exported instead of regular Client Network Time.
Table 2-8 lists information about the Long Lived Client Network Time metric.
Table 2-8 Long Lived Client Network Time Metric
Table 2-9 lists information about the Long Lived Client Network Time metric with WAAS.
Table 2-9 Long Lived Client Network Time Metric with WAAS
Note![]() In case of WAAS, LL_CND will be the CND of the segment. For example, in Segment CO or SO, the CND is between the two WAAS devices. While on Segment SU, the CND is between the WAAS device and the server. To obtain total LL_CND, sum the LL_CNDCU + (LL_CNDCO or LL_CNDSO) + LL_CNDSU.
In case of WAAS, LL_CND will be the CND of the segment. For example, in Segment CO or SO, the CND is between the two WAAS devices. While on Segment SU, the CND is between the WAAS device and the server. To obtain total LL_CND, sum the LL_CNDCU + (LL_CNDCO or LL_CNDSO) + LL_CNDSU.
Server Network Time [sum/min/max]
Table 2-10 lists information about the Server Network Time metric.
Table 2-10 Server Network Time Metric.
|
|
Round-trip time between SYN and SYN-ACK. It is also called Server Network Delay (SND). |
|
|
collect connection delay network to-server sum |
|
|
|
|
|
In Figure 2-3, SND is calculated from T2 to T5. Therefore, SND = T5 - T2.
Table 2-11 lists information about the Server Network Time Metric with WAAS.
Table 2-11 Server Network Time Metric with WAAS
Note![]() Same as CND, SND can be used to obtain WAAS delays on both branch and headend. Subtracting SNDCU from SNDSO gives you the branch WAAS delay. Same applies for HQ WAAS.
Same as CND, SND can be used to obtain WAAS delays on both branch and headend. Subtracting SNDCU from SNDSO gives you the branch WAAS delay. Same applies for HQ WAAS.
Long Lived Server Network Time [sum/min/max/num-samples]
If you configure mum-sample for network delay, then Long Lived network server delays are exported instead of the regular Server Network Time.
Table 2-12 lists information about the Long Lived Server Network Time metric.
Table 2-12 Long Lived Server Network Time Metric.
Table 2-13 lists information about the Server Network Time Metric with WAAS.
Table 2-13 Long Lived Server Network Time Metric with WAAS
Note![]() In case of WAAS, to obtain total LL_SND, sum the LL_SNDCU +(LL_SNDCO or LL_SNDSO)+ LL_SNDSU.
In case of WAAS, to obtain total LL_SND, sum the LL_SNDCU +(LL_SNDCO or LL_SNDSO)+ LL_SNDSU.
Network Time [sum/min/max]
Table 2-14 lists the information about the Network Time metric.
Table 2-14 Network Time Metric
In Figure 2-3, Network Delay is calculated from T2 to T8 (RT = T8 - T2). To get the value of ND, ND = SND + CND.
Note![]() In case of WAAS, ND will depend on the value of SND and CND for the segment. ND = SND + CND.
In case of WAAS, ND will depend on the value of SND and CND for the segment. ND = SND + CND.
Long Lived Network Time [sum/min/max/num-samples]
Table 2-14 lists the information about the Long Lived Network Time metric.
Table 2-15 Long Lived Network Time Metric
Note![]() In case of WAAS, the ND will depend on the value of LL_SND and LL_CND for the segment.
In case of WAAS, the ND will depend on the value of LL_SND and LL_CND for the segment.
LL_ND = LL_SND + LL_CND
Server Response Time [sum/min/max]
Table 2-16 lists information about the Server Response Time metric.
Table 2-16 Server Response Time Metric
AD is calculated using the following formula:
If LL_SND is configured, AD = RT – LL_SND
No valid LL_SND sample: IF RT <= LL_SND, AD = 0
With WAAS, see Table 2-17
Table 2-17 Server Response Time Metric with WAAS
|
|
If RT CU > SND CU, AD CU = RT CU –SND CU |
|
|
|
|
|
|
|
|
If RT SU > SND SU, AD SU = RT SU –SND SU |
Response Time [sum/min/max]
Table 2-18 lists information about the Response Time metric.
Table 2-18 Response Time Metric
|
|
Amount of time between a client request and the first server response. |
|
|
collect connection delay response to-server sum |
|
|
|
|
|
A client request can contain multiple packets. In this case, use the last client packet received.
In case of WAAS, RT will be valid only for segment CU and SU.
Total Response Time [sum/min/max]
Table 2-19 lists information about the Total Response Time metric.
Table 2-19 Total Response Time Metric
In Figure 2-3, TD = RT + CND. On XE and IOS, use the following formulae:
In case of WAAS, TD will be valid only for segment CU and SU.
Total Transaction Time [sum/min/max]
Table 2-20 lists information about the Total Transaction Time metric.
Table 2-20 Total Transaction Time Metric
In case of WAAS, TT will be valid only for segment CU and SU.
ART Client Bytes/Packets(Layer 4)
Table 2-21 lists information about the ART Client Bytes/Packets metric.
Table 2-21 ART Client Bytes/Packets Metric
|
|
|
|---|---|
|
|
|
|
|
|
|
|
L4 bytes and packets from client to server. Alternate commands for the same metric are collect connection client counter bytes transport long and collect connection client counter packets transport long.
In case of WAAS, each segment will reflect the client bytes/packets on the segment.
ART Server Bytes/Packet(Layer 4)
Table 2-22 lists information about the ART Server Bytes/Packets metrics.
Table 2-22 ART Server Bytes/Packets Metrics
|
|
|
|---|---|
|
|
|
|
|
|
|
|
L4 bytes and packets from server to client. Alternate commands for the same metrics are collect connection server counter bytes transport long and collect connection server counter packets transport long.
In case of WAAS, each segment will reflect the client bytes/packets on the segment.
ART Client Bytes(Layer 3)
Table 2-22 lists information about the ART Client Bytes/Packets metric.
Table 2-23 ART Client Bytes Layer 3 Metric
|
|
|
|---|---|
|
|
|
|
|
|
|
|
ART Server Bytes(Layer 3)
Table 2-24 lists information about the ART Client Bytes/Packets metric.
Table 2-24 ART Server Bytes Layer 3 Metric
|
|
|
|---|---|
|
|
|
|
|
|
|
|
ART Count New Connections
Table 2-25 lists information about the ART Count New Connections metric.
Table 2-25 ART Count New Connections metric
ART Concurrent Sessions
Table 2-26 lists information about the ART Concurrent Sessions.
Table 2-26 ART Concurrent Sessions
|
|
Number of active concurrent connections at the start of an export interval. |
|---|---|
|
|
|
|
|
|
|
|
Concurrent session metrics is supported only in async/optimized mode. It is not supported in per-packet mode.
ART Count Responses
Table 2-27 lists information about the ART Count Responses metric.
Table 2-27 ART Count Responses Metric
|
|
Number of Req-Rsp pair received within the monitoring interval. |
|---|---|
|
|
|
|
|
|
|
|
In case of WAAS, Count response will be valid only for segment CU and SU and set zero for the CO, SO segments.
Responses Histogram Buckets (7-Bucket Histogram)
Table 2-28 lists information about the Responses Histogram Buckets (7-bucket histogram) metric.
Table 2-28 Responses Histogram Buckets Metric
|
|
Number of responses received during the 7-bucket histogram response time. |
|---|---|
|
|
|
|
|
|
|
|
The following is the list of threshold values (response time) for the 7-buckets histogram:
ART Count Late Responses
Table 2-29 lists information about the ART Count Late Responses metric.
Table 2-29 ART Count Late Responses Metric
In case of WAAS, Count response will be valid only for segment CU and SU and set zero for the CO, SO segments. See Figure 2-5 for a definition of the WAAS segments and information on how to incorporate these into AVC flow exports.
ART Count Transactions
Table 2-30 lists information about the ART Count Transactions metric.
Table 2-30 ART Count Transactions Metric
|
|
|
|---|---|
|
|
|
|
|
|
|
|
A new transaction is counted under one of the following conditions:
- Receiving a data packet from a client request while the previous packet state is server response.
- Receiving a client FIN packet while the previous packet state is server response.
- Receiving a server FIN packet while the previous packet state is server response.
In case of WAAS, the Count response will be valid only for segment CU and SU and set to zero for the CO, SO segments.
ART Client Retransmissions Bytes
Table 2-31 lists information about the ART Client Retransmissions Bytes metric.
Table 2-31 ART Client Retransmissions Bytes Metric
|
|
ART Count Retransmissions metric is the byte count for all the retransmitted client packets. |
|---|---|
|
|
|
|
|
|
|
|
ART Client Retransmissions Packets
Table 2-32 lists information about the ART Client Retransmissions Packets metric.
Table 2-32 ART Client Retransmissions Packets Metric
|
|
ART Count Retransmissions metric is the packet count for all the retransmitted client packets. |
|---|---|
|
|
|
|
|
|
|
|
If the current packet’s sequence number is same as the previous packet’s sequence number, then it is a retransmitted packet. In case of WAAS, the retransmissions are counted per segment.
In case of WAAS, the retransmissions are counted per segment.
ART Server Retransmissions Bytes
Table 2-33 lists information about the ART Server Retransmissions Bytes metric.
Table 2-33 ART Server Retransmissions Bytes Metric
|
|
ART Count Retransmissions metric is the bytes count for all the retransmitted server packets. |
|---|---|
|
|
|
|
|
|
|
|
If the current packet’s sequence number is same as the previous packet’s sequence number, then it is a retransmitted packet. In case of WAAS, the retransmissions are counted per segment.
In case of WAAS, the retransmissions are counted per segment.
ART Server Retransmissions Packets
Table 2-34 lists information about the ART Server Retransmissions Packets metric.
Table 2-34 ART Server Retransmissions Packets Metric
|
|
ART Count Retransmissions metric is the packet count for all the retransmitted client packets. |
|---|---|
|
|
|
|
|
|
|
|
If the current packet’s sequence number is same as the previous packet’s sequence number, then it is a retransmitted packet. In case of WAAS, the retransmissions are counted per segment.
In case of WAAS, the retransmissions are counted per segment.
Client Bytes
Table 2-35 lists information about the Client Bytes metric.
Table 2-35 Client Bytes Metric
|
|
Total L3 bytes sent by the initiator of a connection. Counted for TCP and UDP connections. |
|
|
|
|
|
|
|
|
ART All Metrics
Table 2-36 lists the information about the ART All Metric.
|
|
|
|---|---|
|
|
|
|
|
|
|
|
Cisco WAAS Interoperation Metrics
Cisco Wide Area Application Services (WAAS) metrics are metrics, such as Data Redundancy Elimination (DRE) input bytes, that are extracted or calculated by the Cisco WAAS engine.
WAAS metrics are not available on the performance monitor record type on IOS.
Table 2-37 lists the WAAS metrics summary.
|
|
|
|---|---|
WAAS Segment Number
Table 2-38 lists information about the WAAS Segment Number metric.
Table 2-38 WAAS Segment Number Metric
|
|
|
|---|---|
|
|
|
|
|
|
|
|
Figure 2-5 shows the WAAS segment ID information.
Figure 2-5 WAAS Segment ID Information
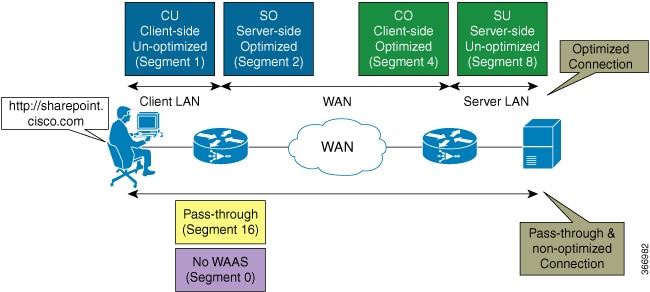
The following are the four segments of WAAS connection in ISR:
- Segment ID 1—WAAS Client Unoptimized (CU)
- Segment ID 2—WAAS Server Optimized (SO)
- Segment ID 4—WAAS Client Optimized (CO)
- Segment ID 8—WAAS Server Unoptimized (SU)
If WAAS decides to pass through the flow, the segment ID is 16. If WAAS does not act on the flow, the segment is 0 (unknown). To receive the WAAS segment ID per flow, ensure that match services waas segment account-on-resolution is configured in the AVC flow record.
WAAS Passthrough Reason
Table 2-39 lists information about the Cisco WAAS Passthrough-reason Metrics.
Table 2-39 Cisco WAAS Passthrough-reason Metrics
|
|
|
|
|
|
|
|
|
|
|
WAAS DRE Input
Table 2-40 lists information about the Cisco WAAS DRE Input metric.
Table 2-40 Cisco WAAS DRE Input Metric
|
|
Total input, measured in bytes, to the DRE engine for compression and decompression on a given WAAS segment. |
|---|---|
|
|
|
|
|
|
|
|
WAAS DRE Output
Table 2-41 lists information about the Cisco WAAS DRE Output metric.
Table 2-41 Cisco WAAS DRE Output Metric
|
|
Total output, measured in bytes, to the DRE engine for compression and decompression on a given WAAS segment. |
|---|---|
|
|
|
|
|
|
|
|
WAAS Lempel-Ziv Input
Table 2-42 lists information about the Cisco WAAS Lempel-Ziv (LZ) Input metric.
Table 2-42 Cisco WAAS Lempel-Ziv (LZ) Input Metric
|
|
Total input, measured in bytes, to the LZ engine for compression and decompression on a given WAAS segment. |
|---|---|
|
|
|
|
|
|
|
|
WAAS Lempel-Ziv Output
Table 2-43 lists information about the Cisco WAAS Lempel-Ziv Output metric.
Table 2-43 Cisco WAAS Lempel-Ziv Output Metric
|
|
Total output, measured in bytes, from the Lempel-Ziv engine for compression and decompression on a given WAAS segment. |
|---|---|
|
|
|
|
|
|
|
|
WAAS Input Bytes
Table 2-44 lists information about the Cisco WAAS Input Bytes metric.
Table 2-44 Cisco WAAS Input Bytes Metric
|
|
Total input, measured in bytes, to the WAAS module on a given WAAS segment. |
|---|---|
|
|
|
|
|
|
|
|
WAAS Output Bytes
Table 2-45 lists information about the Cisco WAAS Output Bytes metric.
Table 2-45 Cisco WAAS Output Bytes Metric
|
|
Total output, measured in bytes, from the WAAS module on a given WAAS segment. |
|---|---|
|
|
|
|
|
|
|
|
WAAS Connection Mode
Table 2-46 lists the information about the Cisco WAAS Connection Mode metric.
Table 2-46 Cisco WAAS Connection Mode Metric
|
|
|
|
|
|
|
|
|
|
|
The Cisco WAAS Connection Mode is a bitmask with the following flags:
WAAS All Metrics
Table 2-47 lists information about the Cisco WAAS All Metrics.
Table 2-47 Cisco WAAS All Metrics
|
|
Collects all the WAAS-related metrics. This CLI works as a replacement for all the WAAS-related collect statements in a flow record. |
|
|
|
|
|
|
|
|
QoS Metrics
Quality of Service (QoS) provides prioritization, shaping, and rate-limiting of traffic. High-priority, latency-sensitive traffic can be put into the priority queue. It can also guarantee minimal bandwidth available to an application or group of applications within a QoS traffic class.
For AVC, QoS class map statements allow matching on all the new NBAR2-supported applications and Layer 7 application fields or protocols, as well as on the NBAR2 attributes, which can co-exist with all other traditional QoS match attributes such as IP, subnet, and DSCP.
Table 2-48 lists the QoS metrics summary.
|
|
|
|---|---|
QoS Policy Classification Hierarchy
Table 2-49 lists information about the QoS Policy Classification Hierarchy.
Table 2-49 QoS Policy Classification Hierarchy
To associate the QoS queue of a particular flow, AVC will export the hierarchy of the class the flow matches with. This hierarchy will be exported in the flow record as a list of IDs. Each ID will be in a separate FNF field. The value of the missing or unnecessary fields defaults to 0. The ID for name mapping will be exported as an option template.
The following example shows the configuration for the basic QoS hierarchy export. The example shows the QoS configuration for parent policy P1 and child policy P11.
bandwidth remaining percent 10
bandwidth remaining percent 70
bandwidth remaining percent 20
Table 2-50 shows a sample mapping table.
The class hierarchy shows hierarchy information up to 5 class level. Each of these ID is a 4-byte integer representing a C3PL policy-map or class-map. The ID to name mapping will be exported as an option template.
|
|
|
|
|---|---|---|
The queue id for a particular class hierarchy will be exported using export field ID 42128.
Two option templates are used to export the class and policy information. The first template is for class ID and class name mapping, and the second template is for policy ID and policy name mapping. The configuration example and the information the option template contains are shown below.
Client: Option classmap option table
Exporter Format: NetFlow Version 9
_____________________________________________________________________
| Field | Type | Offset | Size |
---------------------------------------------------------------------
| v9-scope system | 1 | 0 | 4 |
| c3pl class cce-id | 41001 | 4 | 4 |
| c3pl class name | 41002 | 8 | 40 |
| c3pl class type | 41003 | 48 | 256 |
---------------------------------------------------------------------
Client: Option policymap option table
Exporter Format: NetFlow Version 9
_____________________________________________________________________
| Field | Type | Offset | Size |
---------------------------------------------------------------------
| v9-scope system | 1 | 0 | 4 |
| c3pl policy cce-id | 41004 | 4 | 4 |
| c3pl policy name | 41005 | 8 | 40 |
| c3pl policy type | 41006 | 48 | 256 |
---------------------------------------------------------------------
QoS Queue Drops
Table 2-51 lists information about the QoS Queue Drops.
Media Performance Metrics
Table 2-52 lists all the media monitoring-related fields.
General Metrics
Absolute Timestamp
Table 2-53 lists information about the Absolute Timestamp.
|
|
Absolute timestamp of the first packet and the last packet of the flow. |
|
|
|
|
|
|
|
|
Option Template
A flow record exported to a mapping table is called an option template. The following is an example of the CLI:
Traffic Volume
Traffic volume fields are similar to the FNF fields. For more information, see: http://www.cisco.com/en/US/technologies/tk648/tk362/technologies_white_paper09186a00800a3db9.html.
Field ID Comparison
Cisco ISR G2 and Cisco ASR 1000 should export compatible data. The following are the differences in the solution due to the architectural dissimilarities:
 Feedback