Graph Icons
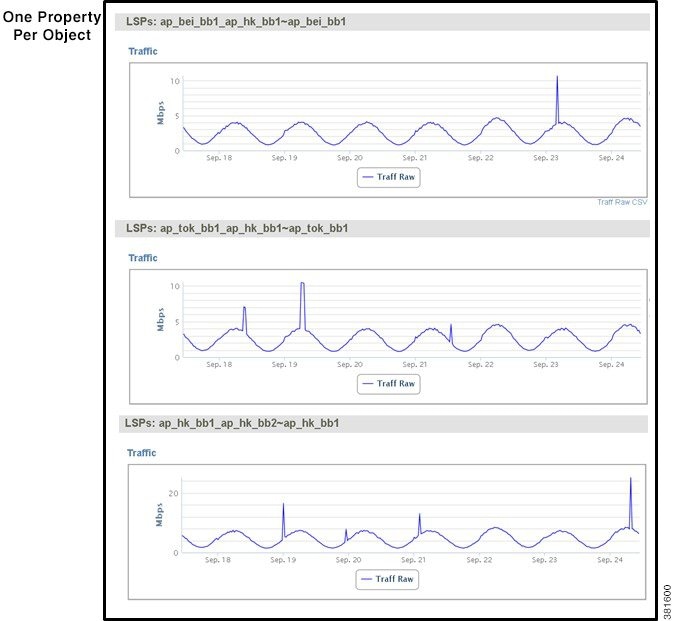
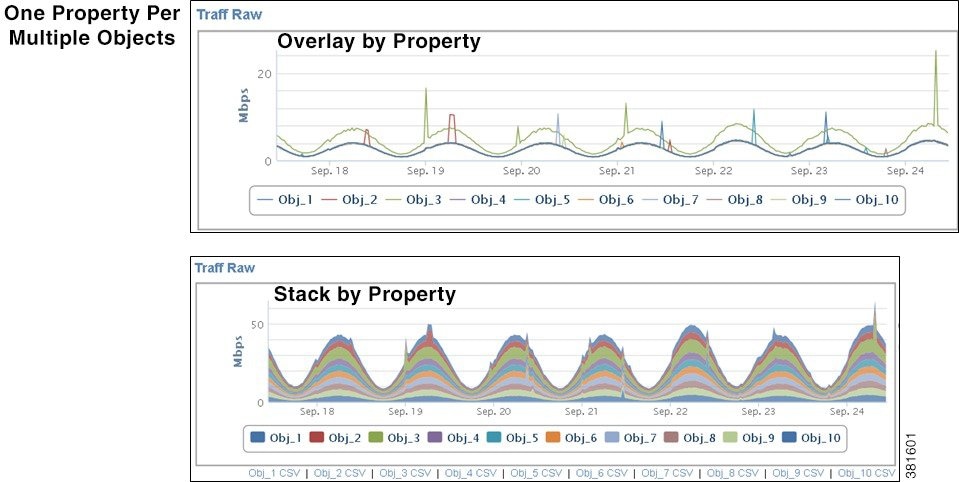
You can view graphs based on a single table entry or on all objects in a table depending on the icon you choose.
These graph icons are available both through the Explore pages and as part of the output generated by most reports.
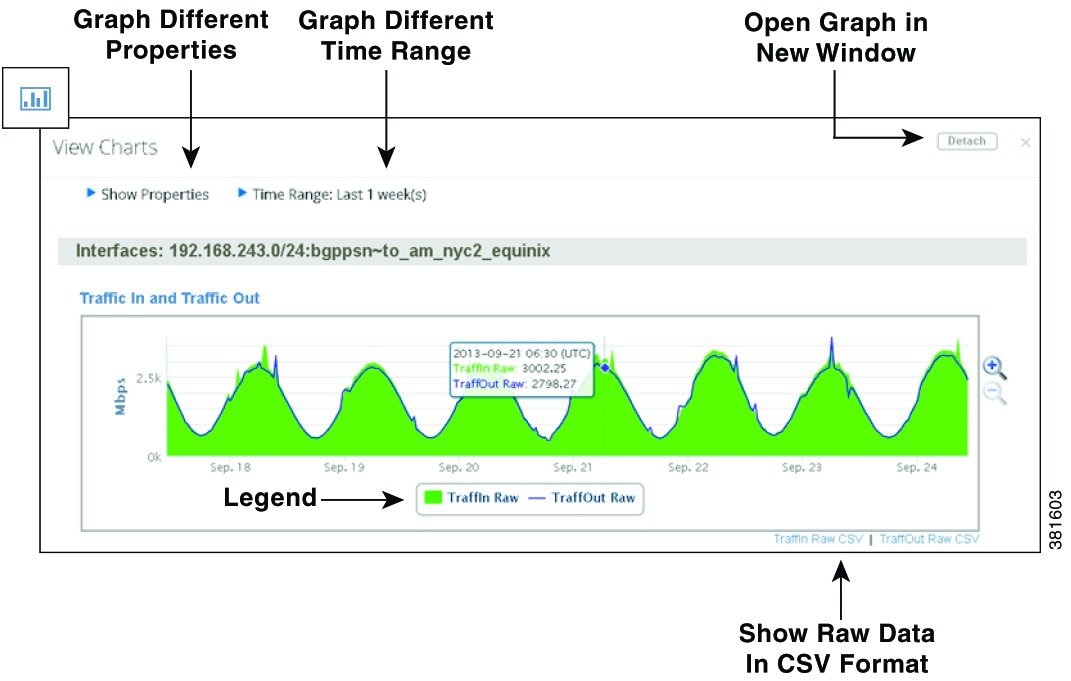
Example Single Graph of Interface Traffic In and Traffic Out Properties shows an example of a single Explore graph of an interface’s Traffic In and Traffic Out over the last week.

 Feedback