Cisco WAE Design Archive 6.4 User and Administration Guide
Bias-Free Language
The documentation set for this product strives to use bias-free language. For the purposes of this documentation set, bias-free is defined as language that does not imply discrimination based on age, disability, gender, racial identity, ethnic identity, sexual orientation, socioeconomic status, and intersectionality. Exceptions may be present in the documentation due to language that is hardcoded in the user interfaces of the product software, language used based on RFP documentation, or language that is used by a referenced third-party product. Learn more about how Cisco is using Inclusive Language.
- Updated:
- January 19, 2016
Chapter: Managing the WAE Design Archive Application
Managing the WAE Design Archive Application
WAE Design Archive is a web application that enables you to store, preview, and retrieve plan files gathered from numerous network snapshots. It shows both a weathermap and time-sequence plots of the network data.
This chapter is divided into these topics, which are specific to managing the WAE Design Archive application.

Note![]() Use the System UI page to manage users.
Use the System UI page to manage users.
Customize the Home Page
You can customize the WAE Design Archive application home page in several ways.
- Group archives together for easy access.
- Add custom content that appears next to each archive and points to either an HTML file or URL.
Visually Group Archives
You can group archives together so that they can be easily identified on the WAE Design Archive home page. Doing so creates a group icon and name with an associated list from which users can select.
To add archives to an existing group, use the archive_config tool with these options.
-
-action edit—Edit the archive to place it in a group for display on the WAE Design Archive home page. -
-name <value>—Name of the archive. -
-group-name <value>—Name of the group. If this group does not exist, it is created.
Example: This groups an archive named “Backbone” within a group named “Chicago.”
archive_config -action edit -name Backbone -group-name Chicago
Add Custom Content
You can add custom information that is displayed next to the archive name on the WAE Design Archive home page. This custom content includes a name (text that appears next to the archive) and a link to either an HTML file or a URL. The HTML content is then interpreted and output to the WAE Design Archive home page.
Example: The content name is "Status." The link is to an HTML file with the following contents.
<span style="font-weight:bold">OK</span>
The home page would have the following custom content for the specified archive.
To add this custom content, use the archive_config tool with the following options.
-
-action edit—Edit the archive to add custom information next to its displayed name on the WAE Design Archive home page. -
-name—Name of the archive. -
-custom-archive-content-name—Custom content name, which is text that appears next to the archive. - Use one of these two options.
–![]()
-custom-archive-content-html —Points to an HTML file location.
–![]()
-custom-archive-content-url —Points to a URL.
Additionally, two system variables are available.
-
$archive_name—Name of the archive. -
$latest_snapshot_datetime—Snapshot file that was most recently inserted into the archive repository.
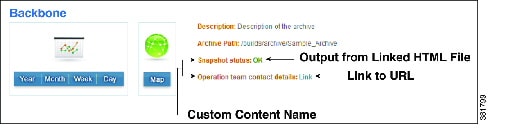
Examples: Refer to Figure 3-1 for the output of the following two customization examples.
- Create custom content with “Snapshot Status” as the name. It outputs HTML file information about the latest snapshot status. The archive name is “Backbone.”
archive_config -action edit -name Backbone -custom-archive-content-name "Snapshot status" -custom-archive-content-html /noc/$archive_name-$latest_snapshot_datetime-status.html
- For the same archive, create another custom content named “Operation team contact details” that links to a URL of associated information.
archive_config -action -edit -name Backbone -custom-content-name "Operation team contact details" -custom-archive-content-url "http://acme_company/noc.html?archive_name=$archive_name"
Figure 3-1 Example Customized Home Page
Customize Weathermaps
Set Plot Options for All Users
You can set up and later modify the visual attributes of the circuits and weathermaps on a per-archive basis. These changes affect all users on a per-archive basis. However, a user has the option to override these settings.
Step 1![]() In the main window, click on the Admin link. The Administration dialog box appears with a list of available archives.
In the main window, click on the Admin link. The Administration dialog box appears with a list of available archives.
a.![]() Select the archive on which you want to set these parameters.
Select the archive on which you want to set these parameters.
Step 2![]() Click Plot Settings tab. The Plot Layout Options dialog box appears.
Click Plot Settings tab. The Plot Layout Options dialog box appears.
Step 3![]() Modify the values as needed. For a description of each of these values, see the Using WAE Design Archive chapter.
Modify the values as needed. For a description of each of these values, see the Using WAE Design Archive chapter.
Add Popup Windows
You can add popup windows to show interfaces, nodes, and sites in the weathermap. The popup windows display information about the selected component, such as the endpoint nodes for an interface, the vendor and model for a single node, or location and node count for sites. You can also specify their visual appearance, such as size.
The content and appearance of the popup windows are defined in a weathermap visual format file, which contains the following tables. If a table is empty, no popup tooltip is displayed.
-
<InterfaceTooltipFormat>( Table 3-1 ) -
<NodeTooltipFormat>( Table 3-2 ) -
<SiteTooltipFormat> -
<TooltipAppearanceParams>
The first three tables have three columns each.
- Heading—Text label.
- SQL Expression—Queries columns in the
table_extractfile. - Type—Defines the data type; can have the following values.
–![]() string—Text string to display
string—Text string to display
–![]() img—URL reference to an image; implemented as
img—URL reference to an image; implemented as <img src=’url’/>
–![]() url—URL reference; implemented as:
url—URL reference; implemented as: <a href=’url’>Header-value</a>
|
|
|
|
|---|---|---|
- From—Selects the name of the source endpoint for the Node or Interfaces columns in the
<Interfaces>table residing in the report file. - To—Selects the name of the destination endpoint for the Node or Interfaces columns in the
<Interfaces>table residing in the report file. - Description—Adds text from the Description column in the Interfaces table residing in the report file.
The default_weathermap_visual_format.txt file in the $CARIDEN_HOME/etc/archive directory contains sample popup definitions.
Table 3-2 and Table 3-3 show definitions for the nodes and sites. Each provides a test header for the popup, the column to query, and the data type. Each of the entries in the SQLExpression column are valid names in the corresponding <Nodes> and <Sites> tables.
|
|
|
|
|---|---|---|
|
|
|
|
|---|---|---|
The <TooltipAppearanceParams> table ( Table 3-4 ) identifies the size of the popup, its margin, and type.
|
|
|
|
|---|---|---|
The attribute names describe the size of the popup and its margin. These are fixed values and cannot be changed.
The ContentMargin is the margin (in pixels) around the edge of the popup.
Customize Visual Format Files
In WAE Design Archive, the time-sequence plots displayed in the Network Statistics view are based on both timeplot_summary_format and t imeplot_visual_format files. Dynamic features of the time-sequence plots, such as pop-ups, are not available when they are created directly using the time_plot tool.
-
timeplot_summary_format.txt—Extracts information from archive plan files by running an SQL query on the archive database. These parameters identify what is available for viewing in the web browser. If this file is not saved in the archive, thedefault_timeplot_summary_format.txtfile in the$CARIDEN_HOME/etc/archivedirectory is used. -
timeplot_visual_format.txt—Identifies how the web browser displays summary data (timeplot_summary_format.txt) from that archive. The default file name isdefault_timeplot_visual_format.txtand is stored in the$CARIDEN_HOME/etc/archivedirectory. It uses two tables:<Panels>and<PlotData>.
WAE Design Archive uses a single visualization format for all archives. You can override this behavior by copying different visual format files into the root directory of each archive.
Panels
For WAE Design Archive, the <Panels> table in the timeplot_visual_format.txt file identifies the panels (plot regions) displayed. Each row defines a separate panel.
|
|
|
|
|
|
|---|---|---|---|---|
- Number—Panel number that determines the order in which the panel appears; for each panel number, there must be an associated PanelNum in the
<PlotData>table. - Type—Type of plots in the panel. Each plot type interprets the summary data and the
<PlotData>columns. See Panel Types. - Heading—Name of the panel.
- Height—Height of the panel in pixels.
- Color—Color of the panel background using standard HTML color definitions or RGB values. For example, red = #FF0000. For a reference to HTML colors, see
http://www.w3schools.com/html/html_colornames.asp. - MinValue—Minimum value of the Y-axis. If omitted, this value scales to the data; only valid for UtilPlot, ProportionPlot, and BarGraphPlot.
- URL—This column is not used.
Panel Types
The panel types determine how the summary data assigned to each panel is plotted.
- TrafficPlot—Displays traffic values; similar to UtilPlot, but the Y-axis is in bits per second (bps).
- CumTrafficPlot—Displays traffic values with plots stacked on top of each other to show cumulative traffic totals.
- ProportionPlot—Displays cumulative traffic with an overall total that is scaled to 100%. An example application is to show proportions of traffic entering or leaving the data from particular peers.
- BarGraphPlot—Shows utilizations or values represented as percentages; utilizations are shown as bars. Otherwise, this plot is similar to UtilPlot.
- EventPlot—If there are one or more entries in the referenced group in the summary table, a tick mark is displayed in the plot. The only relevant column in the summary table is the Details column. If the mouse is held over the data point, a pop-up displays the first few entries in this column.
The above example <Panels> tables uses EventPlot to mark changes in the plot topology: nodes and interfaces added or removed, capacities and metrics changed. In this case, the Details column defined in the query section of timeplot_summary_format file provides details of all the changes. Refer to the Interfaces Up query in the default_timeplot_summary_format.txt file as an example of how the Details column is defined.
- DotPlot—Similar to the EventPlot, except that instead of a data point, a column of dots equal to the number of rows assigned to the displayed group is shown. If small numbers of events are expected, the dot plot can provide more immediate detail. Refer to the MaxUtilMeas group in the
default_timeplot_summary_format.txtfile. This query returns the top five utilized interfaces. The results are going to be five plot lines with the same grouping that is MaxUtilMeas. As a result, the label will be Label_1 through Label_5. - EventBarPlot—Similar to the EventPlot and DotPlot, except instead of a dot, a filled colored bar graph with a height that represents the number of rows in the displayed group. The color is defined in the
<PlotData>table. - Spacer—Creates space between panels, with height equal to the
Heightsetting.
Plot Data
The <PlotData> table in the timeplot_visual_format.txt file specifies which parameters the t imeplot_summary_format file should query for and display in the web browser. Each row defines a separate plot and a distinct query.
|
|
|
|
|
|
|---|---|---|---|---|
- PanelNum—Number of the panel assigned to the time-sequence plot. This number must also exist as a Number parameter in the
<Plot>table. - Group—Reference to the parameter in the summary file containing data that is plotted. For instance, row 2 (panel 2) in Table 3-6 identifies that the second panel shows the total traffic. This value must be in the
timeplot_summary_formatfile, which then queries the archive for this information and displays it in the web browser. - Label—Label that distinguishes between multiple time-sequence plots that are in the same group across summary files. If multiple labels have the same name they are renamed label, label_2, label_3, etc, in the sequential order they appear in the file.
- Color—Color of the line, data point, or other marking for the data that is plotted.
- Aggregation—Specifies how values in the
timeplot_summary_formatfile are aggregated for week, month, and year time-sequence plots. The default is Avg (average) for all plots. The exception is the DotPlot, which defaults to Sum (summary). Options are Avg, Min, Max, and Sum. - URL—This column is not used.
Customize Summary Files
The timeplot_summary_format.txt file extracts information from archive plan files by running an SQL query on the archive database. These parameters identify what is available for viewing in the web browser. If this file is not saved in the archive, the default_timeplot_summary_format.txt file in the $CARIDEN_HOME/etc/archive directory is used. The time-sequence plots displayed in the Network Statistics view are based on both timeplot_summary_format.txt and t imeplot_visual_format.txt files.
Summary files contain the measured or simulated data that you want to plot using either the application or the time_plot CLI tool. Summary files for an archive are automatically generated every time a plan is inserted into the archive using archive_insert. The summary file is created using rules in the summary format file that is saved in the archive, using archive_init.
You can also manually create a summary file using mate_summary and then insert the summary file using archive_insert. This is not generally required, but is illustrated here to show how a summary file is constructed from a summary format.
To manually create a summary file, first create a report that contains the relevant tables from the plan, and then extract the summary information from the report file. The table_extract tool creates a report file from a plan file, and the mate_summary tool queries the report to produce the summary file.
Customize the Summary Format
The mate_summary tool uses a summary format file to generate a summary file, which generally contains selected data that you want to subsequently display in a time-sequence plot. The default summary format file, which is located in the $CARIDEN_HOME/etc directory, is used to explain how a summary format file is used to generate a summary file. Table 3-7 shows an excerpt from the default summary file, which defines queries for maximum utilization of measured traffic and totals for measured traffic.
|
|
|
|---|---|
SELECT 'Max Util' AS Label, Node||'|'||Interface||'|'||RemoteNode AS Details, UtilMeas AS Value |
|
Table 3-8 shows the contents of the summary file produced by the example in the previous section, us_wan_sum.txt.
|
|
|
|
|
|---|---|---|---|
The summary format file is in a WAE Design table format. It must contain a table called <SummaryFormat> with Group and SQL columns. Each row specifies an SQL query that generates zero or more rows of the <Summary> table. These rows are appended to the <Summary> table, one after the other. The particular implementation of SQL is described in the in the WAE Design Integration and Development Guide. The query is performed by mate_summary on tables passed to it, the table-file and, and optionally, the old-table-file. Typically, as in the example above, these tables are generated from a plan file using table_extract. This is the method that archive_insert uses to generate summary files.
The summary file also uses the WAE Design table format, containing the <Summary> table with columns defined by the queries in the summary format. Particular columns (Group, Label, Value, Details) are used by Archive to display time-sequence plots of this information in a web browser.
The tables available to the SQL queries in the summary format file are the following.
These tables contain exactly the columns of the corresponding tables in the table-file. Examples used in the summary format above are the <Interfaces> and <Nodes> tables. The <Interfaces> table, for example, contains the columns Node, Interface, RemoteNode, and UtilMeas.
These tables contain exactly the columns of the corresponding tables in the old-table-file, if it is specified.
-
Joined_<TableName>, for each object table in thetable-file. These tables are listed in the WAE Design Integration and Development Guide, and they contain following columns. For key column information, refer to the$CARIDEN_HOME/docs/table_schema.htmlfile.
–![]()
<ColumnName>, for each column name in <TableName> in the table-file,
–![]()
Old_<ColumnName>, for each column name <TableName> in the old-table-file.
That is, Joined_<TableName> is the result of a an outer join between the two tables, matching rows by the key columns. This means that the table contains the union of the rows in the two tables. The join fills in NULL entries for TableName rows that are not in Old_TableName, and for Old_TableName rows that are not in TableName. This is used by the example summary format shown above to list the names of the added and removed nodes and interfaces in the plan, compared to the old plan.
An example is the Joined_Interfaces table.
A special case is the Joined_Interfaces_IP table, which is defined in the same way as Joined_Interfaces, except that
–![]() The tables are joined on Node and IP Address, rather than Node and Interface.
The tables are joined on Node and IP Address, rather than Node and Interface.
–![]() Entries with blank IP Address in the
Entries with blank IP Address in the <Interfaces> table are removed.
Joined_Interfaces_IP is used in the default summary format to signal changes in interface settings. It has been found generally more reliable to match interfaces across time using the IP Address tables than using the Interface name. Note that copy_from_template also, by default, matches interfaces between plans using the IP Address.
 Feedback