Cisco Prime Performance Manager Developer Guide, 1.7
Bias-Free Language
The documentation set for this product strives to use bias-free language. For the purposes of this documentation set, bias-free is defined as language that does not imply discrimination based on age, disability, gender, racial identity, ethnic identity, sexual orientation, socioeconomic status, and intersectionality. Exceptions may be present in the documentation due to language that is hardcoded in the user interfaces of the product software, language used based on RFP documentation, or language that is used by a referenced third-party product. Learn more about how Cisco is using Inclusive Language.
- Updated:
- September 28, 2015
Chapter: Report Writing
- General Recommendations
- Summary of Steps for Writing a Report
- Determining Which MIBs are Required
- Compiling a MIB
- Determining the Statistics to Report
- Creating the Report XML and Properties Files
- Coding the Report
- Main Elements of Report XML
- Report M acros
- Add a Comment Stating the MIBs Used for the Report
- Specify the MIB Criteria (Criteria Section)
- Specify the Poll Name and Report Name (Poll Element)
- Specify the MIB Variables to Poll (PollDefinition Section)
- Specify Poll Processing Results (ProcessPollResult Section)
- Assign the Data to the Database Schema (ProcessDBSummary Section)
- Setting Up Equivalencies
- Specify the CSV Output File and Format (CSV Section)
- Set up the Web Reports (GraphReport and TableView Sections)
Writing a Report
Writing a report for Prime Performance Manager requires careful planning and following the report writing steps in the correct order. In this chapter, we walk you through the steps for modifying a prepackaged system report—cpu.xml, and help you to develop, test, and debug your own reports.
General Recommendations
Before you begin developing a new report, review the following recommendations:
- Complete the initial new report XML file development offline from any server until the basic report structure is ready. Then deploy the new report to the staging server for initial testing and debugging.
- Avoid developing reports on a live system. Use a staging system to develop new reports. Do not deploy new reports to your production system until they are verified to be working correctly.
Summary of Steps for Writing a Report
1.![]() Copy an existing report from the /opt/CSCOppm-gw/etc/pollers/system directory to the /opt/CSCOppm-gw/etc/pollers/user directory.
Copy an existing report from the /opt/CSCOppm-gw/etc/pollers/system directory to the /opt/CSCOppm-gw/etc/pollers/user directory.
–![]() If needed, modify the UserCapability.xml file for the report.
If needed, modify the UserCapability.xml file for the report.
–![]() If you are using a new MIB, compile the MIB.
If you are using a new MIB, compile the MIB.
2.![]() Code a properties file for the report.
Code a properties file for the report.
Determining Which MIBs are Required
Cisco Prime Performance Manager comes with over 600 Cisco and industry standard MIBs.
To determine if the MIB that you need for your report is available:
Step 1![]() Review the list of MIBs on the gateway.
Review the list of MIBs on the gateway.
- To display a list of compiled MIBs, from the Help menu, choose Reports and then select SNMP MIBs.
- All compiled MIBs are located in the in the /opt/CSCOppm-gw/etc/mibs directory gateway.
Step 2![]() If you need to add a MIB:
If you need to add a MIB:
a.![]() Copy the MIB to the gateway server.
Copy the MIB to the gateway server.
See Compiling a MIB for the procedure for compiling a MIB.
Step 3![]() If you are modifying one of the precoded reports, make sure that there is an entry in the S ystem
If you are modifying one of the precoded reports, make sure that there is an entry in the S ystem![]() Capability.xml file that references the report. If you need to change the system
Capability.xml file that references the report. If you need to change the system![]() capability setting for the file, make any changes in the UserCapability.xml file.
capability setting for the file, make any changes in the UserCapability.xml file.

Note![]() Do not modify the SytemCapability.xml file.
Do not modify the SytemCapability.xml file.
Compiling a MIB
If you are developing a report that a requires a new MIB (a MIB not provided with the Cisco Prime Performance Manager distribution), then you must compile the MIB before you can use it for reports.
Step 1![]() As root user, copy the MIB to the /opt/CSCOppm-gw/etc/mibs directory.
As root user, copy the MIB to the /opt/CSCOppm-gw/etc/mibs directory.
Step 2![]() Enter the following command to suspend unit-gateway file synchronization.
Enter the following command to suspend unit-gateway file synchronization.
Step 3![]() Enter the following command to compile the MIBs in the system:
Enter the following command to compile the MIBs in the system:
The compilemibs command creates an snmpinfo.dat file
Step 4![]() Fix any errors discovered in the MIB or reload the compiled mibs ( snmpinfo.dat).
Fix any errors discovered in the MIB or reload the compiled mibs ( snmpinfo.dat).
Step 5![]() Enter the following command to restart unit-gateway file synchronization:
Enter the following command to restart unit-gateway file synchronization:
You can now develop a report that references the MIB.
Determining the Statistics to Report
To determine which key performance indicators (KPIs) to report for the devices that you are monitoring:
Step 1![]() Look at the compiled MIBs.
Look at the compiled MIBs.
Step 2![]() Based on your reporting requirements, determine which MIB variables to poll.
Based on your reporting requirements, determine which MIB variables to poll.
Step 3![]() Check whether the KPIs you want to report on are covered in existing reports.
Check whether the KPIs you want to report on are covered in existing reports.
Creating the Report XML and Properties Files
The XML file that you create can be:
- A new file based on a copy of an existing Prime Performance Manager report.
- A modification of a user-defined report that already exists for your installation.

Step 1![]() If you are modifying an existing prepackaged report, copy the .xml file for the report and its associated. properties file from the /opt/CSCOppm-gw/etc/pollers/system directory to the / opt/CSCOppm-gw/etc/pollers/user directory or to a working directory of your own choice.
If you are modifying an existing prepackaged report, copy the .xml file for the report and its associated. properties file from the /opt/CSCOppm-gw/etc/pollers/system directory to the / opt/CSCOppm-gw/etc/pollers/user directory or to a working directory of your own choice.
Step 2![]() Rename the copied files. Make sure that they have unique filenames that are not duplicated in the /opt/CSCOppm-gw/etc/pollers/system
Rename the copied files. Make sure that they have unique filenames that are not duplicated in the /opt/CSCOppm-gw/etc/pollers/system![]() directory.
directory.
Step 3![]() If you are using an existing user developed file in the /user directory, copy and rename the file and its associated .properties file.
If you are using an existing user developed file in the /user directory, copy and rename the file and its associated .properties file.
Note![]() If a report file exists in the../system and../user directories, the /user report file will have precedence.
If a report file exists in the../system and../user directories, the /user report file will have precedence.
Coding the Report
Now you are ready to code your report. The following sections take you through the cpu.xml file. This is an existing Prime Performance Manager report file that serves as our “Hello World” example for report writing. We also describe an associated file, the cpu.properties file.
- The cpu.xml file sets up polling of a standard Cisco MIB—CISCO-PROCESS-MIB.my, which reports on active system processes. It also uses the Cisco entity MIB, CISCO-ENTITY-MIB.my.
- The cpu.properties file serves only one purpose. That is, to define variables and text strings that the system uses to display the CPU reports.
Before we start, note these points:
- Since this section is a tutorial, we start with the basics—a walkthrough of the XML elements that you’ll use in your reports.
- Certain advanced topics, such as coding a UserCapability.xml file modeled on the SystemCapability.xml file provided on the Prime Performance Manager gateway, are covered in detail in later sections of this guide.
- Later in this chapter you will find a reference section on typical report writing tasks (See Coding the Report for typical report writing tasks)—some of these tasks are also covered in the tutorial.

Tip![]() While working with the sample report, you can save time by keeping the online report help for the cpu.xml file open in your browser. To see the help page for cpu.xml, go to the Cisco Prime Performance Manager reports tree, choose CPU to bring up the CPU report, then click the report help tool:
While working with the sample report, you can save time by keeping the online report help for the cpu.xml file open in your browser. To see the help page for cpu.xml, go to the Cisco Prime Performance Manager reports tree, choose CPU to bring up the CPU report, then click the report help tool: 
Example 2-1 shows the cpu.xml file.
Main Elements of Report XML
The cpu.xml report has seven main sections:
- Comments — The top of the cpu.xml file contains a comment that identifies the MIBs polled. However, you can place comments anywhere in the XML file.
All of the report sections are specified within one XML section called PollerList. The first line of the PollerList section specifies “http://cisco.com/ppm/poller.” Always include this as stated in the sample reports. You can provide more than one Poll section.
The Poll section is the main element of the XML file, and encapsulates four sections.
Poll is a complex element type that contains elements defined in the EventPoller.xsd schema file, within the Processor element:
- Criteria Section —Specifies a capability value that is defined in the SystemCapability.xml file or the UserCapability.xml file.
See Specify the MIB Criteria (Criteria Section).
- PollDefinition Section —Calls report macros that create a virtual table where polling results are stored.
See Specify the Poll Name and Report Name (Poll Element).
- ProcessPollResult Section —Calls reporting macros and performs operations that modify or format the polling data using formulas or other methods.
See Specify Poll Processing Results (ProcessPollResult Section).
- ProcessDBSummary Section —Sets up and manipulates the table and row format for a virtual table that holds the polled data for the report. At the end of each defined processing interval, the system writes the table data for that processing interval to the physical database on the gateway.
See Assign the Data to the Database Schema (ProcessDBSummary Section).
The final two sections specify the appearance and format of the user reports.
- CSV —Specifies the layout of the CSV file that users create when they view the file in the opt/CSCOppm-gw/reports directory or when they use the export to CSV option on every web report.
See Specify the CSV Output File and Format (CSV Section).
- WebReport —Specifies the attributes of the graphical report that users see when they select the Graph View option. The web report also specifies what is shown in the table view and how it is shown. The WebReport section contains:
–![]() Attributes —These specify the name of the report in Prime Performance Manager menus, where in the report tree the report appears, where the report data comes from, the Properties file for the web report, and so on.
Attributes —These specify the name of the report in Prime Performance Manager menus, where in the report tree the report appears, where the report data comes from, the Properties file for the web report, and so on.
See Specifying the Attributes for the WebReport Section.
–![]() GraphView —Specifies the attributes of the graph view that users see when they select the Graph View option.
GraphView —Specifies the attributes of the graph view that users see when they select the Graph View option.
See Coding the GraphView Section.
–![]() TableView —Specifies the attributes of the table view that users see when they select the Table view option.
TableView —Specifies the attributes of the table view that users see when they select the Table view option.
See Coding the TableView Section.
Note![]() Web reports can also be created and edited using the Prime Performance Manager GUI.
Web reports can also be created and edited using the Prime Performance Manager GUI.
Report Macros
You can use the report macros provided with the Prime Performance Manager gateway in your XML code. Some of the report macros can be used only in specific sections of the XML. For reference information on the report macros, see ChapterB, “Reports Macro Reference”
Add a Comment Stating the MIBs Used for the Report
At the top of your report, include a comment that identifies the MIBs polled for your report. The cpu.xml file contains the following comments:
The extension of the MIBs used should have a.my or.mib suffix.
Specify the MIB Criteria (Criteria Section)
This section deals with an advanced topic in report coding: specifying the criteria used to process the MIBs for your report.
The SystemCapability.xm l specifies the default MIB processing criteria for Prime Performance Manager reports. Do not edit the SystemCapability.xml file. If you need to modify MIB processing criteria, edit the UserCapability.xml file and specify your processing criteria there.
To add a new capability or criteria, add an entry similar to the following to UserCapability.xml:
This entry will check if the MIB table cpmCPUTotalTable on the device has data and set the CISCO_PROCESS_MIB capability if it does. Or you can add:
This entry sets the UDP_MIB capability if the MIB variable udpInDatagrams exists on the device. Macros available for this include isTableNotEmpty() and hasVar(). For information, see ChapterB, “Reports Macro Reference”
Specify the Poll Name and Report Name (Poll Element)
- Specifies the name of the poller and the Report ID. You can use multiple reportIDs for reports under same poll but categorized to different categories, for example:
Make sure to assign a unique name for the poller and the report ID. Also, if you give the different levels of report hierarchy in the web report section for the same poll section, assign a unique report ID.
Note![]() The values for name and reportId are case sensitive.
The values for name and reportId are case sensitive.
For example, if you copy the cpu.xml file to another XML file in your /user directory, give the poller and the report ID a new name that is not duplicated in the /opt/CSCOppm-gw/etc/pollers/system directory or the /opt/CSCOppm-gw/etc/pollers/user directory.
Specify the MIB Variables to Poll (PollDefinition Section)
The PollDefinition section can be used to poll using SNMP (poll), CSV (csvPoll) or CLI (xmlPoll). For SNMP, the MIB parameters are specified in this section. The section defines the polling that is performed for the report and assigns the polled data to internal database tables that Prime Performance Manager uses to generate the reports.
Example 2-2 shows the PollDefinition section for the sample cpu.xml report.
Example 2-2 PollDefinition Section
This section polls specific variable in the CISCO-PROCESS-MIB.my and stores them in two tables:
The MIB objects are standard objects in the CISCO-PROCESS-MIB that provide CPU load monitoring. For additional information and comments, refer to the CISCO-PROCESS-MIB.my file.
The actual polling is done using the POLL macro. This macro has the following syntax:
where the arguments are a list of MIB variables to be polled, enclosed in quotes.
Next, the PollDefinition section calls a macro that is defined for PollDefinition objects, the FILTER macro:
The FILTER macro has the following syntax:
Where object is the table object passed to the macro and arg1 specifies the filtering criterion. Here we are filtering on the cpmCPUThresholdClass. CPU data for objects in the table that have a cpmCPUThresholdClass value of 1 is retained, and objects and their data that do not match are removed from the table.
Now we have two tables: a cpmCPUTotalTable and a cpmCPUThresholdTable. To maximize processing efficiency, we want to combine these two tables into one virtual table. The next line in the PollDefinition section does that:
This is done by calling the LEFTJOIN macro. This macro looks at the cpmCPUThresholdTable and the cpmCPUTotalTable, and if the index values are the same, joins rows from the two tables into one table.
Now we have one table that contains all of the data that we want to process.
The LEFTJOIN macro has the following syntax:
LEFTJOIN ( object, arg1, arg2)
where object and arg1 are tables and arg2 is the condition whether each row has a match.
The macro returns the resulting joined tables of object and arg1.
A row from object and a row from arg1 are joined together if the condition ( arg2) is true. However, each object row will be retained in the resulting table even if it does not match any row from the object specified in arg1.
Note![]() setCpuInfo() is a special macro that gets data from the ENTITY-MIB and fills in the data for the mentioned fields.
setCpuInfo() is a special macro that gets data from the ENTITY-MIB and fills in the data for the mentioned fields.
Specify Poll Processing Results (ProcessPollResult Section)
The ProcessPollResult section sets up variables to manipulate the data and processes it to obtain the information for the CPU report.
Example 2-3 shows the ProcessPollResult section of the cpu.xml file.
Example 2-3 ProcessPollResult Section
1.![]() We want to calculate percentage values for CPU average utlilization over two of the time intervals defined in the CISCO-PROCESS-MIB: cpmCPUTotal5minRev and cpmCPUTotal1minRev (5 minute intervals and 1 minute intervals).
We want to calculate percentage values for CPU average utlilization over two of the time intervals defined in the CISCO-PROCESS-MIB: cpmCPUTotal5minRev and cpmCPUTotal1minRev (5 minute intervals and 1 minute intervals).
2.![]() We also want to calculate percentage values for CPU average peak utilization. The data used to calculate this number is in the cpmCPURisingThresholdValue and cpmCPUFallingThresholdValue values.
We also want to calculate percentage values for CPU average peak utilization. The data used to calculate this number is in the cpmCPURisingThresholdValue and cpmCPUFallingThresholdValue values.
3.![]() We start by calling the SETCPUINFO macro. In the absence of a specified index, this macro simply sets the CPU description, CPU number, and CPU slot for each CPU whose data is returned in the table.
We start by calling the SETCPUINFO macro. In the absence of a specified index, this macro simply sets the CPU description, CPU number, and CPU slot for each CPU whose data is returned in the table.
The percentage figures used to determine CPU average utilization and CPU average peak utilization are calculated by dividing the data for each MIB variable by 100.
We now have the data that we want to display in our Prime Performance Manager reports.
Now we want to assign the calculated values to the Prime Performance Manager gateway’s database. This is done in the next section of the XML code—the ProcessDBSummary section.
Assign the Data to the Database Schema (ProcessDBSummary Section)
The ProcessDBSummary section sets up table columns in virtual data tables. The var order is not important. Vars are looked up by name when reports are run.
Example 2-4 shows the ProcessDBSummary section for the cpu.xml report.
Example 2-4 ProcessDBSummary Section
The first line of the ProcessDBSummary section specifies the name of the poll and the name of the report.
The rest of the code in the ProcessDBSummary section basically sets up the columns that will be set up in each row of the virtual database.
The operations specified in the operation variables for some of the table columns are defined in the EventPoller.xsd schema file.
The code sets up the table columns in variables that set up the columns. For example, the first three lines of the section set up the CPU slot number, CPU number, and CPU description.
Two of the columns used for the Average Utilization and Peak Utilization parts of the report require calculation of an average value and a maximum value. These are specified by the lines that contain operation=”Max” or operation = “Avg” as shown below:
At the end of each defined polling interval, the data for the virtual table set up for the specified polling interval is written to the physical database on the Prime Performance Manager gateway.
Setting Up Equivalencies
The Equivalence section appears in the PollerList, not in the Poll section like ProcessDBSummary. The baseTableName is the name of the table that contains the variables that you can use to logically link table data. For example, if you want the variable ifDescr, from the INTERFACE table, to be interchangeable with the inputIf variable in NETFLOW_ALLFLOWS, NETFLOW_SOURCES you can do the following:
With this Equivalence section in place, users can go from an Interface level Transport Statistics -> Interface report to any NetFlow report using the ALLFLOWS or SOURCES baseTable. When the NetFlow report is run, the inputIf is replaced with the value of the ifDescr of the interface you were looking at on the Interface report.
At this point, we have extracted the data from the variables polled for the MIB, manipulated the data, and set up the tables for the reporting on each polled device.
Now we are ready to specify how the reports look. This is done in the next two sections Specify the CSV Output File and Format (CSV Section) and Set up the Web Reports (GraphReport and TableView Sections).
Specify the CSV Output File and Format (CSV Section)
The CSV section specifies the layout of the data that is written to a comma separated value (CSV) file when users select the CSV report option. The name tag specifies the filename prefix for all files generated for this report.
Example 2-5 shows the CSV section of the cpu.xml report.
The first line of the CSV section specifies the following values:
- The name of the CSV file.
- The location of the report, in this case the Prime Performance Manager gateway.
- The listen variable, which base table name is being used.
The following attributes can be defined if you want the CSV section to be independently enabled or disabled, for example you want a CSV report generated but not display the report in the GUI. These attributes are also in the WebReport section and have the same purpose:
- reportId is a unique identifier that allows you to specify which set of reports to enable/disable together. Everything with the same reportId are toggled together.
- category is the category the report will appear under on the Report Status page where it can be enabled or disabled. If category is not defined in the WebReport section, this category will not appear in the report tree on the left hand side of the GUI. This allows you to create CSV reports that aren’t displayed in the GUI.
- textProps is optional and lets you point to a properties file in the report directory to look up human readable names. If it isn't set, it will pick up the name corresponding to the XML file that contains it. For example, if this was placed in interface.xml, it uses interface as the textProps and looks for interface.properties.
If you add them to the CSV section, reportId and category are required; textProps is optional.
The remaining lines in the CSV section simply specify the text string or database column data.
Set up the Web Reports (GraphReport and TableView Sections)
The WebReport section (or XML element) includes:
- Attributes —Specify the name of the report in Prime Performance Manager menus, where in the report tree the report appears, where the report data comes from, the Properties file for the web report, and so on
- GraphView Section —Sets up the graph view for the report.
- TableView Section —Sets up the table view for the report.
Specifying the Attributes for the WebReport Section
The attributes for the WebReport section specify key information that determines where the report is displayed and what data it uses.
The attributes set values that are specified in the Properties file for the XML report. For more details on the Properties file for the cpu.xml report, see Specifying the Attributes for the WebReport Section.
Example 2-6 shows the attributes specified for the WebReport section of the cpu.xml file.
Example 2-6 WebReport Attributes
The code shown in Example 2-6 sets these attributes:
- name —Specifies a unique name, which is specified in the Properties file (cpu.properties). This is the report name that appears in Prime Performance Manager menus. The name does not have to map to a properties file. A value given here that does not map to a properties file is shown as-is.
- category —Specifies where the report appears in the Prime Performance Manager report tree.
For example, category=level1Resources,level2CPU specifies that the CPU report will appear under the Resources report category, and will be identified by the text, CPU. The relationships between level1Resources and Resources and level2CPU and CPU come from the properties file. If a properties file does not exist, a report with this category would literally be in the level1Resources category and the level2CPU sub-category.
- reportId —Needs to map to a reportId defined in the Poll definition.
- context —Specifies the drill-down options available with the report and where the report can appear.
- textProps —Specifies the name of the Properties file to use: cpu.properties.
- sortWeight —Specifies the order of the report within the category to which it is assigned. It is one of many optional properties defined in the schema.
The line sortWeight=2 specifies order in which the report types appear in the Reports list.
How the Properties File is Used
Properties files have only one purpose: to set up variables to hold text strings displayed in the web GUI when users select the Graph View or the Table View.
Note![]() CSV names are given within the CSV column/util tag in the XML and not in the properties file.
CSV names are given within the CSV column/util tag in the XML and not in the properties file.
Example 2-7 shows the properties file for the cpu.xml report.
Example 2-7 cpu.properties File
Coding the GraphView Section
The GraphView section sets up the report graph view, including:
- The graph summary table title.
- The graph title and the column names for the graph to be plotted. One graph view can have any number of graphs. The graph column may be a KPI.
- The leaf graph, if applicable.
- Column is also available. Column has several subclasses including Util, Bits, and Bytes. Column displays the value as is. Util multiplies the value by 100 and displays it as a percent.
You can apply attributes to a column including filterable, sortable, compoundname, showPercentageColumn, and others. Showpercentagecolumn, for example, adds all the values in a column and then populates each row with the percentages of the total value for each entry. Using Disk Space Statistics as an example, you can add the showPercentageColumn attribute as follows:
1.![]() Open the.xml file associated with the web report (disk.xml).
Open the.xml file associated with the web report (disk.xml).
2.![]() Scroll to the web report definition you want to edit (WebReport name=wrnDiskStats).
Scroll to the web report definition you want to edit (WebReport name=wrnDiskStats).
3.![]() For at least one graph view column, add a showPercentageColumn attribute with value = true. Replace the following text:
For at least one graph view column, add a showPercentageColumn attribute with value = true. Replace the following text:
You should specify the text that is displayed using variables defined in the properties file for the report, as shown in Example 2-8. You can use the Bytes tag to display the byte values in Kb, Mb, and Gb format, if needed.
Example 2-8 shows the GraphView section of the cpu.xml report.
The GraphSummary element specifies the title that appears above the report graph in the Prime Performance Manager GUI:
This specifies that the title is as specified by the gstCPUUtil variable in the properties file (“CPU Utilization”).
Hiding the Summary Tables on First Report Display
If you want to hide the summary tables the first time the report is displayed, you can use the minimized attribute as in the following example:
Note![]() You can override display of the summary titles on a per-user basis.
You can override display of the summary titles on a per-user basis.
Coding the Graph Sections
The Graph sections within the GraphView section specify the text strings that will identify the two graphs shown in the graph view for the CPU report, as defined in the properties file. These are, CPU Average Utilization and CPU Average Peak Utilization.
Within the Graph section, you can:
- Simply display values “as is” from the database, by coding a Column element. A column element (or util) can also perform operations. For example:
The code in the Graph sections for the cpu.xml report specifies Util values that multiply the base values by 100.
Merging Graphs in Dashboards
Users can use the Prime Performance Manager GUI to merge graphs in views. While users cannot merge graphs in dashboards using the GUI, you can merge graphs in a dashboard using the syntax provided in the following example. The example uses the third table and graph in Resource Dashboards > CPU 1Min/5Min/Memory Stats. The objective is to create a table with used bytes, free bytes, and utilization shown together. The example also creates a graph with used and free bytes displayed together. (Utilization is not included because it is a percentage and the bytes are raw values.)
The following format, from cpuMemDash.xml, performs the table graph merge:
The report has three graphs: used bytes, free bytes, and utilization. These correspond to the three data columns displayed in the summary table. In the <GraphView> tag, an optional graphsToMerge attribute indicates the first two graphs inside the graph view are to be merged. If you do not specify graphsToMerge, all graphs are merged.
Coding a LeafGraph Section
If your report drills down through the available subreports until the lowest level is reached, and only one instance of an object you are reporting on is left, you can code a LeafGraph section to combine the different data metrics for that object in one graph.
For example, for the CPU report, users can click on the text in the CPU Description column for each processor to display a combined report called the CPU Average and Peak Utilization report. Such sub-reports are defined in a LeafGraph section.
The LeafGraph section for the CPU report is specified as follows:
The title attribute for the LeafGraph section specifies a variable from the properties file (gtCPUUtil) that specifies the title of the Leaf report: CPU Average and Peak Utilization. Lines are the default chart data series output style. You can specify the basic bar or stacked percentage column output styles by adding the type attribute, as follows:
Users can modify chart output styles individually. For information, see the “Managing Reports, Dashboards, and Views” chapter the the Cisco Prime Performance Manager 1.7 User Guide.
The Util section specify the titles of two reports items shown in a table at the top of the leaf report Peak Utilization and Average Utilization, and the Util variables specify the table data that is displayed.
Coding the TableView Section
The final section of the cpu.xml report sets the format for the table view for the report.
Example 2-9 shows the TableView section for the cpu.xml report.
Figure 2-1 shows a Table View for the CPU report.
Figure 2-1 Example of a Table View
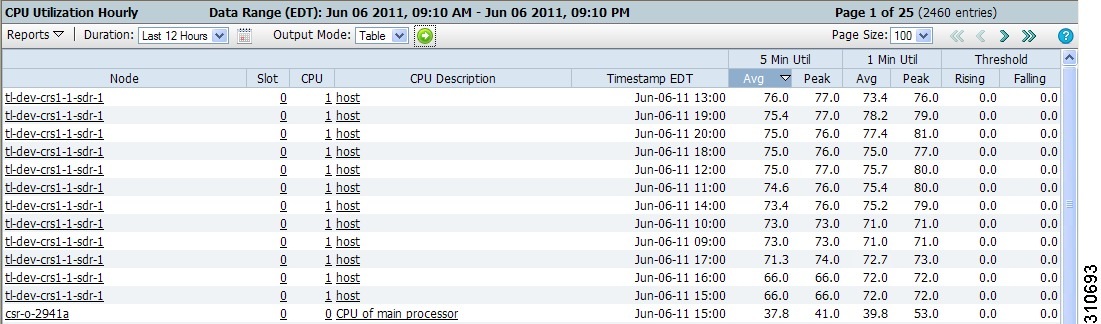
The code in the TableView section specifies the attributes that set up the layout of the table:
- As Figure 2-1 shows, there are several headings that have two subheadings. For example, 5 Min Util has subheadings for Avg and Peak, and Threshold has subheadings for Rising and Falling.
These are specified in the three Label sections:
The colSpans attribute specifies that the main heading spans two subcolumns, and the names attribute specifies the variables that define the text for the headings, as specified in the properties file. For example, cpuUtil5Min specifies the string 5 Min Util.
- Several of the report columns contain links to other items. For example, the CPU Description column contains links that display reports for the selected CPU, and the CPU Description column contains links that display reports for the selected node.
The Link sections define these links, as follows:
The name attribute in each Link section specifies a string, defined in a variable in the properties file, that describes the item; for example slot specifies “Slot.” The context attribute specifies a column in the ProcessDBSummary section, for example, for slot, the data column for CPUSlot is displayed.
The Time section specifies the columns from the DBSummary table that contain data for each time range report and the heading for the subcolumn. For example for the Rising subcolumn for the Threshold column, the code specifies a Util value:
If you don’t want to apply a Util operation to the data, you can code a Column element instead—this will display the data unchanged.
Creating a Report with Thresholdable Fields
Many Prime Performance Manager table and graph view fields are prefixed with a + to indicate users can create thresholds using the Prime Performance Manager Threshold Editor. (For information on creating thresholds, see “Managing Thresholds” in the Cisco Prime Performance Manager 1.7 User Guide.)
Any numeric column value defined in the report XML file WebReport declarations can be configured as a threshold as long as the value is not a key or link value and does not have the 'thresholdable="false"' attribute.
When users create thresholds, they edit the key performance indicator (KPI) properties. The KPI can be either rising or falling. For a rising threshold, the critical alarm threshold must be higher than the major alarm threshold, and the major alarm threshold must be higher than the minor alarm. For a falling threshold, the critical alarm entry must be lower than the major alarm, and the major alarm must be lower than the minor alarm.
You can use the tcaRising attribute to create a thresholdable field with the expected rising or falling KPI value. This attribute is placed under the GraphView or TableView declaration in the report XML file. If you set tcaRising=true (default), the field’s KPI will be rising. If you set tcaRising=false, the KPI will be falling.
Fields for which you cannot use the tcaRising attribute include:
- Any LeafGraph fields.
- Any Dashboard report XML file field. Dashboard reports have *Dash.xml file names.
Following is an example of a thresholdable field based on ping.xml
Providing an Online Help File
After you develop your report, you can provide an online help file for it. If you provide customized Online help for your report, it appears when users choose Custom Help on the Help page for reports.
To create your own online help file:
Step 1![]() Create an HTML file that contains the title of your report. For example, if you report is named test.xml, create an HTML file named test.xml.custhlp.html.
Create an HTML file that contains the title of your report. For example, if you report is named test.xml, create an HTML file named test.xml.custhlp.html.
Step 2![]() Write the content for the file.
Write the content for the file.
Step 3![]() Copy the help file to the following directory on the gateway:
Copy the help file to the following directory on the gateway:
/opt/CSCOppm-gw/apache/share/htdocs/reportHelp/user/
Manually Generating the Online Help Files
If you want to manually generate the system-generated online help files, enter the following from the gateway command line:
Best Practices
Best practices to follow when you develop reports include:
Do not edit the files in the /opt/CSCOppm-gw/etc/pollers/system directory. If you want to use an existing report file and its associated property file as the starting point for a new customized report, copy the files to the /opt/CSCOppm-gw/etc/pollers/user directory and work on them there. If the file has same name, the user file is used. This is best way to create a customized version of an existing system file. You can also pen the report using the Web Report Editor GUI, which will save a copy under the user directory.
Do not edit the SystemCapability.xml file, which is located in the /opt/CSCOppm-gw/etc directory. To modify the capabilities used for your own reports, edit the UserCapability.xml file as required. This file is also located in the /opt/CSCOppm-gw/etc directory.
If you need to add new .xml files or .properties files, add these files and edit them in the /opt/CSCOppm-gw/etc/pollers/user directory.
As you develop the code for your report, exercise care when modifying the schema that is used for previously developed reports. If you modify the internal schema without considering the previous coding that affects it, this might cause the internal database to become unstable and require reinitializing the database.
Make sure that you always use unique poller names, report IDs and database table names for your reports. If you use an existing name, this can cause serious system issues.
Use the .properties file associated with your report’s XML file to specify settings that are used in more than one section of your reports or used across several reports. This ensures consistent processing and helps eliminate errors that can result from coding the same variables more than once.
Task Reference
This section provides reference information for common tasks you might perform while developing reports. Tasks include:
- Enabling 1-Minute and 5-Minute Reports
- Adding a New Column to an Existing Report
- Modifying the ProcessDBSummary Section
- Modifying Poll Definitions
- Modifying the ProcessPollResult Section
- Setting Up Cross Launch of Reports in Cisco Prime Network
- Adding Cross Launch for Your Own Reports
Enabling 1-Minute and 5-Minute Reports
1-minute and 5-minute reports are not enabled by default. You can enable 1-minute and 5-minute reports by editing the XML report definition file that corresponds to the report, or you can allow users to enable1-minute and 5-minute reports using the Prime Performance Manager GUI. The ProcessDBSummary section and the WebReport section require the addition of interval attributes.
Note![]() Setting the interval in the report xml is rarely needed. Report intervals are normallly controlled from the GUI report status. You can set it in the report XML if you want to restrict the options available, usually to not allow a report to set low level values such as 1 min or 5 min if the report can generate very large tables.
Setting the interval in the report xml is rarely needed. Report intervals are normallly controlled from the GUI report status. You can set it in the report XML if you want to restrict the options available, usually to not allow a report to set low level values such as 1 min or 5 min if the report can generate very large tables.
Here is an example of adding the interval attribute to the CPU Utilization report to enable 5-minute reporting in the cpu.xml report definition file:
The 1-minute and 5-minute intervals are included because of the Min1Min5 piece of the interval attribute. The 1-min and 5-minute interval is defined as
interval="1Min5Min15MinHourlyDailyWeeklyMonthly
This attribute is not defined by default and implicitly defaults to 15-minute, hourly, and daily reports.
1-minute and 5-minute reports can also be enabled globally through the GUI:
- In the Reports/Group Settings tab, enable 1-minute and 5-minute reports globally.
- In the Reports/Group Status tab, enable 1-minute and 5-minute reports for specific reports. This can also be performed at the device level.
Note![]() Enabling 1-minute and 5-minute reports will significantly increase the amount of resources required for your units.
Enabling 1-minute and 5-minute reports will significantly increase the amount of resources required for your units.
Adding a New Column to an Existing Report
To add new columns to an existing report:
Step 1![]() If the required MIB attributes are not polled in the PollDefinition section, modify the polling definitions.
If the required MIB attributes are not polled in the PollDefinition section, modify the polling definitions.
Step 2![]() Include the formulas required as shown in Modifying the ProcessPollResult Section.
Include the formulas required as shown in Modifying the ProcessPollResult Section.
Step 3![]() Add the variables in the database table using the Var element in the <ProcessDBSummary> element (see Modifying the ProcessDBSummary Section).
Add the variables in the database table using the Var element in the <ProcessDBSummary> element (see Modifying the ProcessDBSummary Section).
Step 4![]() Save the changes and restart the gateway and unit.
Save the changes and restart the gateway and unit.
Modifying the ProcessDBSummary Section
To add a variable in the ProcessDBSummary section:
Step 1![]() If the required MIB attributes are not polled in the PollDefinition section, modify the polling definitions (see Modifying Poll Definitions).
If the required MIB attributes are not polled in the PollDefinition section, modify the polling definitions (see Modifying Poll Definitions).
Step 2![]() If formula is required add it in the ProcessPollResult section (see Modifying the ProcessPollResult Section.)
If formula is required add it in the ProcessPollResult section (see Modifying the ProcessPollResult Section.)
Step 3![]() Add the variable using Var as given in the following example:
Add the variable using Var as given in the following example:
Example 1 : For variables for which formula calculation is not required, we add code in the ProcessDBSummary section as follows.
Example 2 : For variables for which formula calculation is required, add formulas in the ProcessPollResult section (See Modifying the ProcessPollResult Section) and to the ProcessDBSummary section as shown below:
Modifying Poll Definitions
Step 1![]() Include the Criteria that defined in SystemCapability for this report.
Include the Criteria that defined in SystemCapability for this report.
Here, CISCO_PROCESS_MIB is the capability defined in SystemCapability.xml.
Step 2![]() Include the poll function in the PollDefinition section as shown below:
Include the poll function in the PollDefinition section as shown below:
Here cpmCPUTotalIndex, and cpmCPUTotal5minRev are the MIB attributes from CISCO_PROCESS_MIB.
Modifying the ProcessPollResult Section
To modify the ProcessPollResult section:
Step 1![]() If the required MIB attributes are not polled in the PollDefinition section, see Modifying Poll Definitions.
If the required MIB attributes are not polled in the PollDefinition section, see Modifying Poll Definitions.
Step 2![]() Write the formula and assign it to a variable.
Write the formula and assign it to a variable.
For example, in cpu.xml, cpmCPUTotal5minRev is a polled variable and the formula to be calculated is cpmCPUTotal5minRev / 100.
Step 3![]() Include the formula in the <ProcessPollResult> section as follows:
Include the formula in the <ProcessPollResult> section as follows:
fiveMinUtil is a meaningful name given by the user, which can be used in the other sections of the XML such as the ProcessDBSummary section.
Setting Up Cross Launch of Reports in Cisco Prime Network
If you are using Cisco Prime Performance Manager with Cisco Prime Network, you can set up cross-launch of Prime Performance Manager reports from Cisco Prime Network Vision device shortcut menus.
Using the Prime Performance Manager GUI
To set up cross-launch using the Prime Performance Manager GUI:
Step 1![]() From the System menu, choose Prime Network Integration.
From the System menu, choose Prime Network Integration.
Step 2![]() Click the Prime Network tab.
Click the Prime Network tab.
The Prime Network Gateway page appears.
Step 3![]() On the Prime Network Gateway page, enter the parameters to log into the Prime Network Gateway:
On the Prime Network Gateway page, enter the parameters to log into the Prime Network Gateway:
Step 4![]() Click the Install Cross Launch icon.
Click the Install Cross Launch icon.
The Prime Performance Manager gateway communicates with the Prime Network gateway and automatically installs BQL scripts that add menu selections for Cisco Prime Performance Manager reports to the Device Shortcut Menu.
Figure 2-2 shows an example:
Figure 2-2 Device Shortcut Menu with Cross-Launch Menu Selections
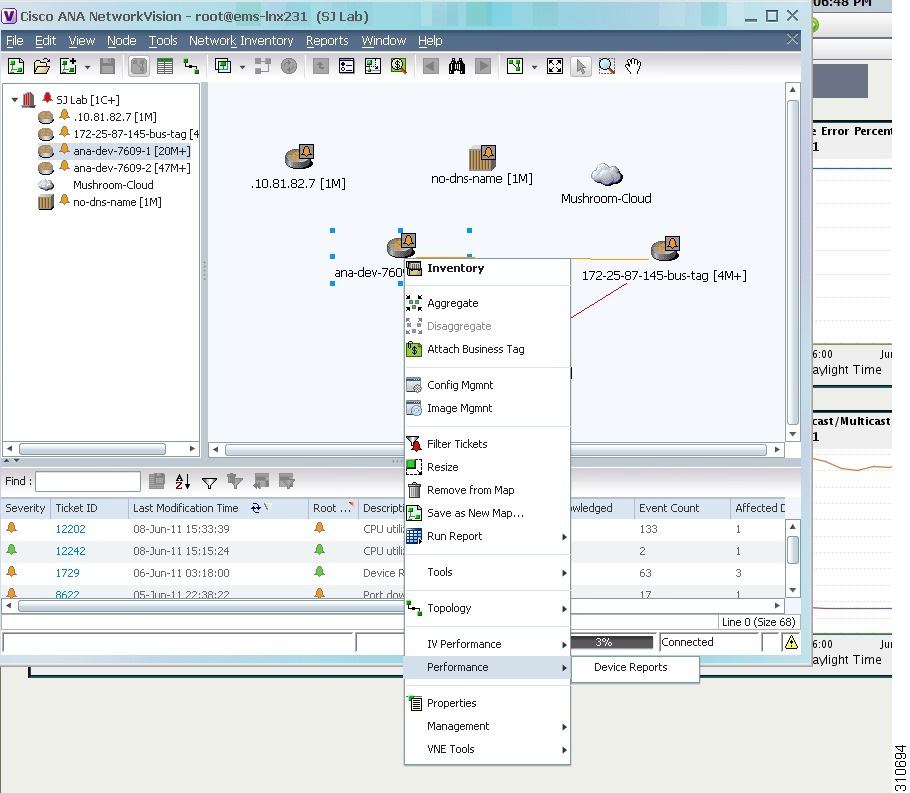
The process adds a menu select for Performance > Device Reports to the Prime Network device shortcut menu.
Prime Network users can now launch reports from the node level or interface level from nodes or interfaces that support the installed reports.
Using the Command Line
To set up cross-launch using the Prime Performance Manager CLI, enter the following command on the gateway:
Adding Cross Launch for Your Own Reports
The CSCOpm-gw/etc/bql/xl directory on the Prime Performance Manage gateway contains several BQL examples for setting and deleting cross-launch points in Prime Network.
Every BQL script that sets a cross-launch point must have a corresponding BQL file to delete the cross launch. The following examples show cross-launch BQL to add a cross-launch point at the node level in Prime Network.
Example 2-10 shows how to add a cross-launch point giving users a Performance > Device Reports menu selection for launching Prime Performance Manager reports at the node level.
Example 2-10 The node.bql File
Example 2-11 shows sample BQL for removing the cross-launch point.
Example 2-11 The node-remove.bql File
After you develop your own reports, you can add cross-launch points in Prime Network by modifying the provided BQL samples and then enabling cross launch.
 Feedback