Cisco Prime Performance Manager Developer Guide, 1.7
Bias-Free Language
The documentation set for this product strives to use bias-free language. For the purposes of this documentation set, bias-free is defined as language that does not imply discrimination based on age, disability, gender, racial identity, ethnic identity, sexual orientation, socioeconomic status, and intersectionality. Exceptions may be present in the documentation due to language that is hardcoded in the user interfaces of the product software, language used based on RFP documentation, or language that is used by a referenced third-party product. Learn more about how Cisco is using Inclusive Language.
- Updated:
- September 28, 2015
Chapter: Overview to Prime Performance Manager Report Customization
Getting Started with Cisco Performance Management Reports
This guide describes the organization and structure of Prime Performance Manager reports so that you can extend the built-in reports that come with Prime Performance Manager and develop your own customized service reports.
XML-Based Service Reports
Prime Performance Manager reports are coded in XML. Out-of-the-box, Prime Performance Manager includes more than 4400 reports that you can use as examples. You can copy an example report to your working directory, modify the XML, and then test and debug your report
The built-in reports display data reports on:
- Application traffic
- Applications
- Availability of device interfaces, MPLS tunnels, pseudowires, and SNMP devices
- Compute technologies including ESXi, Hyper-V, KVM, UCS clusters, and others.
- Data Network Services
- IP Quality of Service (QoS)
- IP Protocol performance
- IP Service-Level Agreement (SLA) statistics
- Layer 2 protocols
- Mobile IOS Statistics
- Mobile StarOS Statistics
- Mobile StarOS CDMA KPI
- Mobile StarOS CDMA statistics
- Mobile StarOS KPI
- Mobile StarOS statistics
- NetFlow
- NetFlow CGNAT
- Network and network services
- Prime Performance Manager system reports
- Resource Utilization, such as CPU and memory utilization
- Security
- Storage (Netapp, EMC, and Fibre Channel)
- Transport statistics, such as ATM statistics, Ethernet Virtual Circuit (EVC) statistics, and so on
- Video Broadcast
For details, see the Cisco Prime Performance Manager 1.7 Data Sheet on www.cisco.com. You should:
1.![]() Go to http://www.cisco.com/go/performance.
Go to http://www.cisco.com/go/performance.
Key Components of the Report Writing Interface
The XML files, MIBs, and configuration files that you need to develop reports are located on the Prime Performance Manager Gateway server.
This guide tells you how to use:
- Supported MIBs —Prime Performance Manager provides support for over 600 Cisco and industry standard MIBs that you can use to develop reports
- Capability Files —Capability files let you define which MIBs are used in reports and which MIB variables are polled. There are two capability files:
–![]() SystemCapability.xml—Precoded system capability file. This file specifies the capabilities for the reports provided with the Prime Performance Manager system. Do not change this file.
SystemCapability.xml—Precoded system capability file. This file specifies the capabilities for the reports provided with the Prime Performance Manager system. Do not change this file.
–![]() UserCapability.xml—System capability file for user-developed reports. If you need to add or revise the reporting capabilities, specify your changes in this file.
UserCapability.xml—System capability file for user-developed reports. If you need to add or revise the reporting capabilities, specify your changes in this file.
- Prepackaged XML Reports —The Prime Performance Manager application provides over 380 XML report files that you can use as a model for your own reports.
- Properties Files —Each XML report file has a corresponding properties file that maps to the report XML file and defines variables used in the online reports and CSV reports.
- Report Macros —A collection of SNMP macros that you can call from your XML report code and UserCapability.xml file to perform processing tasks.
For example, an IpAddress() macro is provided to convert a specified object to an IP address.
- BQL Files —BQL Files enable cross-launching of your reports on Cisco Prime Network clients.
- Online Help —Includes system-generated help for your reports and a Reports Help page.
Directory Locations of Report Files and Related Files
Table 1-1 lists the locations of the reports and related files.
|
|
|
|---|---|
Performance reports (5-minute, 15-minute, hourly, daily, weekly, monthly) exported to CSV. |
|
Precompiled on the Prime Performance Manager gateway. See Chapter B, “Reports Macro Reference” for reference information on the macros. |
Report Processing Overview
The Prime Performance Manager processes reports as follows:
1.![]() Prime Performance Manager polls the devices in the network inventory based on:
Prime Performance Manager polls the devices in the network inventory based on:
–![]() The MIBs selected for polling in Prime Performance Manager reports.
The MIBs selected for polling in Prime Performance Manager reports.
–![]() Filtering specified in the SystemCapability.xml file and in the UserCapability.xml file.
Filtering specified in the SystemCapability.xml file and in the UserCapability.xml file.
–![]() The filtering process queries polled devices as to whether they actually support the MIB being used, and if the MIB is supported. It restricts polling to MIB objects that actually have table data and which meet other specified criteria. This ensures that Prime Performance Manager does not perform unnecessary polling.
The filtering process queries polled devices as to whether they actually support the MIB being used, and if the MIB is supported. It restricts polling to MIB objects that actually have table data and which meet other specified criteria. This ensures that Prime Performance Manager does not perform unnecessary polling.
2.![]() Based on what MIB variables are polled by the system XML reports and by user-defined reports, Prime Performance Manager creates a virtual database table that contains the polled data.
Based on what MIB variables are polled by the system XML reports and by user-defined reports, Prime Performance Manager creates a virtual database table that contains the polled data.
This results in faster processing of polling data and allows reports to be displayed quickly.
3.![]() Based on what you specify in your report XML, the system processes the data returned by the polling. You can use predefined reporting macros to manipulate the data.
Based on what you specify in your report XML, the system processes the data returned by the polling. You can use predefined reporting macros to manipulate the data.
For example, you can convert a value to a percentage.
4.![]() Based on macro calls in the system reports and user-defined reports, Prime Performance Manager modifies the virtual tables. For example, two tables can be joined or data can be selected for inclusion in table rows.
Based on macro calls in the system reports and user-defined reports, Prime Performance Manager modifies the virtual tables. For example, two tables can be joined or data can be selected for inclusion in table rows.
5.![]() Reports that contain data can be viewed when users select them from the Prime Performance Manager Reports tree. The appearance of the reports is customizable in the report XML.
Reports that contain data can be viewed when users select them from the Prime Performance Manager Reports tree. The appearance of the reports is customizable in the report XML.
6.![]() At the end of each reporting period configured for the server, the system saves the virtual table data to the Prime Performance Manager database.
At the end of each reporting period configured for the server, the system saves the virtual table data to the Prime Performance Manager database.
The ability to customize data polling and report display provides you with a flexible and powerful way to report data to users. In the tutorial chapter of this guide,“Writing a Report,” we’ll walk you through the coding of a typical report, the cpu.xml report, and show you how you can modify a sample report to develop your own reports.
Online Reports Help
Prime Performance Manager provides an extensive help system to help you develop reports, including autogenerated help for your report, and a Reports Help page.
Auto-Generated Help for Your Report
When you write and enable a report, Prime Performance Manager automatically creates online help for your project. It also allows you to write and publish a customized help file for it. Prime Performance Manager rebuilds the report help files once every night. You can also manually regenerate the report help by issuing the ppm docreps command from the gateway CLI.
The autogenerated help includes:
- Links to the Report Definition File — Click on the XML filename to view the XML definition. You can view the definition in the PPM Viewer (as straight ASCII text). You can also use the browser’s frame source viewer, which provides a color-coded view that highlights XML keywords and coding elements.
- Custom Help —Click on the Custom Help link to display customized help for the report.
- Links to the MIBs Used in the Report. Click a MIB filename to display the MIB.
Example 1-1 shows the online help for the cpu.xml report.
Example 1-1 System-Generated Help for the cpu.xml Report
Reports Help
To display the online reports help, select the following:
- Help > READMEs and CLI Commands —Displays README, CHANGEs, Device Info, CLI Commands, CLI Commands Help, Release Notes, Quick Start.
- Help > Reports —Displays System Reports Readme, User Reports Readme, Reports XML Definition, Reports List Readme, IETF RFCs, SNMP MIBS, System Capability Definitions, User Capability Definitions.
What You Can Specify
Aside from the MIBs that are polled and MIB variables reported, you can specify report views, report time intervals, sort order for data.
Report Views: Graphs, Tables, and CSV Files
The XML interface lets you code reports to provide users with:
- Graph Views —Display a graph of performance over specified time intervals.
- Table Views —Display performance in a tabular view.
- CSV File View —Lets users save the report in a comma-separated value (CSV) file that they can view using a spreadsheet or a text editor.
The tutorial chapter of this guide ( “Writing a Report” ) walks you through coding of the cpu.xml report, which shows CPU utilization for the network as a whole or for devices that a user selects.
Graph View
Figure 1-1 shows an example of a Graph output view for the CPU Utilization report.
Figure 1-1 CPU Utilization Report in Graph Output View
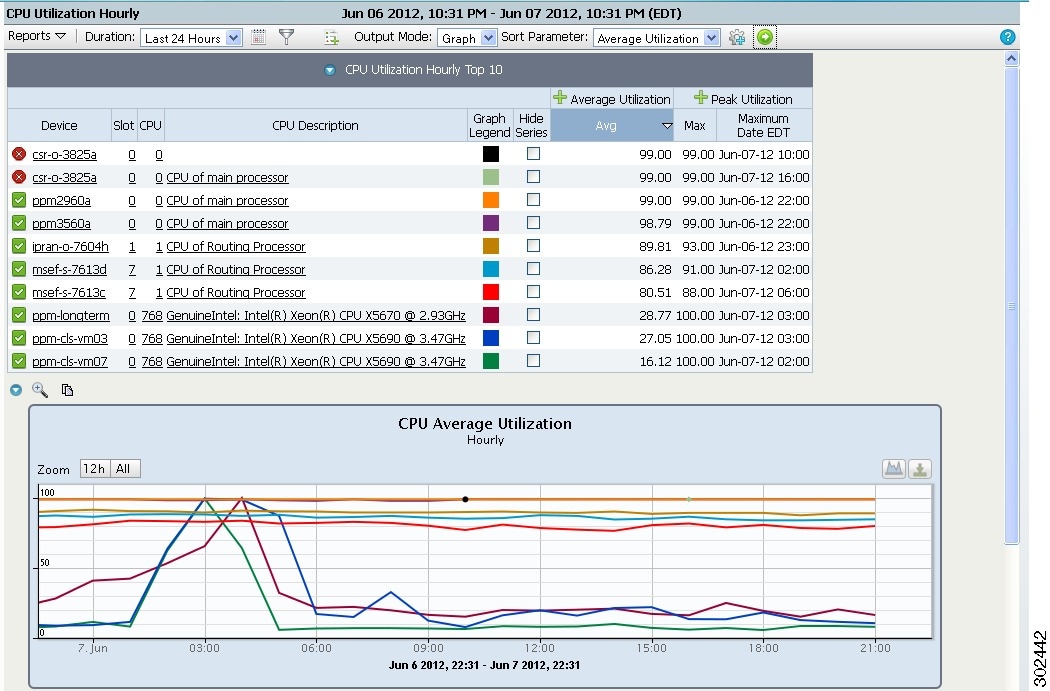
When you code your own report, you can control the time intervals that users can select.
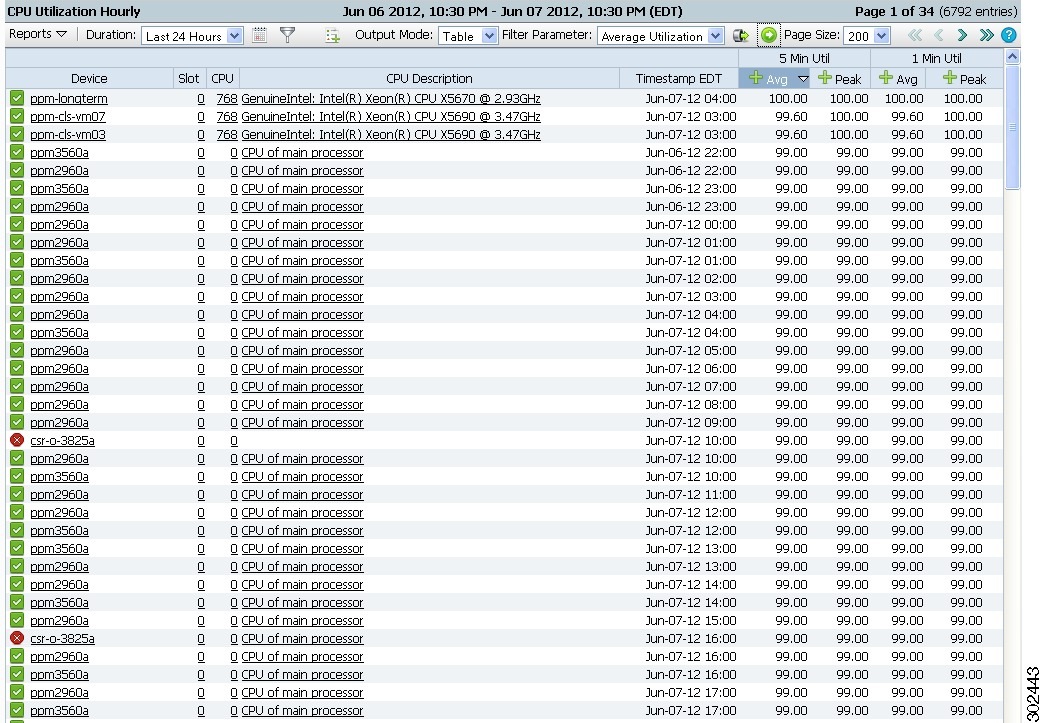
Table View
Figure 1-2 shows a Table output view example for the CPU Utilization report.
Reporting Intervals
The XML schema for the Cisco Prime reports allows you to specify several reporting intervals for your reports.
Sort Order
You can specify the order in which data is sorted on your reports.
Basic Report Categories
There three basic report categories—Network Level reports, Device Level reports, and reports on specific variables. When you first view your report, it shows statistics for the entire discovered network. You can then select specific devices to view reports for a single device.
Report Management Interface
The following report management tabs are available from the Prime Performance Manager GUI by choosing Reports from the Performance menu and any of the following:
- Report Settings —Allows you to enable various report intervals and control report aging.
- Report Status —Allows you to enable or disable reports.
- Report Policies —Allows you to create and manage report policies.
For details on the user interface, see the Cisco Prime Performance Manager 1.7 User Guide.
 Feedback