![]()
Monitoring Managed Device Service Status on the Cisco MSX GUI
Cisco MSX 4.0 uses tenant-centric GUI for the Managed Device service pack. The tenant-centric portal displays both the Operator Workspace and Tenant Workspace.
Tenant-centric GUI has the following workspaces:
-
Operator workspace—Which lists all the tenants and the services these tenants have subscribed to.
-
Tenant Workspace—Which allows tenants to access information related to their subscribed services.
Operator Workspace
The Operator Workspace has dashlets such as Tenants and Services. The tenant-centric portal is role-based and is accessible by both tenants and operators. For more information, see Managing Specific User Roles in Managed Device.

Tenants—Displays all the existing tenants for the logged in user.
Services—Displays all the service packs that are provisioned by tenants.
Tenant Workspace
The following are the menus that are available in the Tenant Workspace:
-
Services— Display the status of all services subscribed by a tenant.
-
Sites—Display the sites a specific tenant is associated with and the overall health status of the sites.
-
Devices—Display devices available at all sites for a particular tenant.
-
Service Controls—Display the custom service controls that are used by the services.
-
Offer Catalog—Displays existing subscriptions and allows subscribing to new services.
Select the desired tenant to view the subscribed Services, Sites, and Status of the respective tenant. For more information, see Monitoring Managed Device Service from Tenant Workspace.
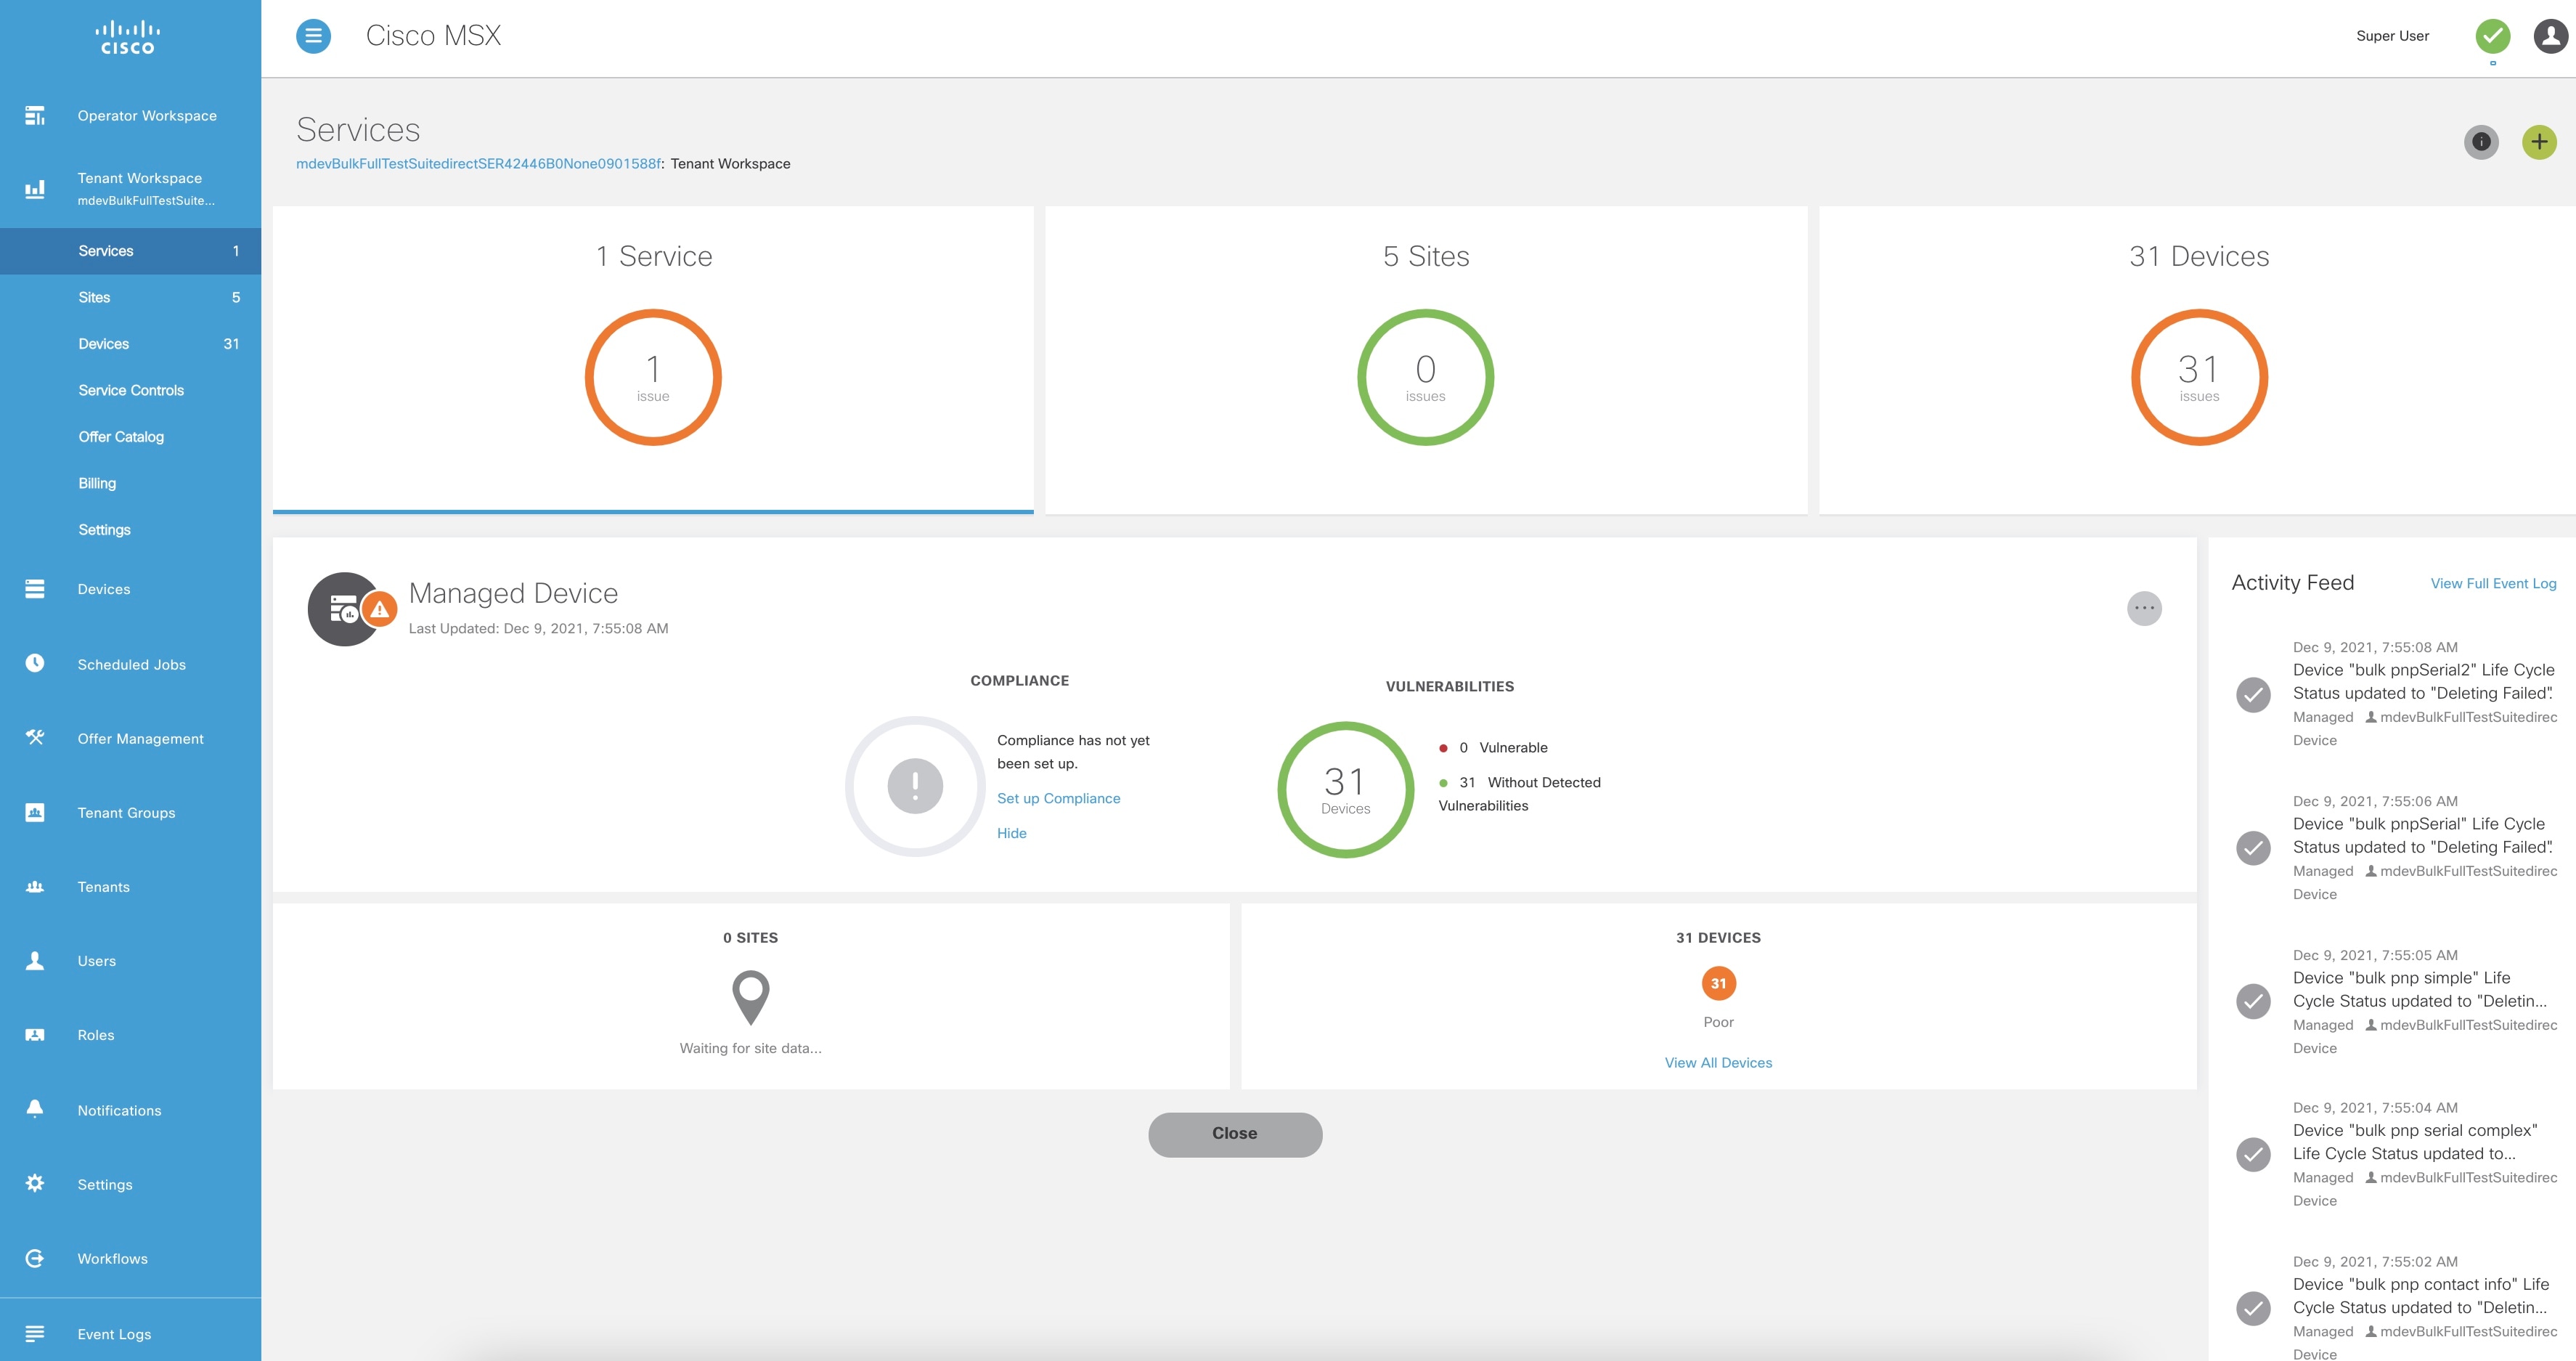
Monitoring Managed Device Service from Tenant Workspace
The tenant-centric portal displays the status of all the Services, Sites, and Devices of the selected tenant.
Procedure
| Step 1 |
Log in to the Cisco MSX portal. |
||
| Step 2 |
From the left pane, choose Operator Workspace. The Operator Workspace home page appears displaying all the Tenants and Services. |
||
| Step 3 |
Select the required tenant. The Services home page of the Tenant Workspace appears with the list of all the provisioned service pack. Displays the Services, Sites, and Devices of the selected tenant.
|
||
| Step 4 |
From the Tenant Workspace main menu, choose Sites to monitor the status of the sites. The map view appears with all the available sites of the selected tenant. Hover the mouse pointer over the site to know the status. |
||
| Step 5 |
From the Tenant workspace main menu, choose Devices to monitor the status of the devices. The list view of all the available devices of the selected tenant appears, displaying the information such as Devices, Services, Serial Number, IP Address, Model, and Configuration. |
||
| Step 6 |
From the Tenant Workspace main menu, choose Service Controls to view the custom service controls that are used by the services. |
||
| Step 7 |
From the Tenant Workspace main menu, choose Offer Catalog to view the existing subscriptions and subscribe to new services. |
Understanding Managed Device Life Cycle Statuses
The Managed Device service pack provides drill-down views of the operational state of the sites.
To view the device status:
Procedure
| Step 1 |
Log in to the Cisco MSX portal. |
||||||||||||||||||||||||||||||||||||||||
| Step 2 |
From the left pane, choose Tenant Workspace > Devices. The Devices tile is displayed with the available devices. |
||||||||||||||||||||||||||||||||||||||||
| Step 3 |
Choose a device from the list. The device information is displayed. The table below shows the color indicators to describe the site status:
|
Viewing Site Metrics
Cisco MSX Managed Device service pack provides the capability to monitor the site status.
When the third-party device is on-boarded to Managed Device, device metrics are automatically calculated based on the device model.
To view the site metrics:
Procedure
| Step 1 |
Log in to the Cisco MSX portal. |
| Step 2 |
From the left pane, choose Tenant Workspace > Sites. The list of sites associated with a tenant is displayed. |
| Step 3 |
Select any one of the sites to view the detailed site status. This page lists all the site metrics along with status of the selected site. Under the Managed Device section of the page, you can view the list of Meraki networks that were assigned to this site. For information on adding Meraki network, see Creating Networks. 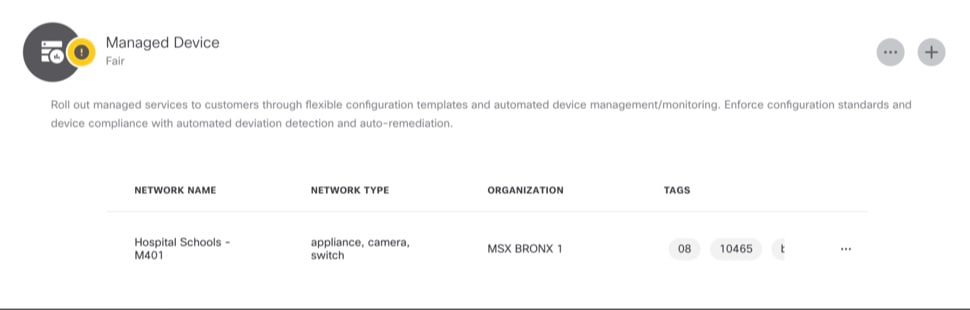
|
Viewing Device Metrics
Cisco MSX Managed Device service pack provides the capability to monitor the device status.
When the third-party device is on-boarded to Managed Device, device metrics are automatically calculated based on the device model.
To view the device metrics:
Procedure
| Step 1 |
Log in to the Cisco MSX portal. |
||||||||||||||
| Step 2 |
From the left pane, choose Tenant Workspace > Devices. The list of devices associated with a tenant is displayed. |
||||||||||||||
| Step 3 |
Select a device from the list. The status of the selected device and other metrics are displayed.
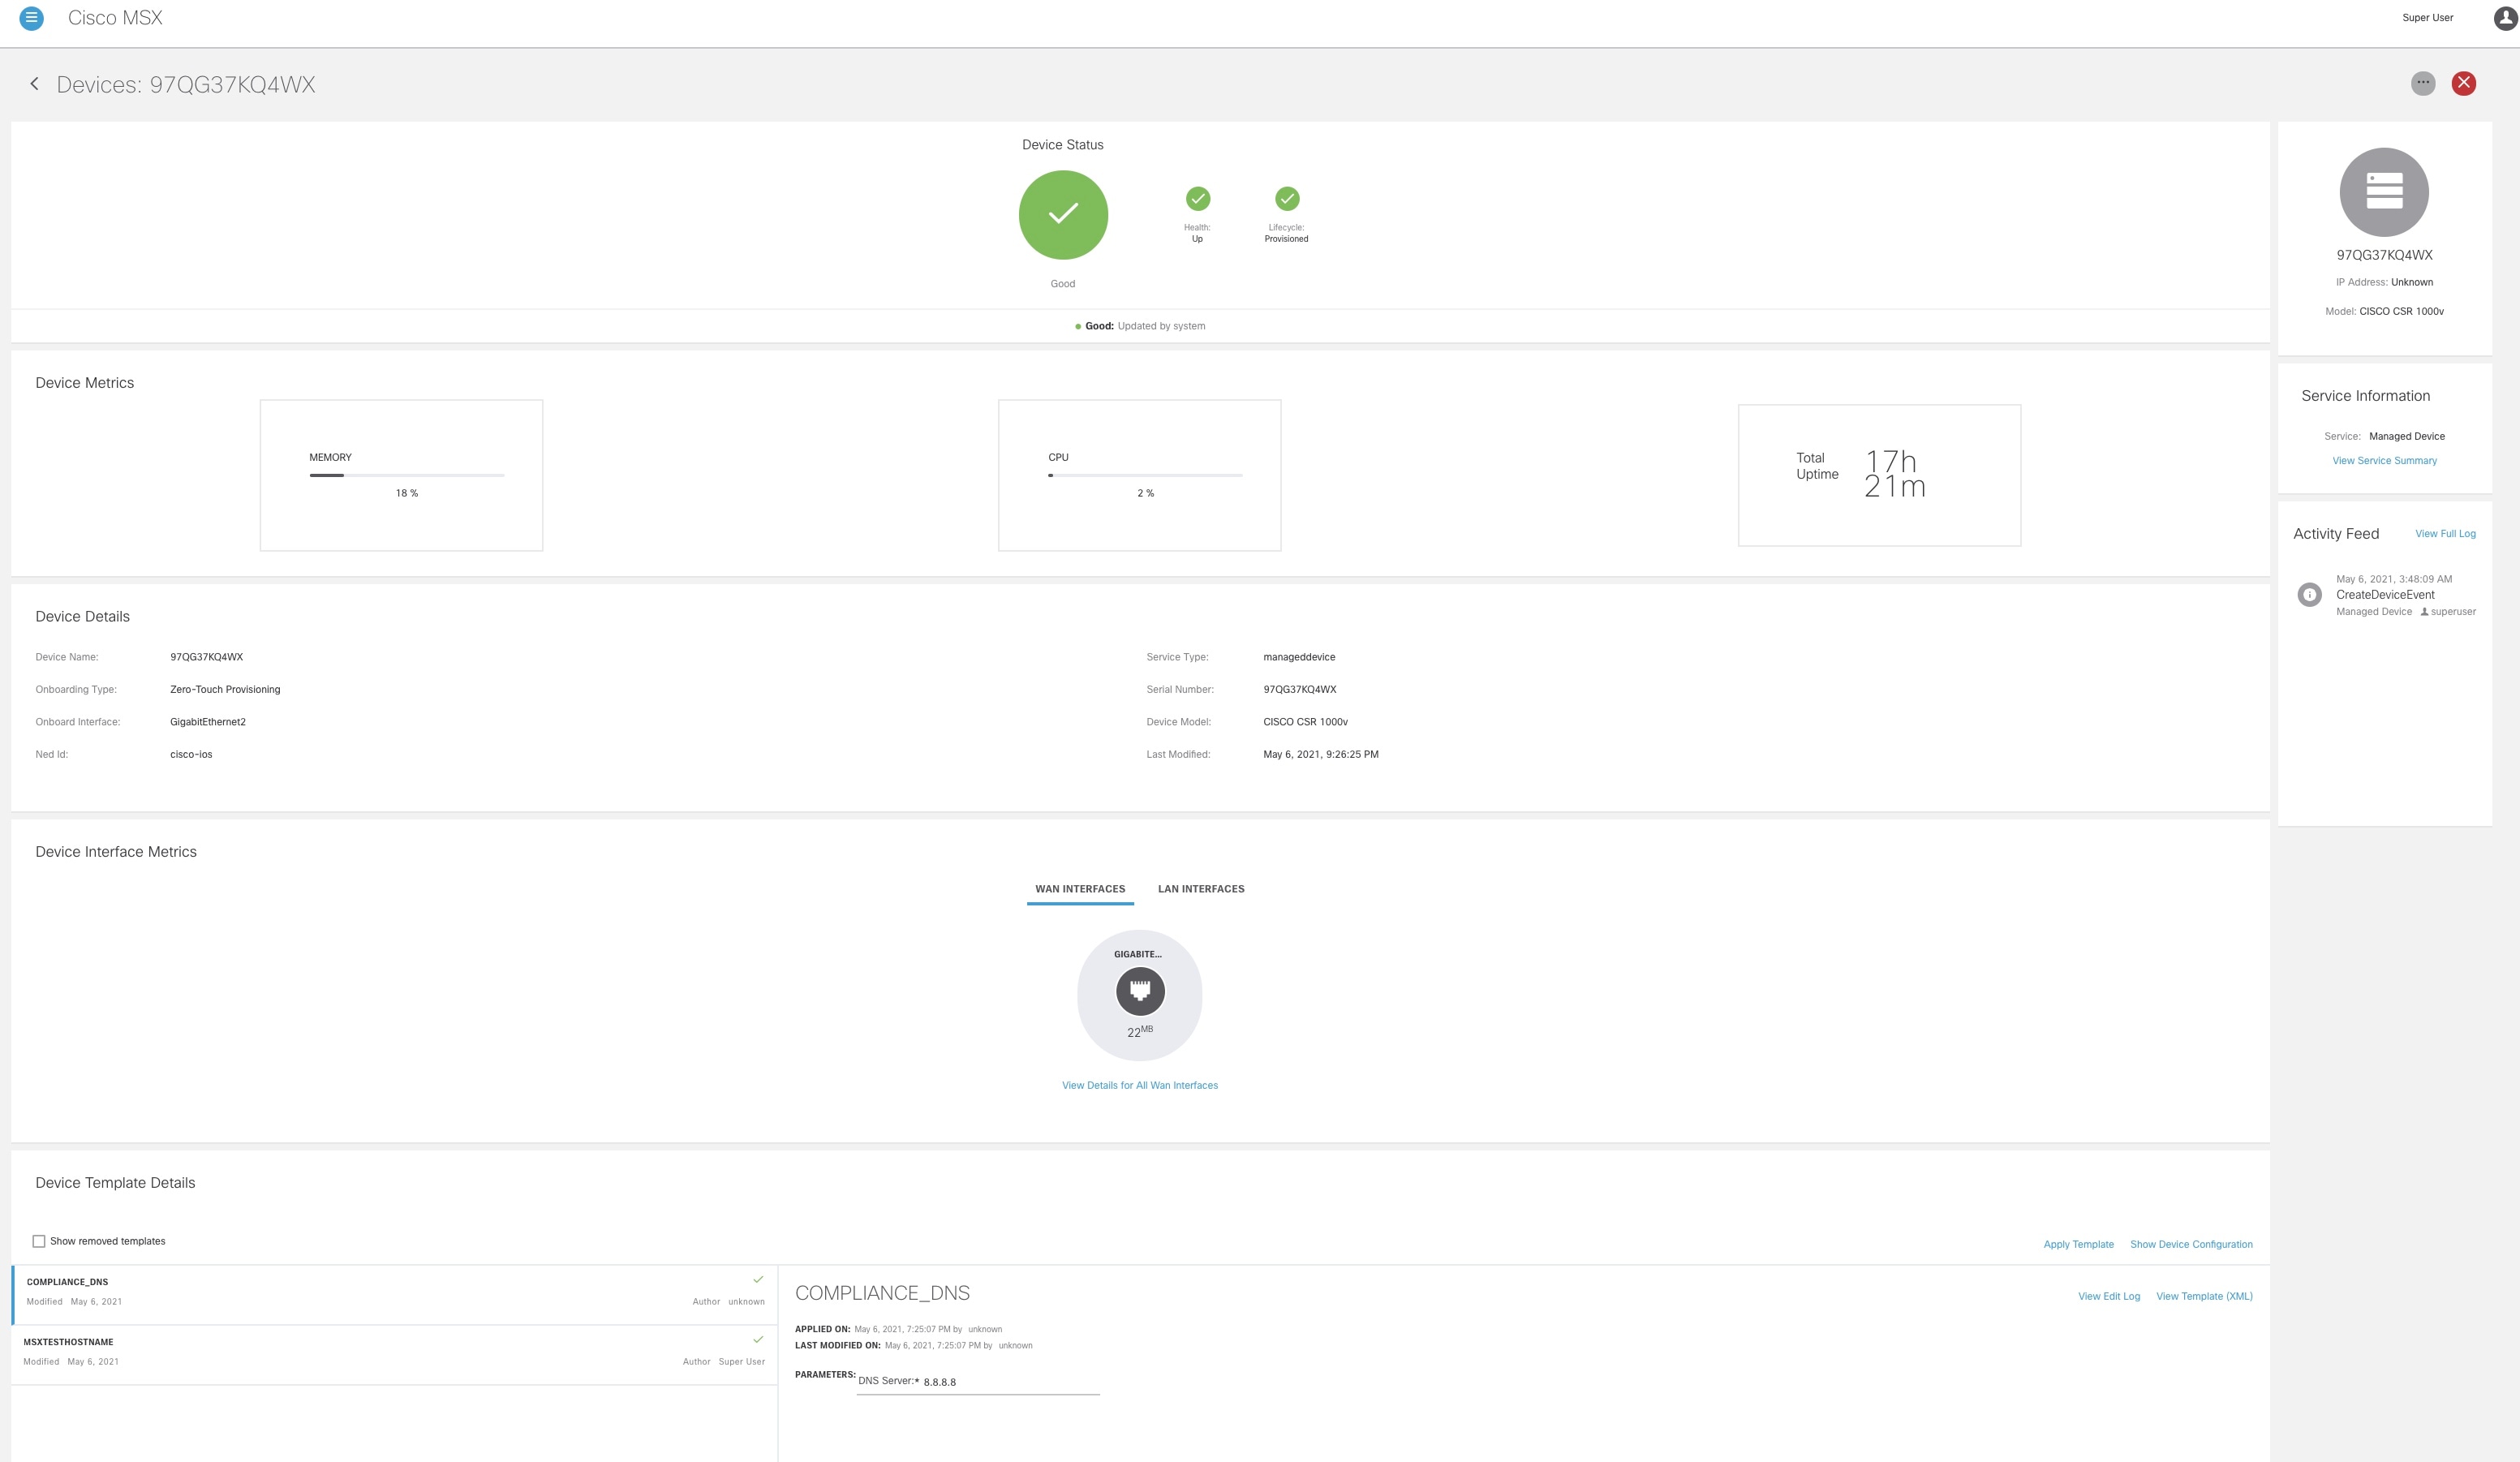
|
![]()
 Feedback