- Cisco Broadband Troubleshooter Release 3.3 User Guide Title
- Preface
- Product Overview
- Installing, Downloading, and Upgrading CBT 3.3
- Configuring the Cisco Broadband Troubleshooter
- Using the Spectrum Management Tools
- Administrative Tasks for CBT 3.3
- Troubleshooting CBT 3.3
- Sample Code for Application Program Interfaces
Cisco Broadband Troubleshooter Release 3.3 User Guide
Bias-Free Language
The documentation set for this product strives to use bias-free language. For the purposes of this documentation set, bias-free is defined as language that does not imply discrimination based on age, disability, gender, racial identity, ethnic identity, sexual orientation, socioeconomic status, and intersectionality. Exceptions may be present in the documentation due to language that is hardcoded in the user interfaces of the product software, language used based on RFP documentation, or language that is used by a referenced third-party product. Learn more about how Cisco is using Inclusive Language.
- Updated:
- June 28, 2007
Chapter: Using the Spectrum Management Tools
- Using the Trace Window
- Viewing Trace Windows
- Sorting Support in the CBT 3.3 Graphical User Interface
- Using Auto-Select in the Trace Window
- Using the Spectrogram
- Analyzing the Carrier-to-Noise Ratio
- Playing Back Data
- Playing Back a CNR Analysis
- Working with Spectrum Management Clients
- Enabling Instantaneous CPU Assessment for Spectrum Polling
Using the Spectrum Management Tools
CBT 3.3 interfaces with the Cisco CMTS to provide return path spectrum analysis, which is provided in the following tasks:
•![]() Trace Window—To monitor power and noise levels for a selected modem or upstream port
Trace Window—To monitor power and noise levels for a selected modem or upstream port
•![]() Spectrogram—To monitor power and noise levels over time for a selected modem or upstream port
Spectrogram—To monitor power and noise levels over time for a selected modem or upstream port
•![]() CNR Analysis—To retrieve the carrier-to-noise ratio (CNR) for selected modems or upstream ports
CNR Analysis—To retrieve the carrier-to-noise ratio (CNR) for selected modems or upstream ports
•![]() Data Playback—To review a saved Trace Window or CNR Analysis
Data Playback—To review a saved Trace Window or CNR Analysis
•![]() Clients—To get a list of each spectrum analysis in process on a client machine so you can:
Clients—To get a list of each spectrum analysis in process on a client machine so you can:
–![]() View summary information for the analysis
View summary information for the analysis
–![]() Launch a Trace Window or Spectrogram for the analysis
Launch a Trace Window or Spectrogram for the analysis
Each task is covered in the following sections:
•![]() Sorting Support in the CBT 3.3 Graphical User Interface, page 60
Sorting Support in the CBT 3.3 Graphical User Interface, page 60
•![]() Using Auto-Select in the Trace Window
Using Auto-Select in the Trace Window
•![]() Analyzing the Carrier-to-Noise Ratio
Analyzing the Carrier-to-Noise Ratio
•![]() Working with Spectrum Management Clients
Working with Spectrum Management Clients
•![]() Enabling Instantaneous CPU Assessment for Spectrum Polling
Enabling Instantaneous CPU Assessment for Spectrum Polling
Using the Trace Window
To monitor power and noise levels for a selected modem or upstream port, use the Trace Window. As shown in Figure 1, the Trace Window shows the output that you would see in a spectrum analyzer. This output displays in the plot line of the Trace Window.
Figure 1 Trace Window Display
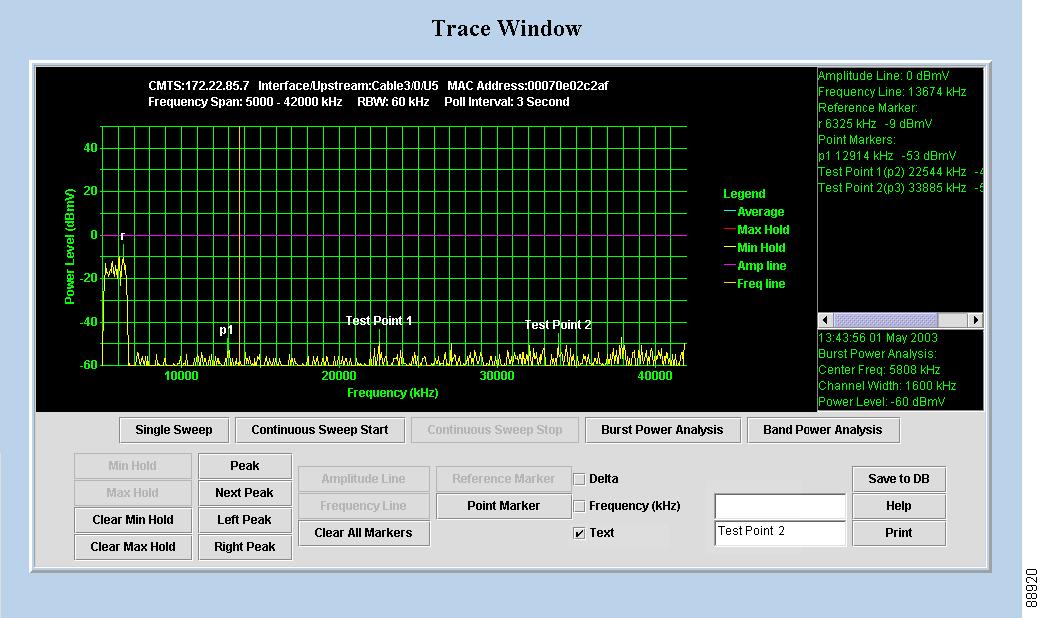
In the Trace Window, you can:
•![]() Monitor the power and noise levels two ways:
Monitor the power and noise levels two ways:
–![]() Single sweep—Provides a snapshot view of levels at one point in time, as shown in Figure 1
Single sweep—Provides a snapshot view of levels at one point in time, as shown in Figure 1
–![]() Continuous sweep—Provides a real-time view of data as it changes
Continuous sweep—Provides a real-time view of data as it changes
•![]() Check two types of power levels and display the data in the results block, which is in the lower right corner as shown in Figure 1:
Check two types of power levels and display the data in the results block, which is in the lower right corner as shown in Figure 1:
–![]() Burst power analysis—Acquires the upstream channel power
Burst power analysis—Acquires the upstream channel power
–![]() Band power analysis—Acquires the band power measurement for a start and stop frequency that you select
Band power analysis—Acquires the band power measurement for a start and stop frequency that you select
•![]() Indicate a variety of lines and points in the plot line and display the data in the annotations block, which is in the upper right corner, as shown in Figure 1
Indicate a variety of lines and points in the plot line and display the data in the annotations block, which is in the upper right corner, as shown in Figure 1
–![]() Reference marker—Is a unique marker in the plot line and is indicated by r, as shown in Figure 1
Reference marker—Is a unique marker in the plot line and is indicated by r, as shown in Figure 1
–![]() Point markers—Is a way to indicate one or more points in the plot line; each point marker is numbered consecutively beginning with p1, as shown in Figure 1
Point markers—Is a way to indicate one or more points in the plot line; each point marker is numbered consecutively beginning with p1, as shown in Figure 1
–![]() Amplitude and frequency lines—Display a line marker in the plot line, as shown by the horizontal amplitude line at 0 dBmV and the vertical frequency line just before 14000 kilohertz (kHz) in Figure 1
Amplitude and frequency lines—Display a line marker in the plot line, as shown by the horizontal amplitude line at 0 dBmV and the vertical frequency line just before 14000 kilohertz (kHz) in Figure 1
•![]() Show additional plot lines:
Show additional plot lines:
–![]() Minimum hold—Display the plot line that shows the minimum power level
Minimum hold—Display the plot line that shows the minimum power level
–![]() Maximum hold—Display the plot line that shows the maximum power level
Maximum hold—Display the plot line that shows the maximum power level
•![]() Move a marker that you created to peaks in the plot line:
Move a marker that you created to peaks in the plot line:
–![]() Peak
Peak
–![]() Next peak
Next peak
–![]() Left peak
Left peak
–![]() Right peak
Right peak
•![]() Customize the placement and position of point markers:
Customize the placement and position of point markers:
–![]() Text—You can customize a point marker's label by entering a name in the Text box. For example, you could change p1 to Test Point 1 and p2 to Test Point 2, as shown in Figure 1.
Text—You can customize a point marker's label by entering a name in the Text box. For example, you could change p1 to Test Point 1 and p2 to Test Point 2, as shown in Figure 1.
–![]() Frequency (kHz)—You can specify a frequency in kilohertz for the point marker by entering a number in the Frequency text box. For example, you could enter 20200 instead of clicking on the plot line near 20000.
Frequency (kHz)—You can specify a frequency in kilohertz for the point marker by entering a number in the Frequency text box. For example, you could enter 20200 instead of clicking on the plot line near 20000.
•![]() Show the delta between the reference marker's power level and that of each point marker.
Show the delta between the reference marker's power level and that of each point marker.
•![]() Zoom in on a selected frequency range to enlarge the view.
Zoom in on a selected frequency range to enlarge the view.
•![]() Save a single sweep of the plot line and play it back.
Save a single sweep of the plot line and play it back.
Working with the Trace Window
Table 1 shows several ways to work with data in the Trace Window.
Table 1
Keyboard Actions for Working with the Trace Window
Starting the Trace Window
Perform the following steps to use the Trace Window to monitor power and noise levels for a selected modem or upstream port:
Step 1 ![]() From the Spectrum Tools menu, choose Trace Window. The Trace Window Criteria dialog box appears, as shown in Figure 2.
From the Spectrum Tools menu, choose Trace Window. The Trace Window Criteria dialog box appears, as shown in Figure 2.
Step 2 ![]() Select an upstream or cable modem for which you want to monitor power and noise levels.
Select an upstream or cable modem for which you want to monitor power and noise levels.

Note ![]() To update the cable modem information on the selected CMTS instead of getting data from the cache, click Update CM Info. This real-time update varies according to how many modems are attached to the CMTS. If thousands of modems are attached to a CMTS, the update takes longer than if hundreds of modems are attached to the CMTS.
To update the cable modem information on the selected CMTS instead of getting data from the cache, click Update CM Info. This real-time update varies according to how many modems are attached to the CMTS. If thousands of modems are attached to a CMTS, the update takes longer than if hundreds of modems are attached to the CMTS.

Tip ![]() When you select the resolution bandwidth (RBW), keep in mind that the smaller the RBW, the less variance and the more accurate the frequency is in the Trace Window is. Specifically, when a single-tone signal that resembles a noise burst appears in the Trace Window, the frequency of the signal gets shifted. This causes the frequency in the Trace Window to be different from the spectrum analyzer output. The variance in frequency increases as the resolution bandwidth increases.
When you select the resolution bandwidth (RBW), keep in mind that the smaller the RBW, the less variance and the more accurate the frequency is in the Trace Window is. Specifically, when a single-tone signal that resembles a noise burst appears in the Trace Window, the frequency of the signal gets shifted. This causes the frequency in the Trace Window to be different from the spectrum analyzer output. The variance in frequency increases as the resolution bandwidth increases.
Step 3 ![]() Click Start. The Trace Window appears, as shown in Figure 1.
Click Start. The Trace Window appears, as shown in Figure 1.
Step 4 ![]() To view the return path data and activate all options in the Trace Window, click one of the following buttons:
To view the return path data and activate all options in the Trace Window, click one of the following buttons:
•![]() Single Sweep—Provides a single snapshot of power and noise levels
Single Sweep—Provides a single snapshot of power and noise levels
•![]() Continuous Sweep Start— Starts to monitor for real-time measurements of power and noise levels
Continuous Sweep Start— Starts to monitor for real-time measurements of power and noise levels
For a complete description of each field in these dialog boxes, click Help.
Figure 2 Trace Window Criteria Dialog Box

Viewing Trace Windows
Some browsers give the user the ability to stop windows from being launched by the browser. CBT 3.3 normally launches a new window to display the trace pop-up spectrum data charts. If the data chart window does not appear and the browser is configured to stop new windows from launching, you can configure CBT 3.3 to display data charts within the browser window.
Perform the following steps to configure CBT 3.3 to display data charts within the browser window:
Step 1 ![]() Select Configuration > System in the CBT 3.3 menu.
Select Configuration > System in the CBT 3.3 menu.
Step 2 ![]() In the System Configuration screen, uncheck the Use Popup check box.
In the System Configuration screen, uncheck the Use Popup check box.
Sorting Support in the CBT 3.3 Graphical User Interface
CBT 3.3 introduces sorting support for the List fields in the following GUI pages:
•![]() Spectrum Data Scheduler
Spectrum Data Scheduler
•![]() Trace Window Criteria
Trace Window Criteria
•![]() Spectrogram Criteria
Spectrogram Criteria
•![]() CNR Analysis Criteria
CNR Analysis Criteria
•![]() CNR Trending Criteria
CNR Trending Criteria
Perform the following steps to change the order of sorting:
Step 1 ![]() Select the desired desired page:
Select the desired desired page:
•![]() Configuration > Scheduler > Spectrum Data > Spectrum Data Scheduler
Configuration > Scheduler > Spectrum Data > Spectrum Data Scheduler
•![]() Spectrum Tools > Trace Window > Trace Window Criteria
Spectrum Tools > Trace Window > Trace Window Criteria
•![]() Spectrum Tools > Spectrogram > Spectrogram Criteria
Spectrum Tools > Spectrogram > Spectrogram Criteria
•![]() Spectrum Tools > CNR Analysis > CNR Analysis Criteria
Spectrum Tools > CNR Analysis > CNR Analysis Criteria
•![]() Spectrum Tools > CNR Trending > CNR Trending Criteria
Spectrum Tools > CNR Trending > CNR Trending Criteria
Step 2 ![]() Click on the label of the desired field, and data is sorted in ascending or descending order. Each click of the label reverses the current order displayed.
Click on the label of the desired field, and data is sorted in ascending or descending order. Each click of the label reverses the current order displayed.
Using Auto-Select in the Trace Window
CBT 3.3 does not select any given field in the Trace Window by default. To retrieve and display information for any given field in the Trace Window display, select the desired field.
Using the Spectrogram
To monitor power and noise levels, as you do in the Trace Window, while viewing the added dimension of time, use the Spectrogram. As shown in Figure 3, the Spectrogram shows the output that you would see in a spectrum analyzer.
Figure 3 Spectrogram
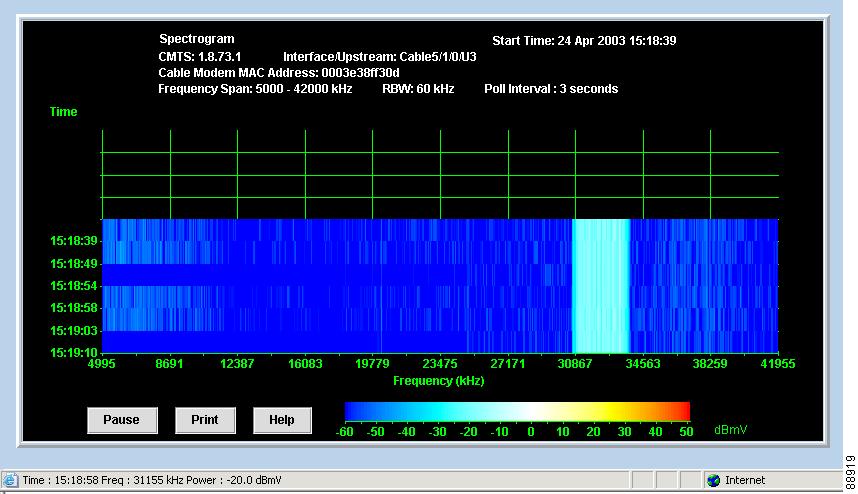
In the Spectrogram, you see the following variables in one easy, 3-D view:
•![]() Power level—Measured in decibels millivolt (dBmV) and depicted according to the color key at the bottom. As shown in Figure 3, the power level is cyan, which the color key indicates is in the -30 to -10 dBmV range.
Power level—Measured in decibels millivolt (dBmV) and depicted according to the color key at the bottom. As shown in Figure 3, the power level is cyan, which the color key indicates is in the -30 to -10 dBmV range.
•![]() Frequency—Measured in kilohertz and shown on the X axis. In Figure 3, the power level is between 30867 and 34563 kHz.
Frequency—Measured in kilohertz and shown on the X axis. In Figure 3, the power level is between 30867 and 34563 kHz.
•![]() Time—Measured in hours, minutes, and seconds (HH:MM:SS) and shown on the Y axis. Figure 3 shows the latest time that data was captured is 15:18:39.
Time—Measured in hours, minutes, and seconds (HH:MM:SS) and shown on the Y axis. Figure 3 shows the latest time that data was captured is 15:18:39.
When you move your cursor over the Spectrogram, the status bar at the bottom of the window displays the time, frequency, and power level for the current location. In the Spectrogram, you can click Pause or Print at anytime.
Starting the Spectrogram
Perform the following steps to use the Spectrogram to monitor power and noise levels for a selected modem or upstream port over time:
Step 1 ![]() From the Spectrum Tools menu, choose Spectrogram. The Spectrogram Criteria dialog box appears, as shown in Figure 4.
From the Spectrum Tools menu, choose Spectrogram. The Spectrogram Criteria dialog box appears, as shown in Figure 4.
Step 2 ![]() Select the Cisco CMTS, the interface, and an upstream or cable modem for which you want to monitor power and noise levels over time.
Select the Cisco CMTS, the interface, and an upstream or cable modem for which you want to monitor power and noise levels over time.
Note ![]() To update the cable modem information on the selected CMTS instead of getting data from the cache, click Update CM Info. This real-time update varies according to how many modems are attached to the CMTS. If thousands of modems are attached to a CMTS, the update takes longer than if hundreds of modems are attached to the CMTS.
To update the cable modem information on the selected CMTS instead of getting data from the cache, click Update CM Info. This real-time update varies according to how many modems are attached to the CMTS. If thousands of modems are attached to a CMTS, the update takes longer than if hundreds of modems are attached to the CMTS.
Step 3 ![]() Click Start. The Spectrogram appears, as shown in Figure 3.
Click Start. The Spectrogram appears, as shown in Figure 3.
For a complete description of each field in these dialog boxes, click Help.
Step 4 ![]() After completion of criteria selections, click Start, and the Spectrogram Criteria Confirmation dialog box appears. Click Yes to apply the changes.
After completion of criteria selections, click Start, and the Spectrogram Criteria Confirmation dialog box appears. Click Yes to apply the changes.
Figure 4 Spectrogram Criteria Dialog Box
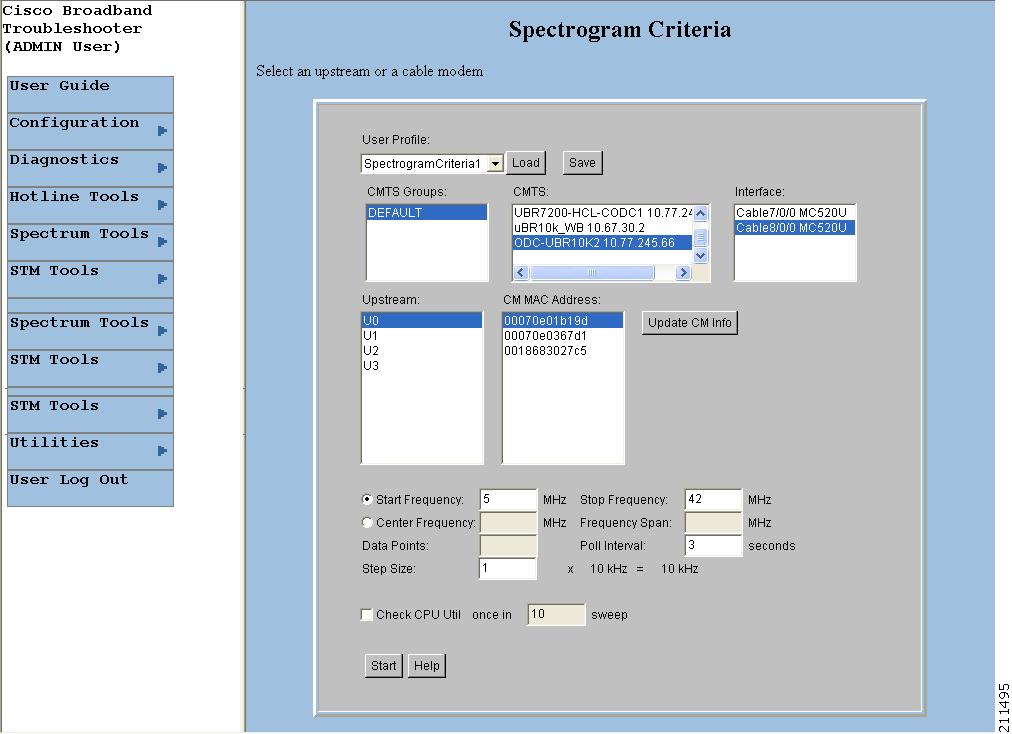
Figure 5 Spectrogram Criteria Confirmation Dialog Box

Analyzing the Carrier-to-Noise Ratio
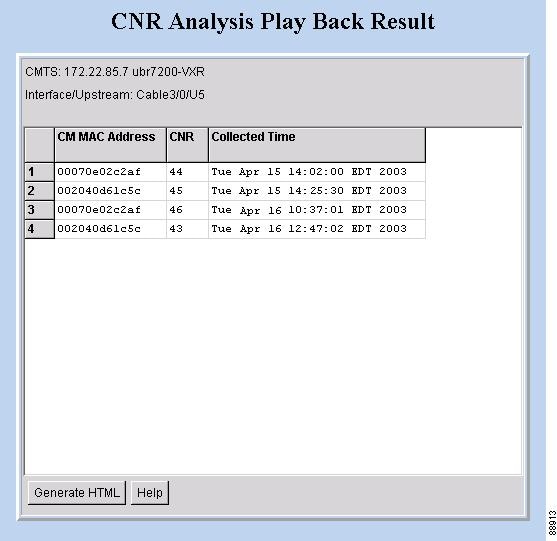
To show the carrier-to-noise ratio for selected cable modems or upstream ports, use the CNR Analysis task. As shown in Figure 6, this information displays in the CNR Analysis dialog box, which lets you:
•![]() View the following information:
View the following information:
–![]() CMTS and interface/upstream
CMTS and interface/upstream
–![]() CM MAC address
CM MAC address
–![]() Carrier-to-noise ratio
Carrier-to-noise ratio
–![]() Collected time
Collected time
•![]() Save the results to play back later.
Save the results to play back later.
Figure 6 CNR Analysis Dialog Box
You can set the following SPECTRUM.INI file parameters:
•![]() Set thresholds for acceptable carrier-to-noise ratios
Set thresholds for acceptable carrier-to-noise ratios
•![]() Specify colors for CNRs that are below two thresholds, floor and ceiling
Specify colors for CNRs that are below two thresholds, floor and ceiling
In Figure 6, the CNRs for the selected modems fall into three categories:
•![]() Yellow—The CNR is below the ceiling threshold.
Yellow—The CNR is below the ceiling threshold.
•![]() Red—The CNR is below the floor threshold.
Red—The CNR is below the floor threshold.
•![]() White—The CNR is above the ceiling threshold.
White—The CNR is above the ceiling threshold.
For more information on the SPECTRUM.INI file, see the "Parameters in the SPECTRUM.INI File" section on page 32.
Getting the CNR Analysis
Perform the following steps to show the carrier-to-noise ratio for selected cable modems or upstream ports:
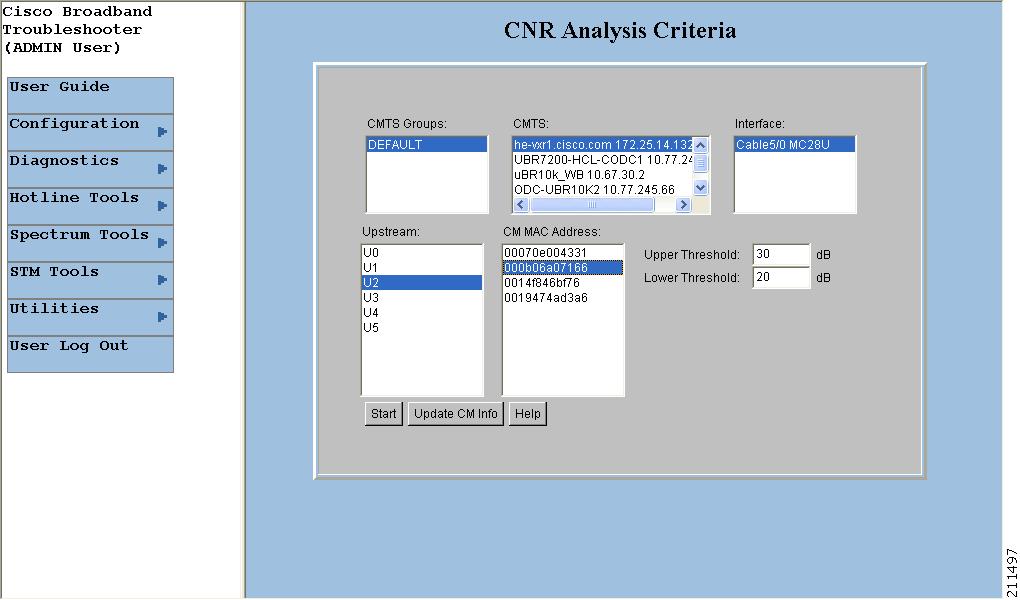
Step 1 ![]() From the Spectrum Tools menu, choose CNR Analysis. The CNR Analysis Criteria dialog box appears, as shown in Figure 7.
From the Spectrum Tools menu, choose CNR Analysis. The CNR Analysis Criteria dialog box appears, as shown in Figure 7.
Step 2 ![]() Select one or more upstreams or cable modems for which you want to see the carrier-to-noise ratio.
Select one or more upstreams or cable modems for which you want to see the carrier-to-noise ratio.
Note ![]() To update the cable modem information on the selected CMTS instead of getting data from the cache, click Update CM Info. This real-time update varies according to how many modems are attached to the CMTS. If thousands of modems are attached to a CMTS, the update takes longer than if hundreds of modems are attached to the CMTS.
To update the cable modem information on the selected CMTS instead of getting data from the cache, click Update CM Info. This real-time update varies according to how many modems are attached to the CMTS. If thousands of modems are attached to a CMTS, the update takes longer than if hundreds of modems are attached to the CMTS.
Tip ![]() You specify an upper and lower threshold for carrier-to-noise ratios in the CNRCeiling and CNRFloor parameters of the SPECTRUM.INI file. If you want to specify different thresholds on an analysis-by-analysis basis, you can do that in the Upper Threshold and Lower Threshold fields. For more information on thresholds, see the "Parameters in the SPECTRUM.INI File" section on page 32.
You specify an upper and lower threshold for carrier-to-noise ratios in the CNRCeiling and CNRFloor parameters of the SPECTRUM.INI file. If you want to specify different thresholds on an analysis-by-analysis basis, you can do that in the Upper Threshold and Lower Threshold fields. For more information on thresholds, see the "Parameters in the SPECTRUM.INI File" section on page 32.
Step 3 ![]() Click Start. The CNR Analysis dialog box appears, as shown in Figure 6.
Click Start. The CNR Analysis dialog box appears, as shown in Figure 6.
For a complete description of each field in these dialog boxes, click Help.
Figure 7 CNR Analysis Criteria Dialog Box
Playing Back Data
You can play back a saved Trace Window or CNR Analysis. This allows you to capture and preserve troubleshooting information and use it later.
Playing Back a Trace Window
Perform the following steps to play back a Trace Window:
Step 1 ![]() From the Spectrum Tools menu, choose Data Playback > Trace Window. The Trace Window Playback Criteria dialog box appears, as shown in Figure 8. Otherwise, Figure 9 shows an alternate view of this dialog box, with additional information displayed for illustrative purpose.
From the Spectrum Tools menu, choose Data Playback > Trace Window. The Trace Window Playback Criteria dialog box appears, as shown in Figure 8. Otherwise, Figure 9 shows an alternate view of this dialog box, with additional information displayed for illustrative purpose.
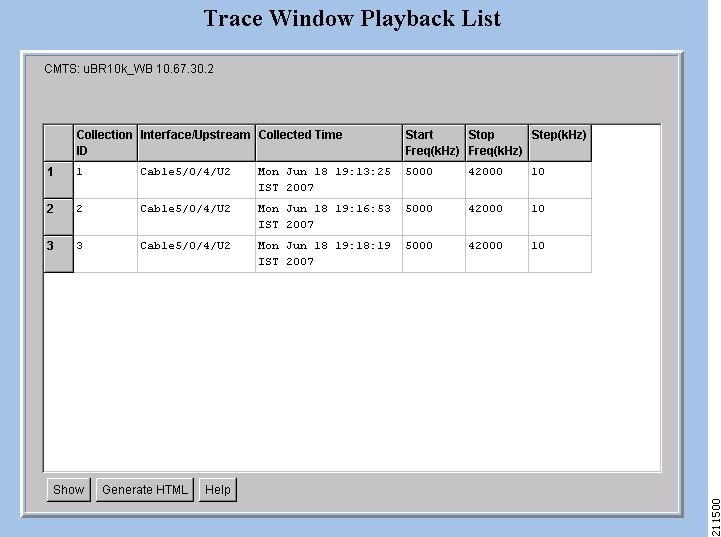
Step 2 ![]() Select one or more MAC addresses for which you want to see a list of saved traces and click Start. The Trace Window Playback List dialog box appears, as shown in Figure 10.
Select one or more MAC addresses for which you want to see a list of saved traces and click Start. The Trace Window Playback List dialog box appears, as shown in Figure 10.
Step 3 ![]() From the list of saved traces, select the one you want to play back and click Show. The Trace Window for the saved trace, as shown in Figure 1, appears.
From the list of saved traces, select the one you want to play back and click Show. The Trace Window for the saved trace, as shown in Figure 1, appears.
Note ![]() To remove a saved Trace Window from the database, from the Utilities menu, choose Purge Saved Data, Spectrum Data.
To remove a saved Trace Window from the database, from the Utilities menu, choose Purge Saved Data, Spectrum Data.
For a complete description of each field in these dialog boxes, click Help.
Figure 8 Trace Window Playback Criteria Dialog Box
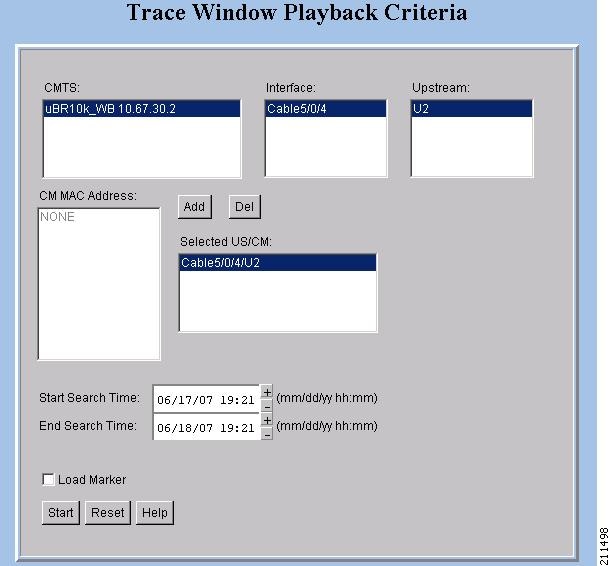
Figure 9 Trace Window Playback Criteria Dialog Box, Alternate View
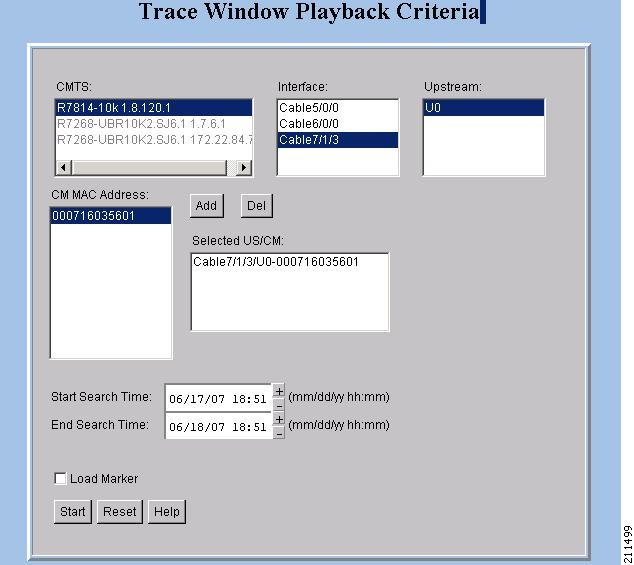
Figure 10 Trace Window Playback List Dialog Box
Playing Back a CNR Analysis
Perform the following steps to play back a CNR Analysis:
Step 1 ![]() From the Spectrum Tools menu, choose Data Playback > CNR Analysis. The CNR Analysis Playback Criteria dialog box appears, as shown in Figure 11.
From the Spectrum Tools menu, choose Data Playback > CNR Analysis. The CNR Analysis Playback Criteria dialog box appears, as shown in Figure 11.
Step 2 ![]() To select one or more MAC addresses for which you want to see a saved CNR Analysis, click Start. The CNR Analysis Playback Result dialog box appears, as shown in Figure 12.
To select one or more MAC addresses for which you want to see a saved CNR Analysis, click Start. The CNR Analysis Playback Result dialog box appears, as shown in Figure 12.
Note ![]() To remove a saved CNR Analysis from the database, from the Utilities menu, choose Purge Saved Data, Spectrum Data.
To remove a saved CNR Analysis from the database, from the Utilities menu, choose Purge Saved Data, Spectrum Data.
For a complete description of each field in these dialog boxes, click Help.
Figure 11 CNR Analysis Playback Criteria Dialog Box
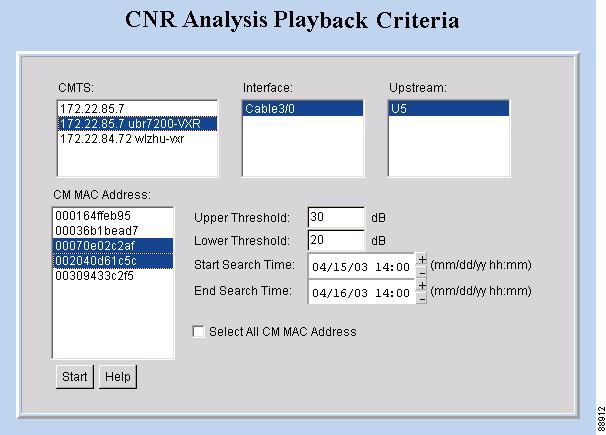
Figure 12 CNR Analysis Playback Result Dialog Box
Working with Spectrum Management Clients
To see a list of clients that are currently using CBT spectrum management tools, use the Clients task option of the Trace Window or Spectrogram dialog boxes. The Clients task feature is an effective tool that optimizes the CBT diagnostic capabilities by listing all in-process spectrum analyses in one place. By using the Clients task tool, technicians can troubleshoot collaboratively because multiple technicians can simultaneously perform the following:
•![]() View the same summary information for all spectrum analyses that are in process
View the same summary information for all spectrum analyses that are in process
•![]() Launch a Trace Window or Spectrogram to monitor a spectrum analysis from that tool
Launch a Trace Window or Spectrogram to monitor a spectrum analysis from that tool
When you choose the Clients task, the Spectrum Data Clients dialog box appears. See Figure 13.
Figure 13 Spectrum Data Clients Dialog Box
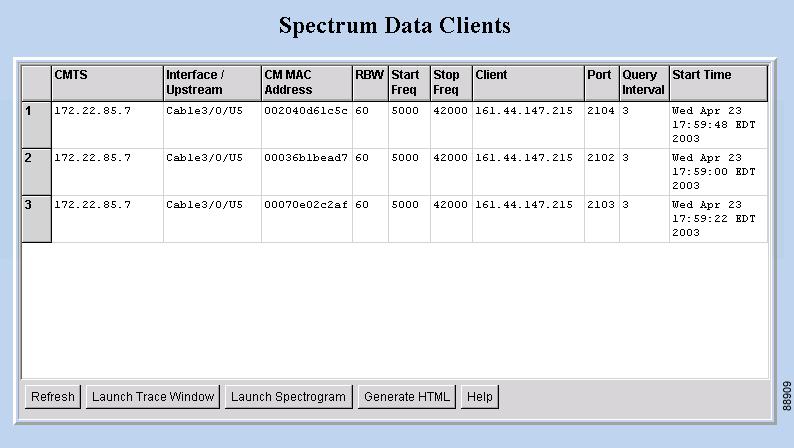
Using the Clients Task
In the Spectrum Data Clients dialog box, each row represents a spectrum analysis in process on a client machine. For each spectrum analysis in the list, you can:
•![]() See the following summary information:
See the following summary information:
–![]() CMTS
CMTS
–![]() Interface/Upstream
Interface/Upstream
–![]() Cable modem MAC address
Cable modem MAC address
–![]() Resolution bandwidth
Resolution bandwidth
–![]() Start frequency
Start frequency
–![]() Stop frequency
Stop frequency
–![]() Client
Client
–![]() Port
Port
–![]() Query interval
Query interval
–![]() Start time
Start time
•![]() Launch a Trace Window or Spectrogram
Launch a Trace Window or Spectrogram
As you work in the Spectrum Data Clients dialog box, you can click Refresh to update the information or Generate HTML to capture the information in a format that can be distributed easily outside of Cisco Broadband Troubleshooter. For example, you could send it as an attachment in a trouble-ticket system or email application.
Perform the following steps to see a list of spectrum analyses in process on client machines:
Step 1 ![]() From the Spectrum Tools menu, choose Clients. The Spectrum Data Clients dialog box, as shown in Figure 13, appears.
From the Spectrum Tools menu, choose Clients. The Spectrum Data Clients dialog box, as shown in Figure 13, appears.
Tip ![]() There can be limits on how many clients can use the spectrum management tools at one time. If you cannot access a spectrum management tool, such as the Trace Window, you can use the Clients task to see how many spectrum analyses are in process.
There can be limits on how many clients can use the spectrum management tools at one time. If you cannot access a spectrum management tool, such as the Trace Window, you can use the Clients task to see how many spectrum analyses are in process.
For a complete description of each field in the Spectrum Data Clients dialog box, click Help.
Enabling Instantaneous CPU Assessment for Spectrum Polling
CBT 3.3 enables the option of preventing excessive CPU consumption, in circumstances in which the Trace Window, Spectrogram functions, or Scheduled Polling features might otherwise exceed CPU bandwidth.
CBT has provisions to instantaneously check the CPU utilization and prevents the spectrum operation if the CPU utilization exceeds the CPU thresholds (value of SpecDataMaxCPU parameter).
Perform these steps to enable or disable CPU assessment in the Trace Window Criteria dialog box, the Spectrogram Criteria dialog box, or the Spectrum Data Scheduler dialog box before launching the spectrum event.
Step 1 ![]() Launch CBT 3.3.
Launch CBT 3.3.
Step 2 ![]() Log in as admin.
Log in as admin.
Step 3 ![]() Launch the desired window in which to configure this change.
Launch the desired window in which to configure this change.
•![]() For Trace Window changes, from the Spectrum Tools menu, choose Trace Window. The Trace Window Criteria dialog box appears. Proceed to the next step.
For Trace Window changes, from the Spectrum Tools menu, choose Trace Window. The Trace Window Criteria dialog box appears. Proceed to the next step.
•![]() For Spectrogram changes, from the Spectrum Tools menu, choose Spectrogram. The Spectrogram Criteria dialog box appears. Proceed to the next step.
For Spectrogram changes, from the Spectrum Tools menu, choose Spectrogram. The Spectrogram Criteria dialog box appears. Proceed to the next step.
•![]() For Spectrum Data Scheduler changes, from the Spectrum Tools menu, choose Spectrum Data Clients. The Spectrum Data Clients dialog box appears. Proceed to the next step.
For Spectrum Data Scheduler changes, from the Spectrum Tools menu, choose Spectrum Data Clients. The Spectrum Data Clients dialog box appears. Proceed to the next step.
Step 4 ![]() Select the checkbox Check CPU Util. This setting defines the number of sweeps for every CPU utilization check. Only when the check box is selected is the text box enabled to enter the number of spectrum sweeps that should be done for every CPU utilization check. If periodic check of CPU utilization is not necessary, then deselect this option and proceed. If not selected, the CPU utilization is checked only once before the launch of the spectrum operation. Refer to Figure 14.
Select the checkbox Check CPU Util. This setting defines the number of sweeps for every CPU utilization check. Only when the check box is selected is the text box enabled to enter the number of spectrum sweeps that should be done for every CPU utilization check. If periodic check of CPU utilization is not necessary, then deselect this option and proceed. If not selected, the CPU utilization is checked only once before the launch of the spectrum operation. Refer to Figure 14.
Figure 14
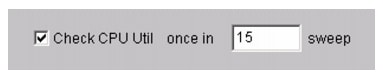
Check CPU Util Dialog Box
Step 5 ![]() When the Check CPU Util check box is selected, enter the number of sweeps in which CPU utilization should be checked. The default value is 10.
When the Check CPU Util check box is selected, enter the number of sweeps in which CPU utilization should be checked. The default value is 10.
This setting means that the CPU utilization is checked and compared with the SpecDataMaxCPU parameter. Upon positive results, the spectrum operation gets started. The spectrum data is collected continuously with the specified poll interval.
One sweep corresponds to a single polling of spectrum data. After 10 such polling events, CBT again checks the CPU Utilization and compares it with the SpecDataMaxCPU parameter. If the results are positive, the spectrum operation continues; otherwise, the continuous query is stopped. If the number of sweeps is 1, then the CPU utilization is checked before every polling of spectrum data.
Step 6 ![]() Continue with the launch of the spectrum operation.
Continue with the launch of the spectrum operation.
 Feedback