System Requirements

Prerequisites

  • Install sshpass before executing the script file.

    • On Debian/Ubuntu and its derivatives:

      • sudo apt-get install sshpass

    • In RedHat/CentOS based systems:

      • yum install sshpass

      • dnf install sshpass [On Fedora 22+ versions]

  • RAM requirement: 4 GiB

  • CPU requirement: 4 CPUs

  • Storage Class free space requirement: Minimum of 40 GB. I
Configuring HX Profiler for Kubernetes Environments

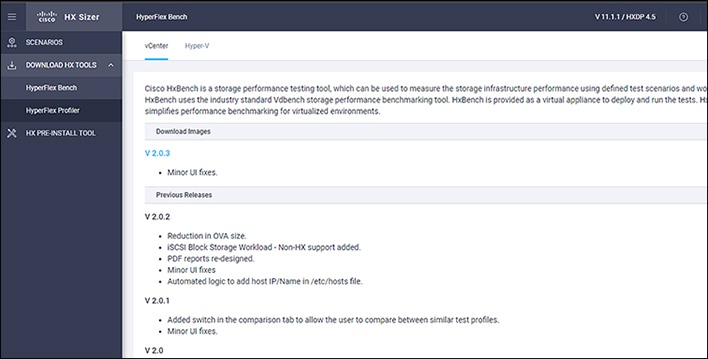
  1. Download the Cisco-Profiler-2.1-CSI.tar file from https://hyperflexsizer.cloudapps.cisco.com.

    • DOWNLOAD HX TOOLS > HyperFlex Profiler > Kubernetes

  2. Untar Cisco-HxProfiler-CSI-4.1.tar.gz with tar -zxf Cisco-HxProfiler-CSI-4.1.tar.gz.

  3. Run the cd Cisco-HxProfiler-CSI-4.1/Script_files to access the directory Script_files

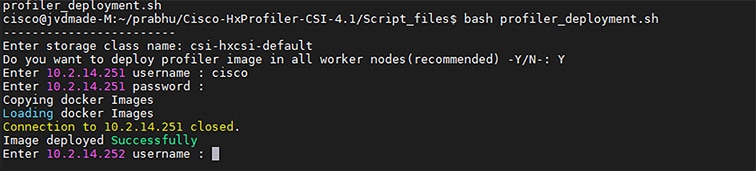
  4. Run the bash profiler_deployment.sh script to execute the script.

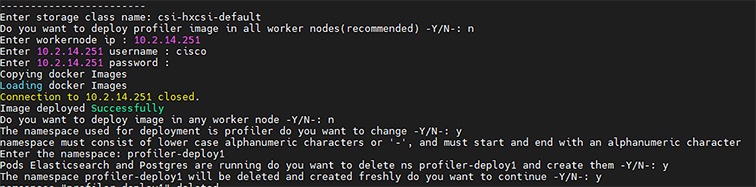
  5. When prompted, type your storage class name and press the enter button.


    Note

    If you enter wrong storage class name, you will see an error response. If you enter wrong storage name 3 times, the deployment process ends and returns you to the config prompt. Return to step 1 and restart the process.


  6. Deploy profiler image in worker nodes: Answer the "Do you want to deploy profiler image in all worker nodes (Recommended) Y/N:" question.

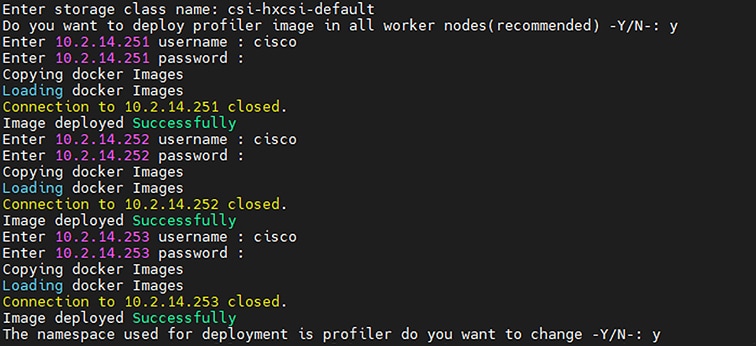
    • If you want to deploy the profiler to all worker nodes, type Y and press the Enter button and return to Step 8a.

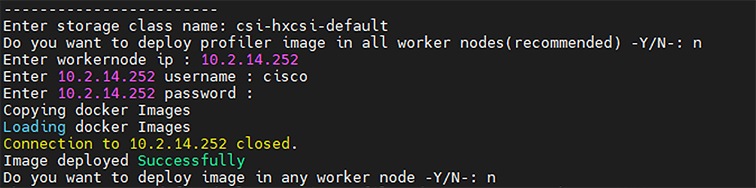
    • If you do not want to deploy image in all worker nodes, type N and press the Enter button and skip to Step 9.

    1. When prompted, type the worker node username and password and press the Enter button. Make sure that you receive the Image deployed successfully message.

    2. Repeat step 8a to deploy the image in all worker nodes.

  7. If you do not want to deploy image in all worker nodes, then type N and press the Enter button. Type IP, username and password of the worker node if you want to deploy image in any specific node.

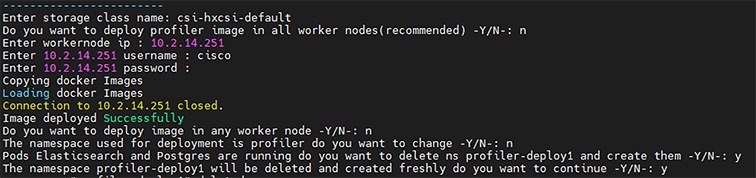
  8. Deployment Namespace: The default namespace used for deployment is profiler.

    In the provided namespace, it will check if Elasticsearch and postgres pods deployed in the namespace, if yes:

    • Delete the entire namespace and deploy fresh namespace, continue to step 11.

    1. If you want to delete and create a new then type Y and press the enter button. The default profiler namespace is deleted, and the new namespace named profiler is created, type Y and press the enter button to confirm the action.

    2. If you want to deploy in any other namespace type Y and type the desired namespace.

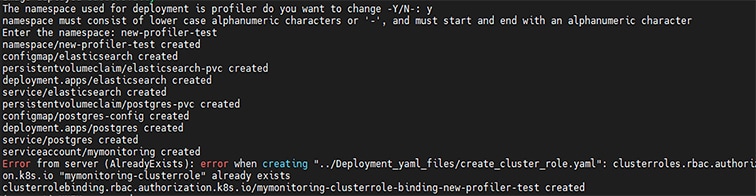
  9. Enter the new namespace name and press the Enter button.


    Note

    Namespace name requirements: lower case alphanumeric characters and "-" (dash). The name must start and end with an alphanumeric character.


    Deployment of Elasticsearch and Postgres yaml file in all nodes are created.

  10. At the prompt for the current UNIX password, type the password for the appadmin GUI account (default password is password) and press the Enter button.

  11. At the prompt for the new UNIX password, type your new user defined password and press the Enter button.

  12. At the prompt to retype your new UNIX password, type your new password and press the Enter button. Now deployment of profiler will be created.

  13. The result is the final profiler-ip with the port number. Copy the IP address and paste it in the browser to fetch the UI

Using the Profiler Service

The HX Workload Profiler start and stop services use the profiler_service.sh command.

The following table shows the high-level steps for using the profile service.

Task

See

Starting the Profiler Service

Starting the Profiler Service

Stopping the Profiler Service

Stopping the Profiler Service

Logging in to the Profiler

The HX Workload Profiler user interface (UI) uses system credentials for authentication.

Procedure


Step 1

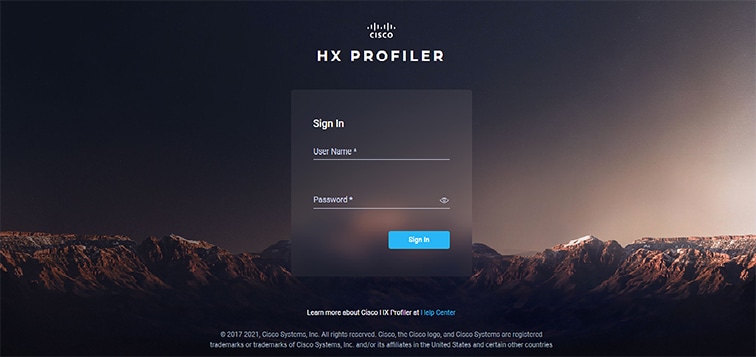
To access the UI, launch a browser window and enter http://< IP:PORT_NUMBER > or http://< IP:PORT_NUMBER > or http://< IP:PORT_NUMBER >/profiler/index.html or http://< IP:PORT_NUMBER >/profiler/index.html, where the IP:PORT_NUMBER is the output of deployment script.

The HX Profiler UI appears:

Step 2

When prompted, log in to the UI with the following credentials:

User name: monitoring

Password: <new password set during the deployment workflow>

Step 3

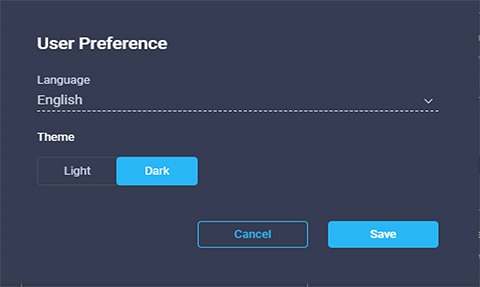
You can use the User Preference option in the top right corner of the UI to configure Language or Theme.

Click Cancel or Save to continue.

Step 4

When finished, you can end the user session by clicking Logout at the top right of the page.


Starting the Profiler Service

To start the profiler service run the below commands inside profiler pod:

Procedure


Run the following command: sh podscript.sh.


Stopping the Profiler Service

Complete the following steps inside profiler pod to stop the profiler service:

Procedure


Step 1

Run the following command: cd profiler_scripts/.

Step 2

Run the following command: sudo sh profiler_service.sh stop.


Locating the Kubernetes Application Logs

You can find HX Workload Profiler logs in the following locations:

Table 1. Application Logs

Log

Path

Server

/home/monitoring/monitor/server.log

Controller

/home/monitoring/controller/logs/*

Monitor

/home/monitoring/monitor/monitor/monitor.log