Identifying SAN Congestion Victims with Cisco MDS RxWait Counter
Available Languages
Bias-Free Language
The documentation set for this product strives to use bias-free language. For the purposes of this documentation set, bias-free is defined as language that does not imply discrimination based on age, disability, gender, racial identity, ethnic identity, sexual orientation, socioeconomic status, and intersectionality. Exceptions may be present in the documentation due to language that is hardcoded in the user interfaces of the product software, language used based on RFP documentation, or language that is used by a referenced third-party product. Learn more about how Cisco is using Inclusive Language.
- US/Canada 800-553-2447
- Worldwide Support Phone Numbers
- All Tools
 Feedback
 Feedback
Introduction
Efficient monitoring plays a pivotal role in storage networking solutions and overall IT infrastructure. While provisioning and zoning configurations are essential, continuous monitoring is vital to ensure service level agreements are met. With the rise of highly responsive storage systems, congestion monitoring has become increasingly important. This article explores the significance of congestion monitoring and highlights the role of the Cisco MDS 9000 series of Fibre Channel switches in identifying congestion scenarios using the popular TxWait and the new RxWait counters.

Storage network congestion occurrences are more frequent than in the past. This is partially due to a wide mix of switches and end nodes with different port speeds and capabilities. When a host issues a read operation, all-flash arrays respond in less than a millisecond. This may flood the network with a large quantity of data over a short period of time, saturating link bandwidth and switch port buffers. Eventually this may cause congestion and application performance degradation. This is why congestion monitoring and congestion avoidance tools make the difference between a highly performing SAN and a problematic SAN.
Cisco MDS 9000 switches were early adopters of ASIC-level counters and accompanying software tools to detect and gauge congestion severity. The initial hardware counters, such as transitions to zero for the Buffer to Buffer (B2B) receive or transmit credits, were insufficient. On the other end, software counters were too course to really identify congestion reliably. The need for something better was apparent.
With the intent to address congestion more accurately and promptly, Cisco introduced the TxWait counter back in 2015. When a port experiences Tx B2B credit unavailability for 2.5 microseconds while having frames to transmit, the TxWait counter increments by one. This indicates egress congestion because the port on the other side of the link is unable to accept frames. The TxWait counter is enabled by default on all Cisco MDS switches since NX-OS release 6.2(13).
To enhance congestion monitoring capabilities, the latest Cisco MDS 9000 64G module and switches now feature an additional ASIC-level counter called RxWait. This industry unique innovation raises the bar for congestion handling within a SAN. It is enabled by default on Cisco MDS 64G switches since NX-OS release 9.3(2). While supported only on 64G capable switch ports, the operational port speed can be lower. Similar to TxWait, the RxWait counter increments when a switch port faces Rx B2B credit unavailability, preventing it from receiving a frame for 2.5 microseconds. In other words, all of the ingress switch port buffers are occupied, and no more frames can be accepted. From the switch's perspective, the RxWait counter signifies congestion has spread, resulting in ingress congestion. Like TxWait, RxWait is displayed in a variety of ways allowing both real time troubleshooting and historical investigation of congestion problems.
Differentiating RxWait on E_Ports and F_Ports
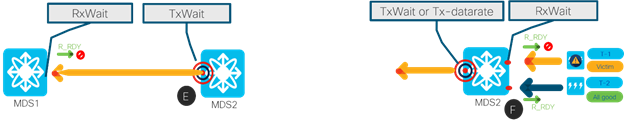
The RxWait counter is suitable for monitoring different port types. On E_ports (ISLs), the RxWait counter helps confirm the indications of the TxWait counter and aids in identifying corner cases, such as corrupted or lost R_RDY primitives. In fact, when R_RDY messages from the frame receiver do not reach the transmitter, RxWait and TxWait counters stop being aligned.
But there is more. Using the RxWait counter on ISLs, we can now detect a severe egress congestion happening on an F_port. If there is a high TxWait value on an F_port and also some significant RxWait on any of the E_ports of the same switch, then the F_port congestion can be classified as severe since it has percolated to the ISL and possibly to the rest of the fabric. All this investigation only requires examining counters on a single switch, due to the fact RxWait on ISL port reflects TxWait of peer switch into the local switch.
However, for the RxWait counter, the most value is realized when analyzing F_ports (end node ports). In such cases, it becomes possible to correlate TxWait and RxWait counters to determine if the congestion has spread from the device causing the congestion (the culprit) to the devices communicating with the culprit (the victims). By examining the RxWait counter, it becomes clear which end nodes are affected by congestion, allowing for the differentiation between true victims and potential victims. If there is no RxWait, the end device has not been slowed down and is not affected by whatever congestion exists in the fabric. This distinction is valuable in both single-switch and multi-switch topologies.
Displaying and Interpreting RxWait
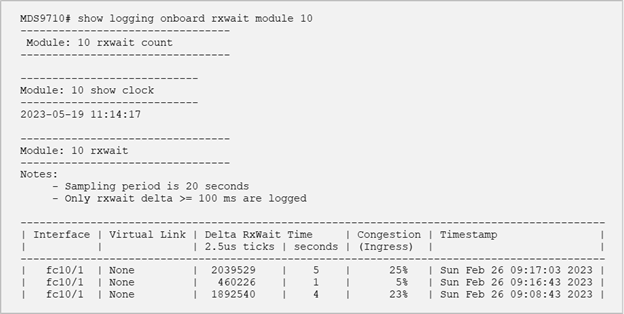
The NX-OS text-based CLI provides the ability to view the value of the RxWait (and also TxWait) counter on a switch port in several different ways. Specifically, it tracks the average RxWait over different time periods of 1 second, 1 minute, 1 hour, and 72 hours. It also persistently records RxWait values in 20 second intervals in a time and date stamped log called On-Board Failure Logging (OBFL). Consider this log as a sort of time machine, facilitating troubleshooting of past events.
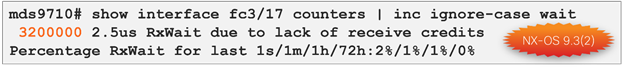
The calculated percentage information is quite important. It gives an overall view of the amount of ingress congestion seen on the switch port over the last 72 hours. For troubleshooting purposes, the calculated percentage of RxWait holds more significance than the absolute value of the counter. When congestion is severe, the percentage of RxWait over a 1-second period will be high.
Sample show interface RxWait example:
Sample RxWait OBFL example:
Today, TxWait and RxWait counters, together with other metrics, represent an accurate data source for modern congestion monitoring tools. Businesses can proactively identify bottlenecks, optimize bandwidth utilization and prevent performance degradation, resulting in enhanced user experience and increased productivity.
In response to the growing demand for congestion monitoring, Cisco MDS 9000 Fibre Channel switches now offer the capability to differentiate between true and potential congestion victims. With the inclusion of the RxWait counter in 64G modules and switches and NX-OS 9.3(2) release, congestion identification has become more accurate, even in complex scenarios. The simplicity and precision of this innovative approach, coupled with the comprehensive monitoring suite of MDS 9000 switches, deliver significant value that storage administrators should not overlook.
Slow-Drain Device Detection, Troubleshooting, and Automatic Recovery
Detecting, Troubleshooting, and Preventing Congestion in Storage Networks
Configuring Congestion Detection
Congestion: SAN compared to a highway system
Cisco and the Cisco logo are trademarks or registered trademarks of Cisco and/or its affiliates in the U.S. and other countries. To view a list of Cisco trademarks, go to this URL: www.cisco.com/go/trademarks. Third-party trademarks mentioned are the property of their respective owners. The use of the word partner does not imply a partnership relationship between Cisco and any other company. (1721R)
Any Internet Protocol (IP) addresses and phone numbers used in this document are not intended to be actual addresses and phone numbers. Any examples, command display output, network topology diagrams, and other figures included in the document are shown for illustrative purposes only. Any use of actual IP addresses or phone numbers in illustrative content is unintentional and coincidental.
© 2023 Cisco Systems, Inc. All rights reserved.