Cisco Modeling Labs Corporate Edition User Guide, Release 1.1
Bias-Free Language
The documentation set for this product strives to use bias-free language. For the purposes of this documentation set, bias-free is defined as language that does not imply discrimination based on age, disability, gender, racial identity, ethnic identity, sexual orientation, socioeconomic status, and intersectionality. Exceptions may be present in the documentation due to language that is hardcoded in the user interfaces of the product software, language used based on RFP documentation, or language that is used by a referenced third-party product. Learn more about how Cisco is using Inclusive Language.
- Updated:
- September 29, 2015
Chapter: Visualizing the Topology
Visualizing the Topology
AutoNetkit Visualization
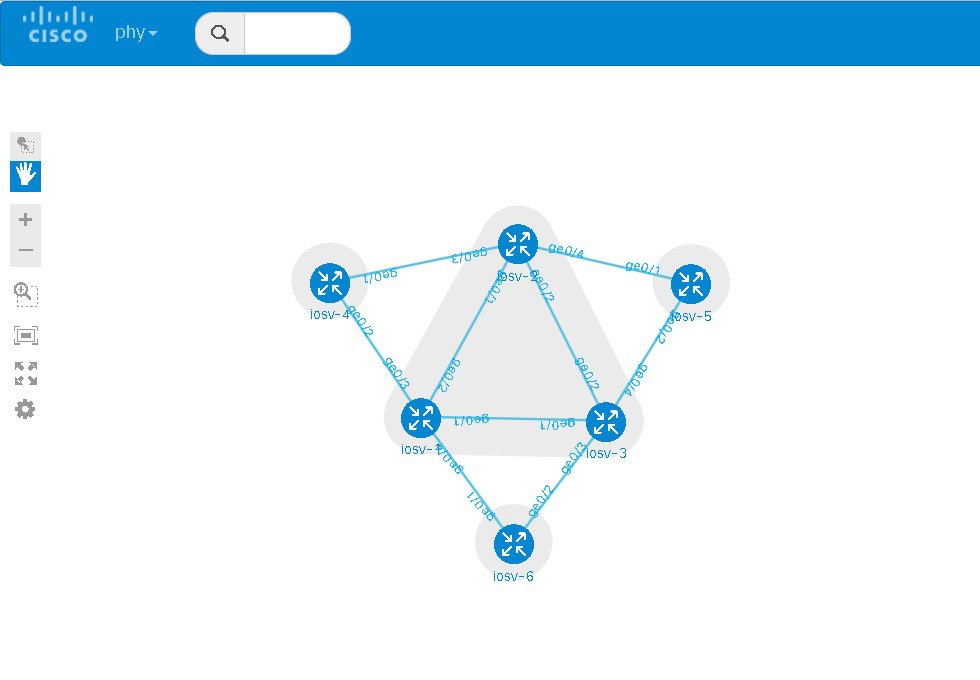
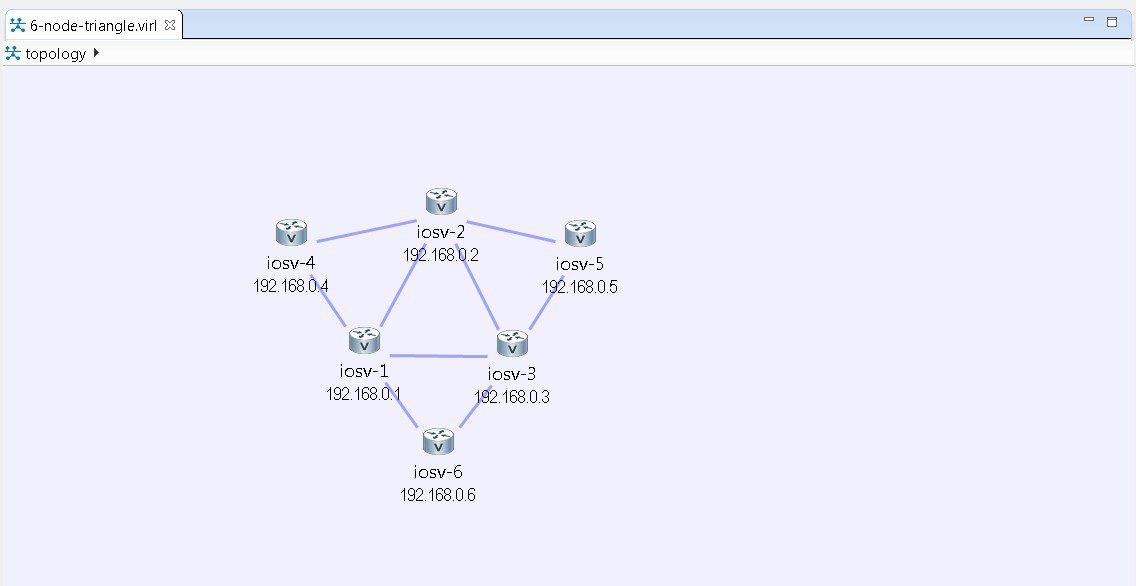
The AutoNetkit visualization phase allows you to see how the nodes interact in terms of routing protocol connectivity, autonomous system (AS) numbers, Open Shortest Path First (OSPF) area, and so on. Before entering the AutoNetkit visualization phase, you must have designed the topology and generated the node configurations using parameters defined in AutoNetkit.
AutoNetkit visualization runs in a browser window, either within the Cisco Modeling Labs client or in a separate window browser. Ensure that you use a compatible browser, as described in the Cisco Modeling Labs Corporate Edition System Administrator Installation Guide, Release 1.1 and Cisco Modeling Labs Corporate Edition Client Installation Guide, Release 1.1, for the version of Cisco Modeling Labs that you are using.
Access AutoNetkit Visualization
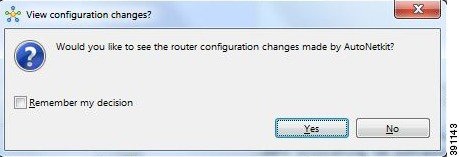
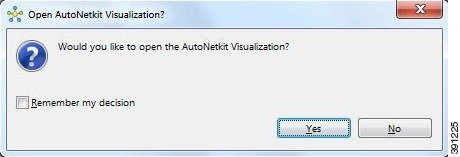
To access AutoNetkit visualization, complete the following steps:
AutoNetkit View Options
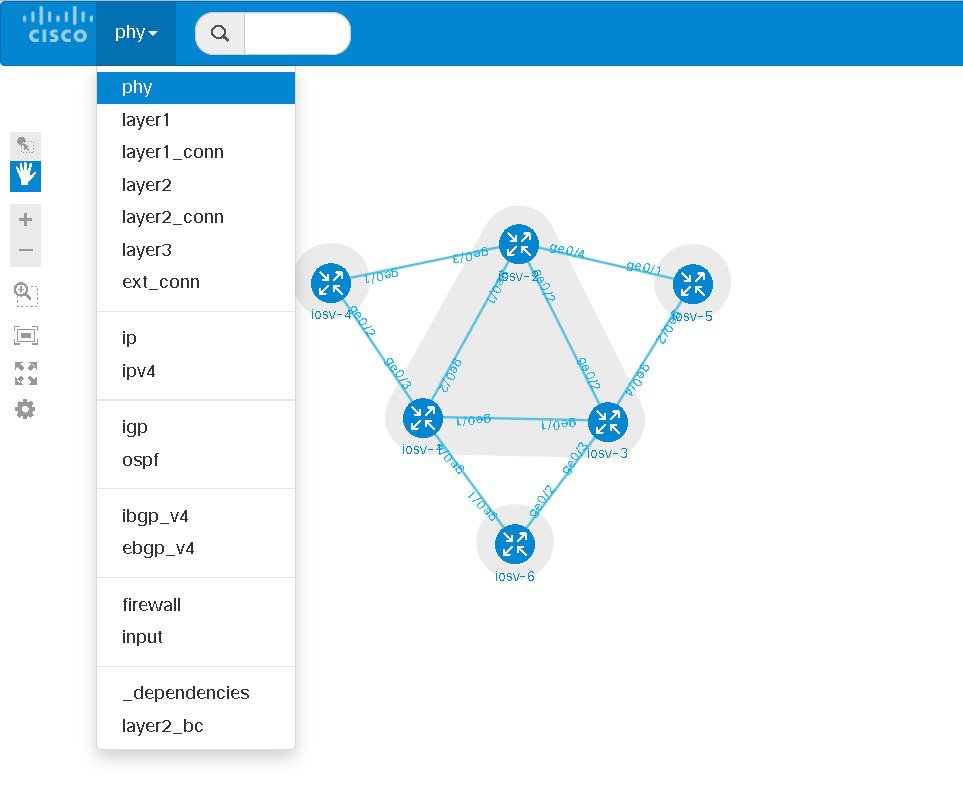
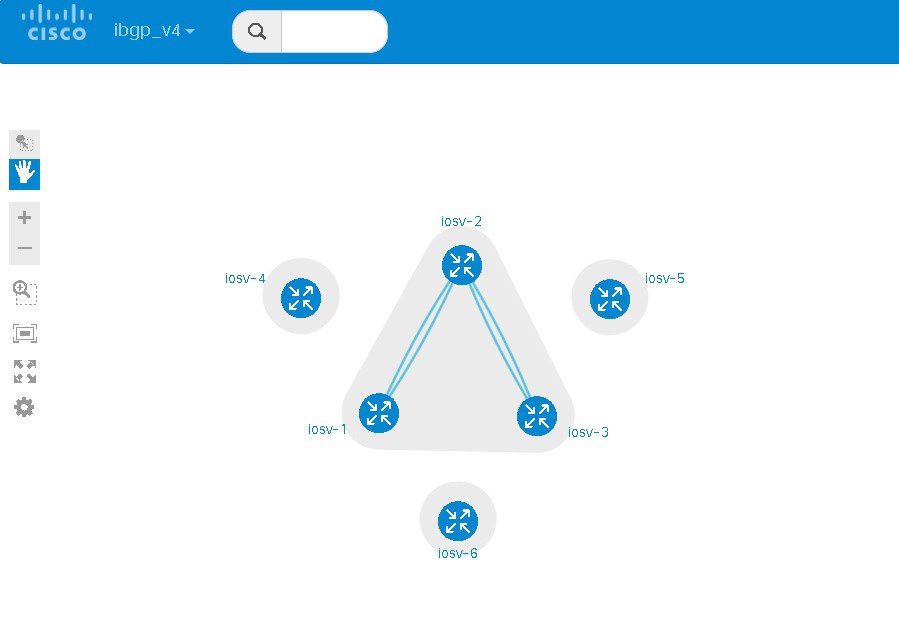
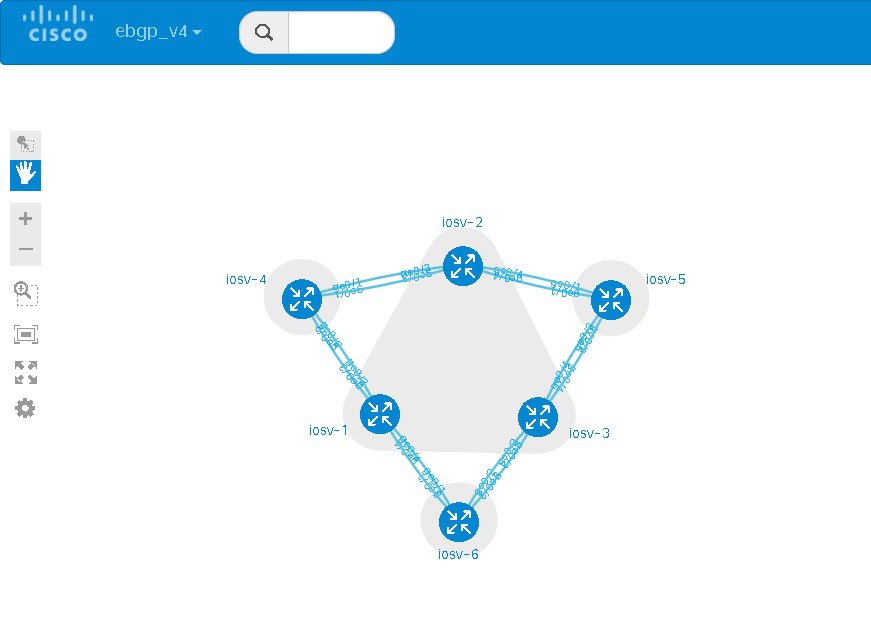
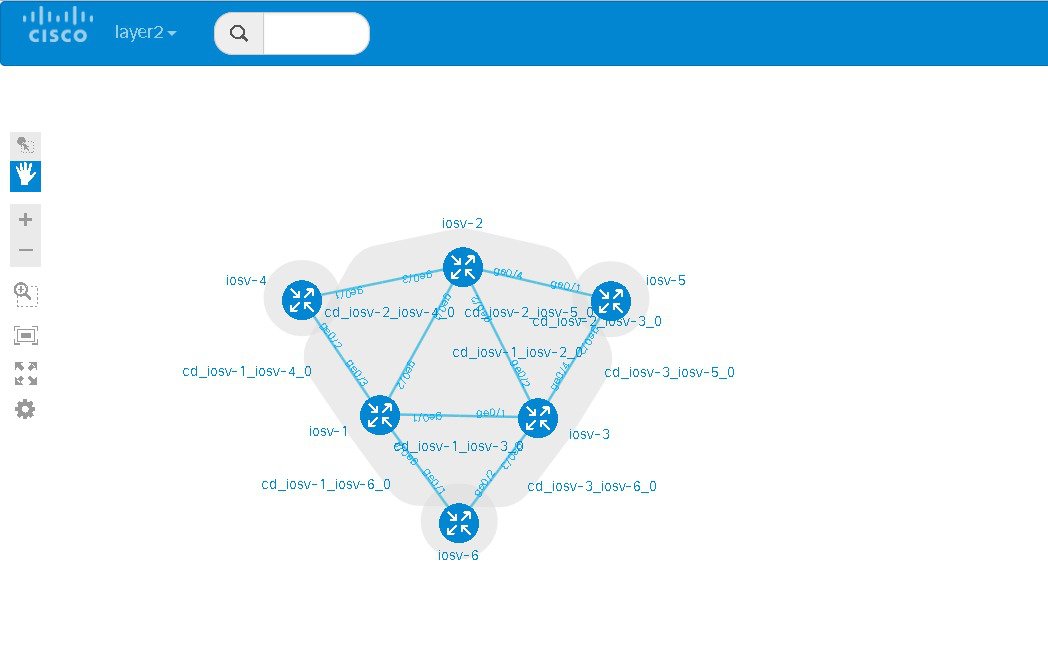
 Note | You can also hover over the connections to see connection details. |
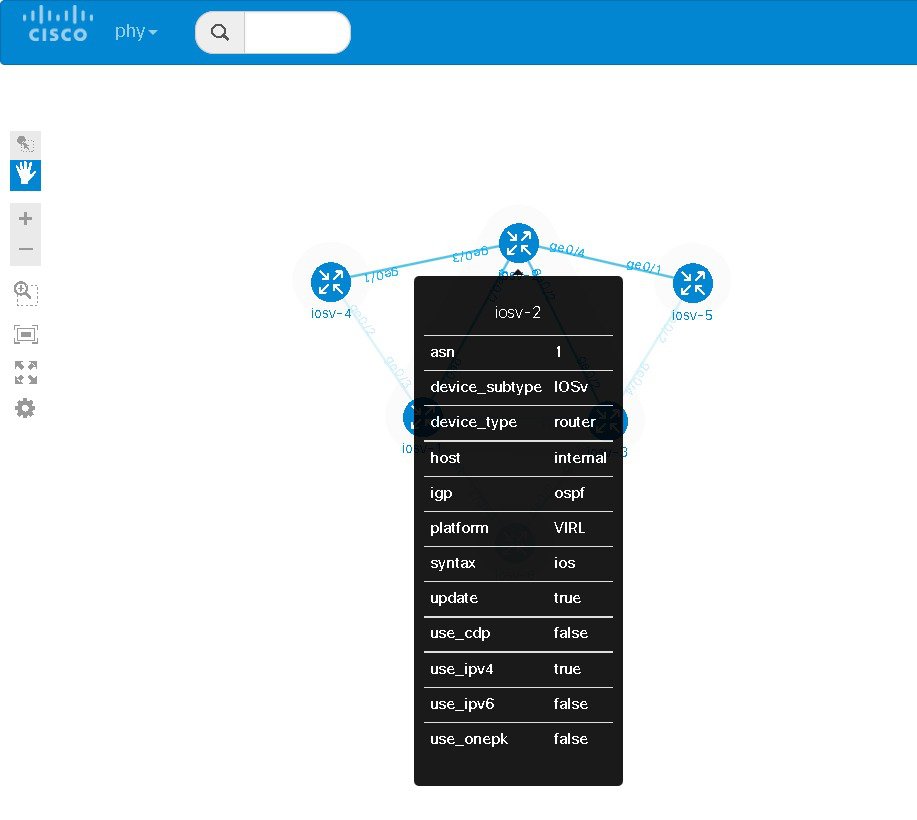
You can continue to select different protocol views to see how the protocol-centric view changes. In a complex topology, you can use the phy views to verify that the protocols, nodes, and connections meet the design requirements.
 Feedback