Fabric Data Collection Overview
The Fabric Data Collection tool provides a simple way to collect data from the Cisco Software-Defined Access (SD-Access) fabric. The tool uses a preset list of commands to connect to all selected devices, and the tool also executes those commands to bundle the outputs. The main benefit of this approach is that large amounts of information are collected from all fabric devices almost simutaneously. If a problem occurs inside the fabric, the problem may be analyzed later for the cause and solution. Because the tool automatically collects information, it provides a snapshot of the state of the fabric at that time.
Use the Fabric Data Collection Tool
Procedure
| Step 1 |
In the Cisco DNA Center GUI, click the Menu icon ( 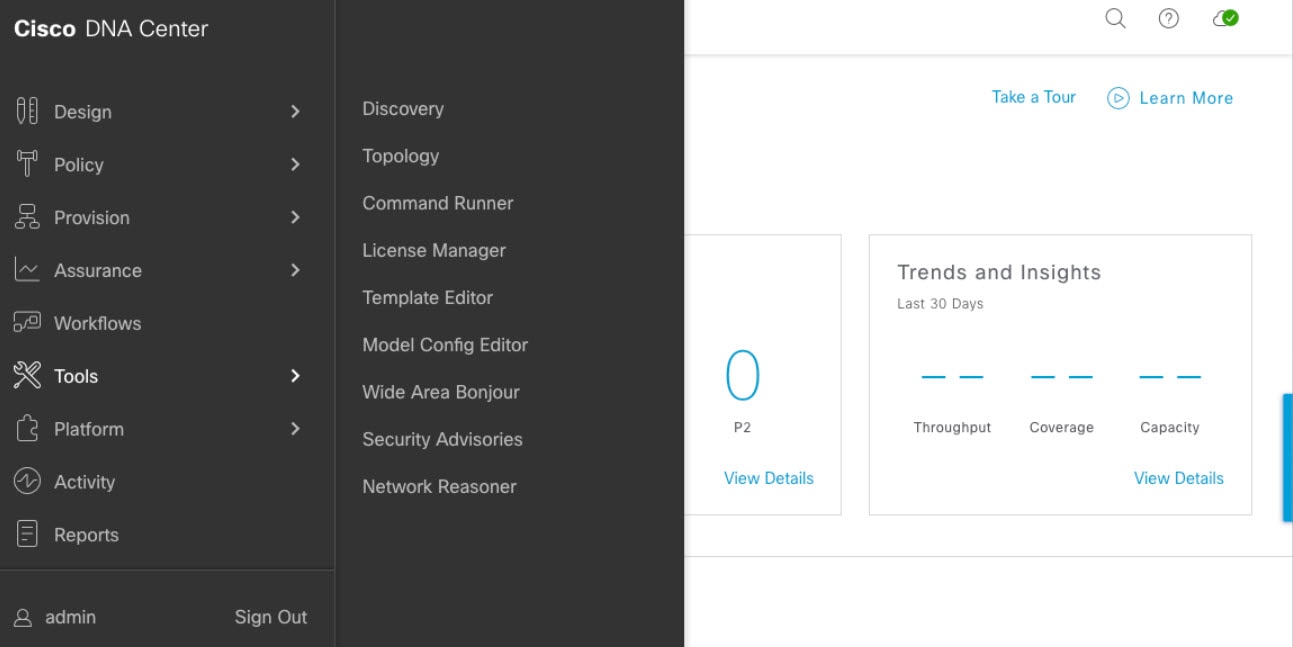
|
| Step 2 |
In the Network Reasoner window, there is a collection of Network Reasoner tools. In the Validated Tools area, locate the Fabric Data Collection tool. 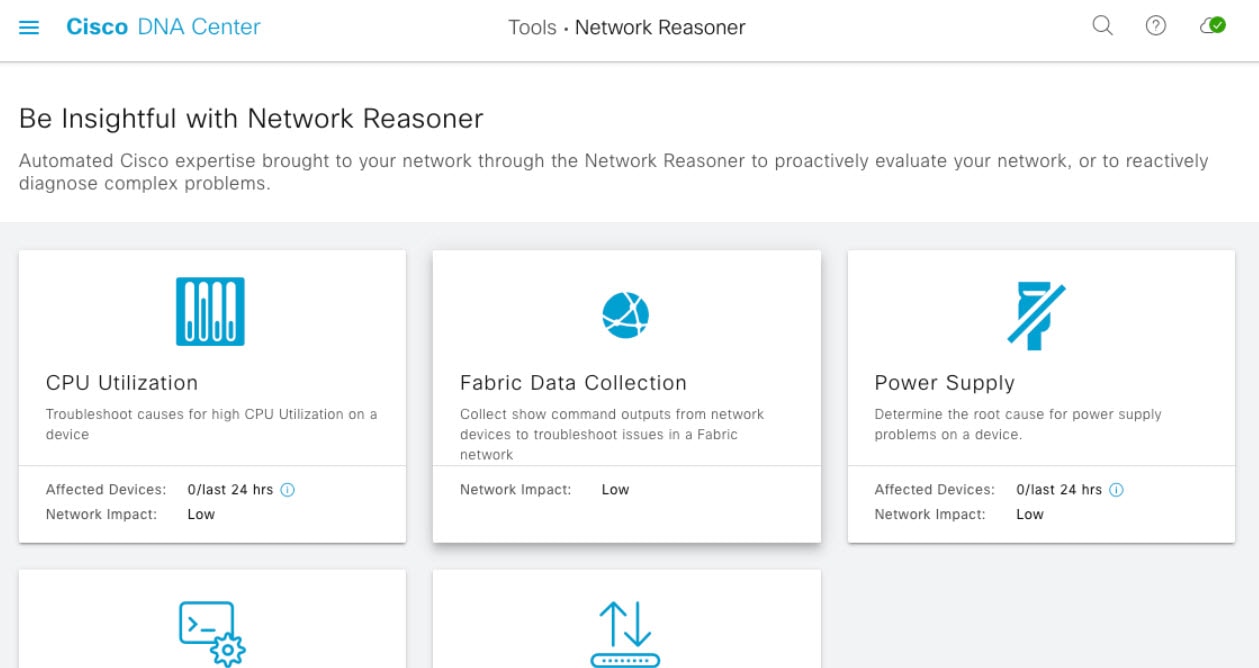
|
| Step 3 |
Click Fabric Data Collection. The Fabric Data Collection window appears. |
| Step 4 |
In the left pane, choose a location site and choose the devices to use for the tool. |
| Step 5 |
After you choose the site and devices, the tool activates. Click Troubleshoot. 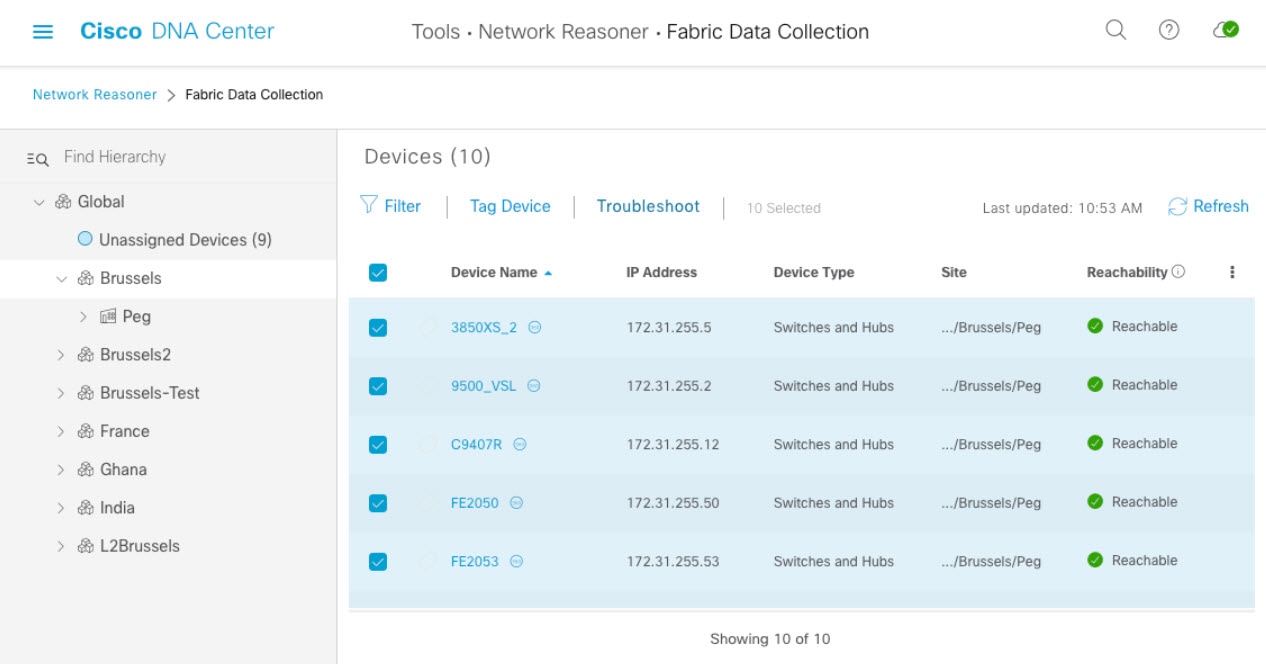
|
| Step 6 |
During tool activity, the tool determines the types of devices and the roles of devices in the fabric. With this information, the tool assesses which commands are being executed and which commands are not being executed on the devices. This performance allows devices to only execute commands relevant to the roles of the devices. 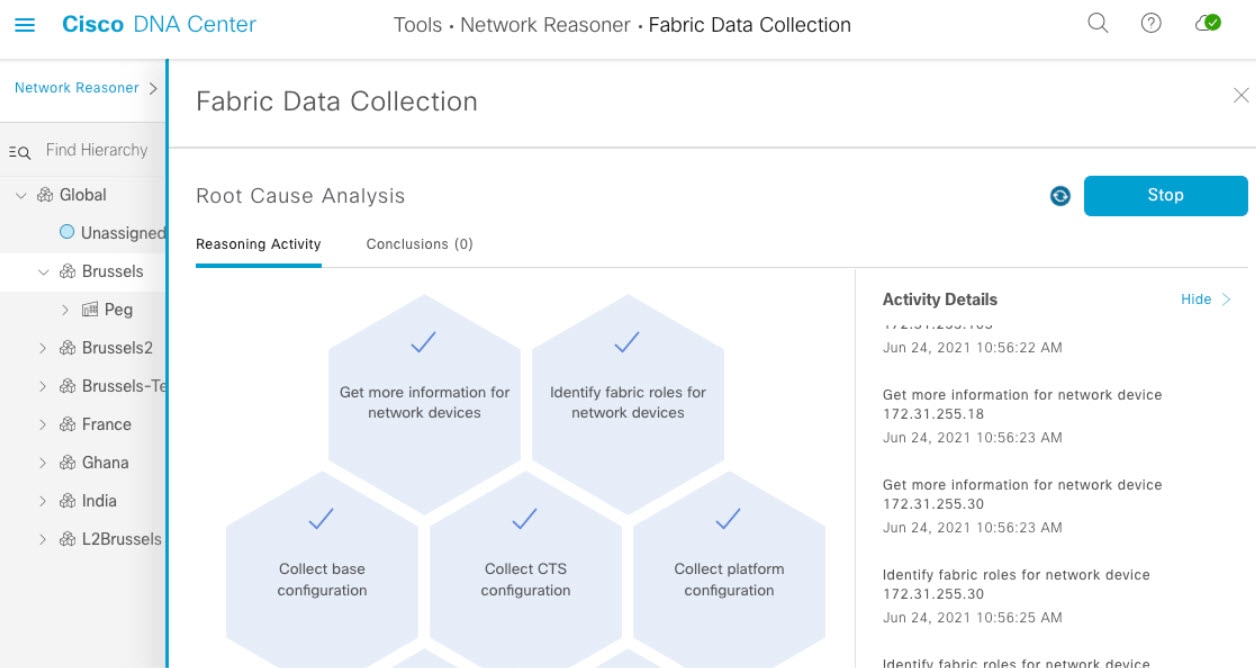
|
| Step 7 |
After the tool finishes collecting the outputs, you can find the results under the Conclusions tab. In the Fabric Data Collection window, under the Root Cause Analysis area, click the Conclusions tab. The other Network Reasoner tools provide the analysis of data received from the Fabric Data Collection tool. In the Conclusions tab, download the bundle file. 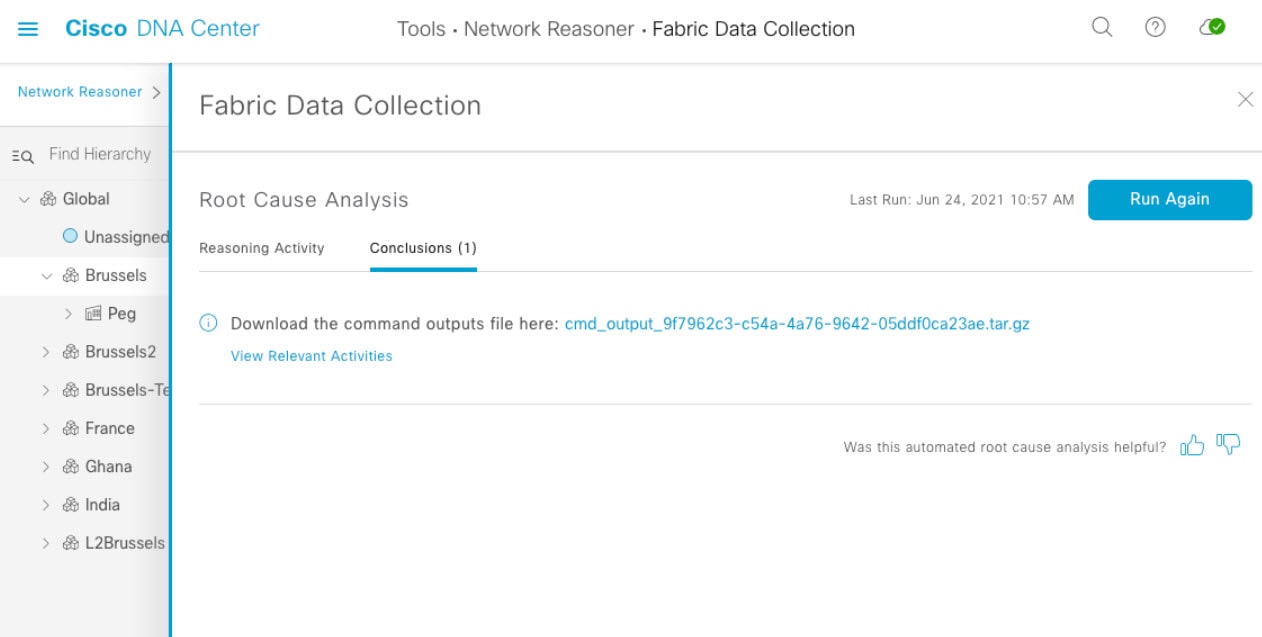
|
| Step 8 |
In the Conclusions tab, click the filename and download the file, which contains all the outputs that were collected. |
| Step 9 |
You can retrieve the bundle through various methods, such as by using the tar command. When the bundle files are retrieved, the tar command shows various .txt files that correspond to the hostnames of devices the tool ran on. These text files contain the executed commands and the outputs. These text files are normal text files. |
Analyze the Bundle
Inside the bundle file of every device is a text file with all the commands, which are viewable with any text editor. The commands are executed on all devices almost simutaneously. This quick process allows you to compare outputs on various devices. For example, the list map-cache on an edge device may be compared against the information from the control plane node. Because the bundle file includes information that spans across multiple features, it is able to analyze the SD-Access fabric at the time the bundle was taken. This includes information such as the Locator/ID Separation Protocol (LISP) tables, IP routing tables, authentication information, Cisco Trusted Security (CTS) information, device configurations, and various platform commands.
There are two methods of analyzing the bundle:
-
Use manual analysis and compare various tables.
-
Use tools, such as the SDA_Digger tool, to analyze the bundle file. This tool detects and alerts on specific events and inconsistencies. Additionally, it provides an overview of what is found during the analysis.
########-M-K4K6: #########$ python3 SDA_Digger.py -b ~/cmd_bundle
Session Analysis: CP session to 3850XS_2 not present on FE9200-02
Session Analysis: CP session to 3850XS_2 not present on FE9404_1
Session Analysis: Checked LISP sessions on 8 nodes towards 2 CP nodes. Found 8 sessions, missing 2, failures 0
LISP Database Analysis: d037.4544.5f3e/48 : In LISP database on FE2050(172.31.255.50) CP node: 9500_VSL reports RLOC 10.48.91.173
LISP Database Analysis: d037.4544.5f3e/48 : In LISP database on FE2050(172.31.255.50) CP node: 9500_VSL reports RLOC 10.48.91.173
LISP Database Analysis: Number of EID checked 91, failed 1
LISP Database Analysis: Number of Local EID 29
LISP Database Analysis: Number of Devices checked 8
Map Cache Analysis : Device:FE9200-28 reporting 4099:172.28.253.1/32 with RLOC 172.31.255.2 in map-cache entry not present on CP nodes. Expires in 23:49:05, Uptime: 1w3d,
Map Cache Analysis : Device:FE9200-02 reporting 4099:172.28.253.1/32 with RLOC 172.31.255.2 in map-cache entry not present on CP nodes. Expires in 04:56:04, Uptime: 1w1d,
Map Cache Analysis : Device:9500_VSL reporting 4099:172.27.0.0/24 with RLOC 172.31.255.201 in map-cache entry not present on CP nodes. Expires in 05:28:49, Uptime: 1d18h,
Map Cache Analysis : Device:FE9404_1 reporting 4099:172.28.253.1/32 with RLOC 172.31.255.2 in map-cache entry not present on CP nodes. Expires in 23:50:19, Uptime: 1w3d,
Map Cache Analysis : Device:FE2053 reporting 4099:172.28.253.1/32 with RLOC 172.31.255.2 in map-cache entry not present on CP nodes. Expires in 07:52:07, Uptime: 6d16h,
Map Cache Analysis : Device:FE2050 reporting 4099:172.28.253.1/32 with RLOC 172.31.255.2 in map-cache entry not present on CP nodes. Expires in 06:12:07, Uptime: 1w0d,
Map Cache Analysis : Device:C9407R reporting 4099:172.28.253.1/32 with RLOC 172.31.255.2 in map-cache entry not present on CP nodes. Expires in 23:50:09, Uptime: 1w3d,
Map Cache Analysis : Device:FE9200-30 reporting 4099:172.28.253.1/32 with RLOC 172.31.255.2 in map-cache entry not present on CP nodes. Expires in 00:00:00, Uptime: 00:00:00,
Map Cache Analysis : Found 149 entries, verified 22 entry on 8 devices with 8 failures
MTU Analysis: System MTU in fabric 9100, configured on 7 devices, misconfigured on 0 devices
Device-tracking analysis: Verified 7 edge devices with SVI info, 32 success, 0 mismatches 0 info missing
Reachability Analysis: Fabric Devices with full (/32) reachabily 8, devices without full reachability 0, not checked 0
CTS Analysis: verified CTS on 9 nodes, 0 failures found
SVI Analysis: Device FE2050 has inconsistent Interface Vlan configuration with all other edge devices
SVI Analysis: Analyzed Interface Vlan config on 7 , found inconsistency on 1
The SDA_Digger tool discussed in this tech note is publically available and downloadable from https://github.com/michelpe/SDA_Digger.
 Feedback