Review the Wide Area Bonjour Dashboard
The Wide Area Bonjour application is a software-defined, policy-based Apple Bonjour protocol controller that facilitates multicast-DNS based service discovery.
The Wide Area Bonjour application displays the following dashboard.
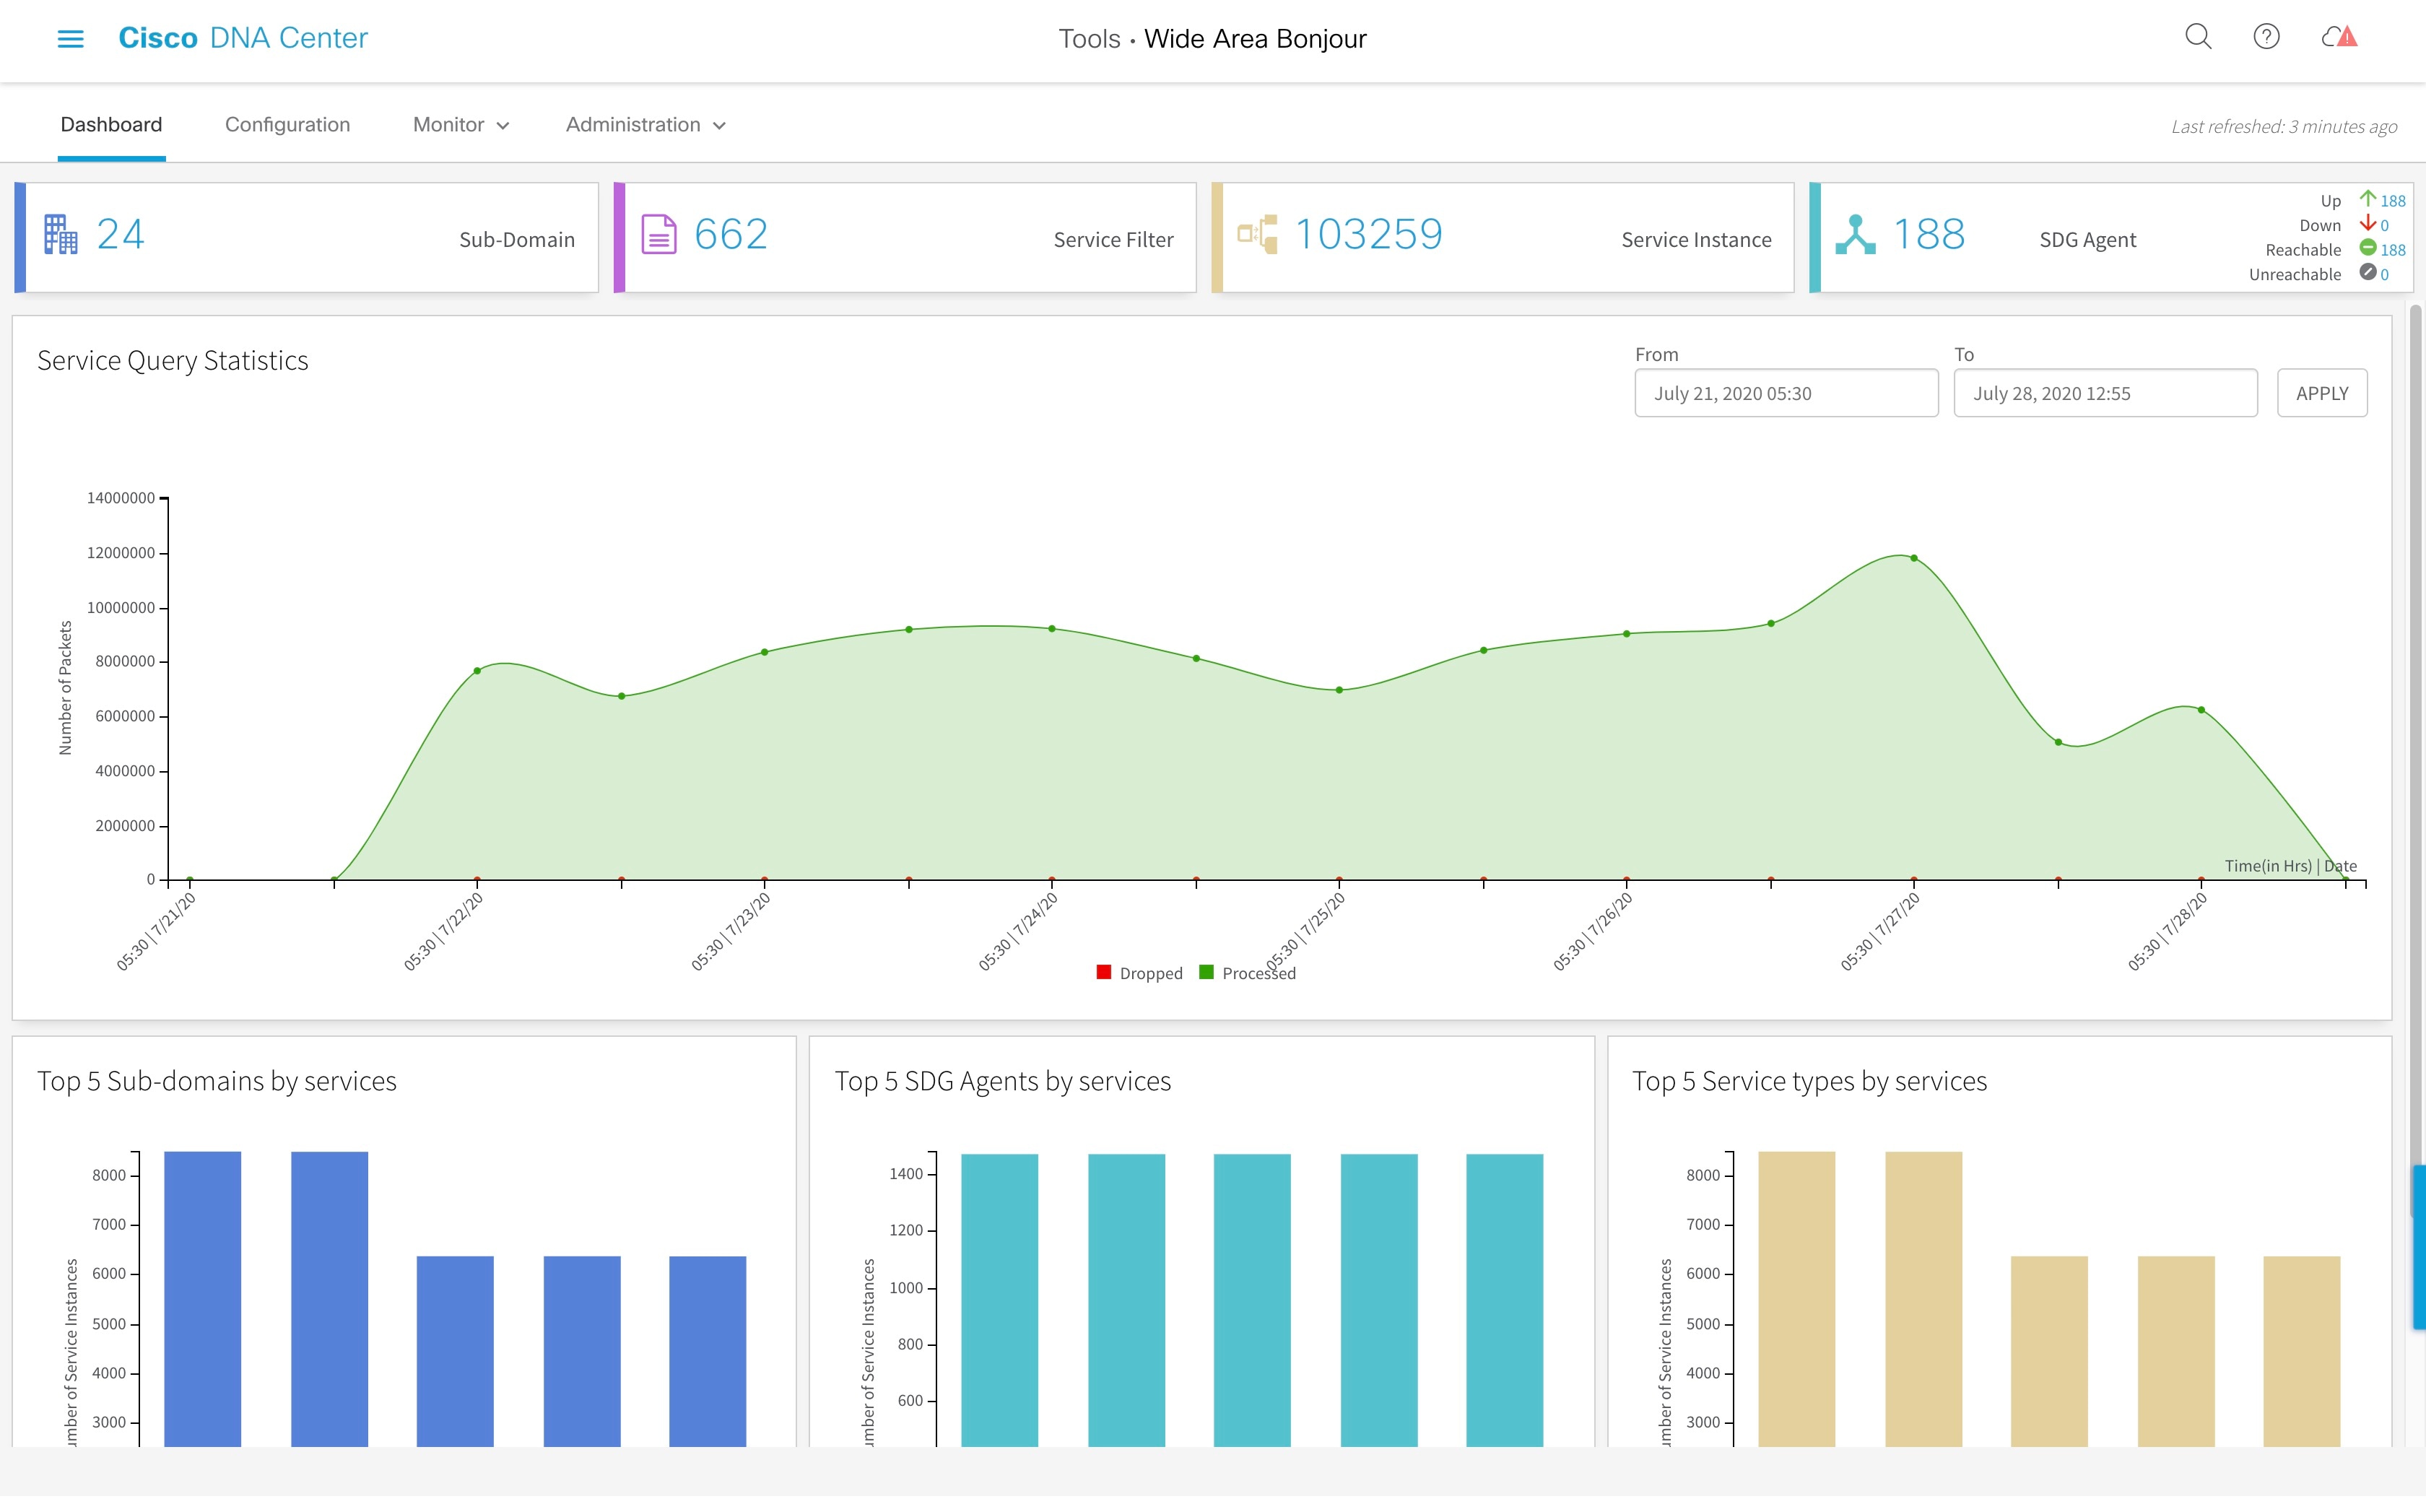
The dashboard provides a snapshot of the following:
-
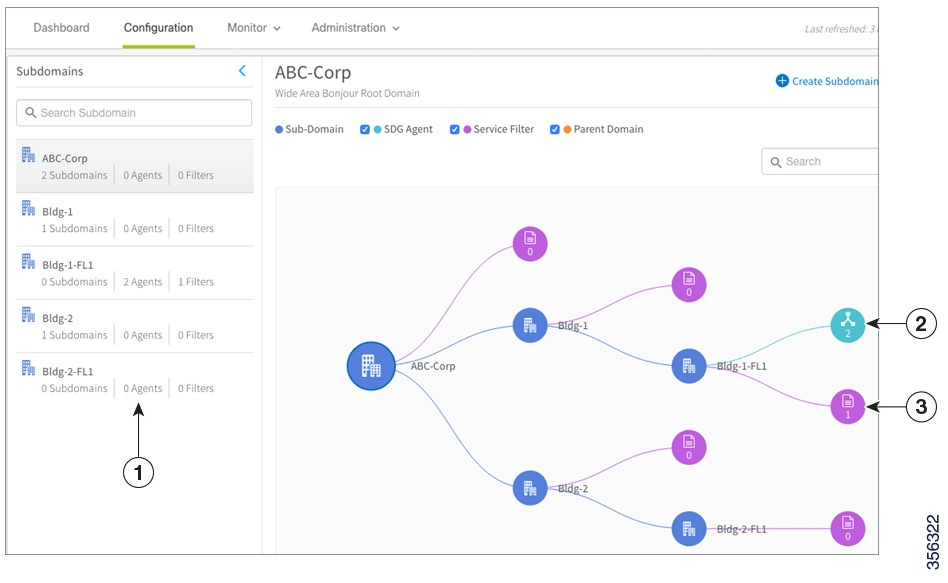
Sub-domain. Number of subdomains. When you click the number of subdomains in this tile, you're directed to the Configuration page of the Wide Area Bonjour application.
-
Service Filter. Number of policies established between network devices for the application. When you click the number on this tile, you're directed to the Configuration page of the Wide Area Bonjour application.
-
Service Instance. Number of service instances. When you click the number in the tile, you're directed to the Service Instance page.
-
SDG Agent. Number of network devices (SDG Agents) connected to the application and the status of the SDG Agents. When you click this tile, you're directed to the SDG Agent page. It displays the count of SDG Agents that are UP, DOWN, Reachable, and Unreachable.
On the SDG Agent page, you can filter the SDG Agents according to Active and Inactive state, or by any of the following parameters:
-
SDG Agent IP Address
-
Domain Name
-
Service Filter name
-
Role (whether the SDG Agent is a source agent advertising service, or a query agent requesting service, or both)
-
Available services (the current count of available service instances announced by the SDG Agent)
-
Reachability (whether the SDG Agent is reachable)
-
State (whether the SDG Agent is UP or DOWN.

Note
The SDG Agent may be reachable, but still be down if the SDG Agent is not included in any policy.
-
Last sync (the time of the last synchronization with the SDG Agent)
-
Resync Status (status of the last resync operation - successful, failed, or in-progress)
-
-
Service Query Statistics. Graphical display of query packet traffic statistics for the application (number of processed and dropped service query packets at a given interval of time). This graphical display can be used to monitor the network health and to become aware of any issue due to an increase in the number of packets being dropped.
Additionally, you can view the following information from the dashboard:
-
Top 5 Sub-domains by services
-
top 5 SDG Agents by services
-
Top 5 Service types by services
Click the bar graphs in the tiles to view more information.

 Feedback