Cisco SCE Remote Cable MSO Links Solution Guide, Release 3.8.x
Bias-Free Language
The documentation set for this product strives to use bias-free language. For the purposes of this documentation set, bias-free is defined as language that does not imply discrimination based on age, disability, gender, racial identity, ethnic identity, sexual orientation, socioeconomic status, and intersectionality. Exceptions may be present in the documentation due to language that is hardcoded in the user interfaces of the product software, language used based on RFP documentation, or language that is used by a referenced third-party product. Learn more about how Cisco is using Inclusive Language.
- Updated:
- March 21, 2012
Chapter: Managing the Remote Cable MSO Links Solution
Managing the Remote Cable MSO Links Solution
Introduction
This chapter describes the three monitoring mechanisms that you can use to monitor the traffic optimization on remote links solution:
•![]() p3vlink command line utility (CLU)
p3vlink command line utility (CLU)
•![]() Cisco SCE command line interface (CLI)
Cisco SCE command line interface (CLI)
•![]() Reporter tool virtual links report template group
Reporter tool virtual links report template group
Virtual Link Names
Each virtual link represents a single interface on the CMTS device and the virtual link name comprises the CMTS device name and the interface name. The virtual links are named according to the following naming convention:
<Device name>_<Interface name>
•![]() <Device name>—This portion of the name is set when configuring the CMTS in the vlink.cfg configuration file.
<Device name>—This portion of the name is set when configuring the CMTS in the vlink.cfg configuration file.
•![]() <Interface name>—This portion of the name identifies the specific CMTS interface including the direction and the interface index. This information is how the CMTS describes the interface internally and it is retrieved from the CMTS device by using SNMP.
<Interface name>—This portion of the name identifies the specific CMTS interface including the direction and the interface index. This information is how the CMTS describes the interface internally and it is retrieved from the CMTS device by using SNMP.
–![]() The direction portion of the virtual link name indicates the virtual link direction. Values can be upstream or downstream.
The direction portion of the virtual link name indicates the virtual link direction. Values can be upstream or downstream.
–![]() The interface index indicates the specific interface on the CMTS of the virtual link.
The interface index indicates the specific interface on the CMTS of the virtual link.
This is a sample virtual link name for a CMTS device named Device-1:
Device-1_CMTS1/0-upstream 1
If a downstream virtual link contains two channels, then the virtual link names are displayed as:
<Device name>_<Interface name>-L<index of the primary channel>
or
<Device name>_<Interface name>-W
Monitoring Using the p3vlink Utility
The p3vlink utility provides the ability to show virtual link configurations and metrics related to the virtual links. The command format is:
p3vlink OPERATION [OPTIONS]
Table 5-1 and Table 5-2 lists the p3vlink operations and options, respectively.
p3vlink Utility Examples
To show the CMTS device general configuration, CMTS device list, and CMTS device information:
p3vlink --show
General data:
-------------
Start: Yes
Monitor Every: 60 minutes
BW Up Factor 95
BW Down Factor 95
Next query operation: Wed Nov 05 08:40:33 IST 2008
Next ip removal operation: Wed Nov 12 10:40:11 IST 2008
Enable Device Learning: true
Upstream Global Controllers: None
Downstream Global Controllers: None
Device list
-----------
        1) Name: device, Host Name: Paris, Type Static, Query state: Completed, Last
successful query: Wed Nov 05 08:39:35 IST 2008
Command terminated successfully
>
To show the general configuration of a specified CMTS device:
p3vlink --show-device -d CMTS1 --detail
Name: CMTS1
Host Name: Paris
IP: 192.0.2.10
Type: Static
SCE Related: sce0
Upstream factor: 95
Downstream factor: 95
Last success Query: Thu Jun 19 17:54:48 IDT 2008
Last Query Attempt: Thu Jun 19 17:54:48 IDT 2008
Last Query Status: Completed
Sync state with SCE: done
Sync state with CM: done
Giaddr List: 127.0.0.1
Upstream Global Controllers: None
Downstream Global Controllers: <GC Name>=<GC Value>,<GC Name>=<GC Value>...
isLogAll: true
Num of up interfaces: 6
Num of down interfaces: 2
VLink Information:
1) Name: CMTS1_Cmts0/0-upstream2, Vlink Id: 1, Direction UP, PIR 5000 kbps.
2) Name: CMTS1_Cmts0/0-downstream1, Vlink Id:1, Direction DOWN, PIR 10000 kbps
Channel Name: <vlink Name>-W, index <value>, PIR <value> kpbs, CIR <value> kpbs
 		Channel Name: <vlink Name>-L<channel index>, index <value>, PIR <value> kpbs, CIR
<value> kpbs
3) Name: CMTS1_Cmts0/0-upstream3, Vlink Id:2, Direction UP, PIR 10000 kbps.
4) Name: CMTS1_Cmts1/0-downstream1, Vlink Id:2, Direction DOWN, PIR 20000 kbps.
5) Name: CMTS1_Cmts0/0-upstream1, Vlink Id:3, Direction UP, PIR 10000 kbps.
6) Name: CMTS1_Cmts1/0-upstream2, Vlink Id:4, Direction UP, PIR 20000 kbps.
7) Name: CMTS1_Cmts1/0-upstream3, Vlink Id:5, Direction UP, PIR 20000 kbps.
8) Name: CMTS1_Cmts1/0-upstream1, Vlink Id:6, Direction UP, PIR 20000 kbps.
Command terminated successfully
>
The output of this command includes these four information elements:
•![]() Num of up interfaces—Summarizes the total number of upstream virtual links related to this CMTS device. Unknown indicates that the VLM was not able to communicate with the CMTS device.
Num of up interfaces—Summarizes the total number of upstream virtual links related to this CMTS device. Unknown indicates that the VLM was not able to communicate with the CMTS device.
•![]() Num of down interfaces—Summarizes the total number of downstream virtual links related to this CMTS device. Unknown indicates that the VLM was not able to communicate with the CMTS device.
Num of down interfaces—Summarizes the total number of downstream virtual links related to this CMTS device. Unknown indicates that the VLM was not able to communicate with the CMTS device.
•![]() Sync state with Cisco SCE:
Sync state with Cisco SCE:
–![]() Done—The Cisco SCE is fully synchronized with CMTS device information. When working in cascade mode, both the active and standby Cisco SCEs are synchronized with CMTS device data.
Done—The Cisco SCE is fully synchronized with CMTS device information. When working in cascade mode, both the active and standby Cisco SCEs are synchronized with CMTS device data.
–![]() Not-done—The Cisco SCE (or one of the Cisco SCEs in cascade mode) is not synchronized with all CMTS device data. Use the p3vlink --resync -n <sce which manages the device> command to perform the synchronization operation.
Not-done—The Cisco SCE (or one of the Cisco SCEs in cascade mode) is not synchronized with all CMTS device data. Use the p3vlink --resync -n <sce which manages the device> command to perform the synchronization operation.
–![]() Sync-in-process—When VLM detects configuration changes, the change needs to be sent to the Cisco SCE. During the update process, the VLM changes the sync state to Sync-in-process.
Sync-in-process—When VLM detects configuration changes, the change needs to be sent to the Cisco SCE. During the update process, the VLM changes the sync state to Sync-in-process.
For successful updates, the Cisco SCE sync state is set to Done, else the value is set to Not-Done.
•![]() Sync state with Collection Manager:
Sync state with Collection Manager:
–![]() Done—The Collection Manager is fully synchronized with CMTS device information.
Done—The Collection Manager is fully synchronized with CMTS device information.
–![]() Not-done—The CM is not synchronized with all CMTS device data. Use the p3vlink --resync -n <sce which manages the device> command to perform the synchronization operation.
Not-done—The CM is not synchronized with all CMTS device data. Use the p3vlink --resync -n <sce which manages the device> command to perform the synchronization operation.
–![]() N/A—The Cisco SCE to which the CMTS device belongs, is not connected to any Collection Manager.
N/A—The Cisco SCE to which the CMTS device belongs, is not connected to any Collection Manager.
–![]() Sync-in-process - When VLM detects configuration changes, the change needs to be sent to the Collection Manager. During the update process, the VLM changes the sync state to Sync-in-process.
Sync-in-process - When VLM detects configuration changes, the change needs to be sent to the Collection Manager. During the update process, the VLM changes the sync state to Sync-in-process.
For successful updates, Cisco SCE sync state is set to Done, else the value is set to Not-Done.
•![]() Last Query Status:
Last Query Status:
–![]() Not started—Query operation for the device was not started since the last SM boot.
Not started—Query operation for the device was not started since the last SM boot.
–![]() Completed—Last query was completed successfully.
Completed—Last query was completed successfully.
–![]() Failure—Last query failed to complete.
Failure—Last query failed to complete.
–![]() Waiting for query—Query operation is in queue waiting for resources.
Waiting for query—Query operation is in queue waiting for resources.
–![]() In-query—Device is in the process of a query operation.
In-query—Device is in the process of a query operation.
–![]() Waiting for deletion—During the last query, if no giaddr was found, the system queues up the device for deletion. This is applicable only to dynamic devices.
Waiting for deletion—During the last query, if no giaddr was found, the system queues up the device for deletion. This is applicable only to dynamic devices.
To show all the virtual links for a specific network element (Cisco SCE):
p3vlink --show-vlinks -n sc0
device0_0_Cmts0/1-downstream1, vlink id=15, direction=DOWN
device0_0_Cmts0/1-upstream1, vlink id=8, direction=UP
device0_0_Cmts0/1-upstream2, vlink id=16, direction=DOWN
device0_1_Cmts1/1-downstream1, vlink id=11, direction=DOWN
device0_1_Cmts1/1-upstream1, vlink id=6, direction=UP
device0_1_Cmts1/1-upstream2, vlink id=12, direction=DOWN
device0_2_Cmts2/1-downstream1, vlink id=25, direction=DOWN
device0_2_Cmts2/1-upstream1, vlink id=13, direction=UP
device0_2_Cmts2/1-upstream2, vlink id=26, direction=DOWN
device0_3_Cmts3/1-downstream1, vlink id=13, direction=DOWN
device0_3_Cmts3/1-upstream1, vlink id=7, direction=UP
device0_3_Cmts3/1-upstream2, vlink id=14, direction=DOWN
device0_4_Cmts4/1-downstream1, vlink id=21, direction=DOWN
device0_4_Cmts4/1-upstream1, vlink id=11, direction=UP
device0_4_Cmts4/1-upstream2, vlink id=22, direction=DOWN
device0_5_Cmts5/1-downstream1, vlink id=1, direction=DOWN
device0_5_Cmts5/1-upstream1, vlink id=1, direction=UP
device0_5_Cmts5/1-upstream2, vlink id=2, direction=DOWN
device0_6_Cmts6/1-downstream1, vlink id=9, direction=DOWN
device0_6_Cmts6/1-upstream1, vlink id=5, direction=UP
device0_6_Cmts6/1-upstream2, vlink id=10, direction=DOWN
device1_0_Cmts7/1-downstream1, vlink id=3, direction=DOWN
device1_0_Cmts7/1-upstream1, vlink id=2, direction=UP
device1_0_Cmts7/1-upstream2, vlink id=4, direction=DOWN
device1_1_Cmts8/1-downstream1, vlink id=7, direction=DOWN
device1_1_Cmts8/1-upstream1, vlink id=4, direction=UP
device1_1_Cmts8/1-upstream2, vlink id=8, direction=DOWN
device1_2_Cmts9/1-downstream1, vlink id=27, direction=DOWN
device1_2_Cmts9/1-upstream1, vlink id=14, direction=UP
device1_2_Cmts9/1-upstream2, vlink id=28, direction=DOWN
device1_3_Cmts10/1-downstream1, vlink id=23, direction=DOWN
device1_3_Cmts10/1-upstream1, vlink id=12, direction=UP
device1_3_Cmts10/1-upstream2, vlink id=24, direction=DOWN
device1_4_Cmts11/1-downstream1, vlink id=19, direction=DOWN
device1_4_Cmts11/1-upstream1, vlink id=10, direction=UP
device1_4_Cmts11/1-upstream2, vlink id=20, direction=DOWN
device1_5_Cmts12/1-downstream1, vlink id=5, direction=DOWN
device1_5_Cmts12/1-upstream1, vlink id=3, direction=UP
device1_5_Cmts12/1-upstream2, vlink id=6, direction=DOWN
device1_6_Cmts13/1-downstream1, vlink id=17, direction=DOWN
device1_6_Cmts13/1-upstream1, vlink id=9, direction=UP
device1_6_Cmts13/1-upstream2, vlink id=18, direction=DOWN
Command terminated successfully
To show the vlink data of a specific link:
p3vlink --show-vlink-data --vlink-name=device_Cmts0/0-downstream1
VLink Name: device_Cmts0/0-downstream1
VLink Id: 1
Direction: downstream
SCE Name: sce0
Device Name: device
PIR: 200000000
Channels related to VLink
<name>-L, index <index>, PIR <value>, CIR <value>
<name>-W, index <index>, PIR <value>, CIR <value>
Related upstream virtual links —Lists all upstream interface related to the same MAC layer
as the selected downstream interface.
device_Cmts0/0-upstream0
device_Cmts0/0-upstream1
device_Cmts0/0-upstream2
device_Cmts0/0-upstream3

Note ![]() If more than one vlink has the same name, this command displays the information for all the vlinks.
If more than one vlink has the same name, this command displays the information for all the vlinks.
To show the upstream and downstream vlink mappings that the virtual link manager learnt from all configured CMTSs:
p3vlink --show-vlink-mappings
IPDR Vlink Mapping Tables:
===========================
Upstream Table:
{10.52.206.2_1054_1=191, 10.52.206.2_1109_2=88,
10.52.206.2_1077_4=196, 10.52.206.2_1031_1=99,
10.52.206.2_1019_4=43, 10.52.206.2_1047_1=9,
10.52.206.2_1093_4=97, 10.52.206.2_1018_2=158,
10.52.206.2_1080_2=73, 10.52.206.2_1042_4=126}
Downstream Table:
{10.52.206.2_1110_185=9, 10.52.206.2_1106_169=3,
10.52.206.2_1093_153=7, 10.52.206.2_1095_161=5,
10.52.206.2_1092_149=1, 10.52.206.2_1108_177=6,
10.52.206.2_1107_173=2, 10.52.206.2_1094_157=8,
10.52.206.2_1109_181=4}
Command terminated successfully
To show the subscribers using virtual links:
•![]() Use the p3subsdb command to list all the subscribers:
Use the p3subsdb command to list all the subscribers:
p3subsdb --show-all
lynn_jones
Command terminated successfully
•![]() Use the p3subs command to show the virtual links of a particular subscriber:
Use the p3subs command to show the virtual links of a particular subscriber:
p3subs --show -s lynn_jones
Name: lynn_jones
Domain: subscribers
Mappings:
IP: 1.1.1.13/32
Properties:
downVlinkId=7 Name=device1_1_Cmts8/1-downstream1
upVlinkId=4 Name=device1_1_Cmts8/1-upstream1
Custom Properties:
giaddr=1.1.1.1
Command terminated successfully
•![]() Use the p3vlink command to show the subscribers that are associated with a particular CMTS device:
Use the p3vlink command to show the subscribers that are associated with a particular CMTS device:
p3vlink --show-subs -d device1_1
Subscribers related to device: device1_1 vlink-id: 4, giaddr: 1.1.1.1, direction UP
lynn_jones
Subscribers related to device: device1_1 vlink-id: 7, giaddr: 1.1.1.1, direction DOWN
lynn_jones
Command terminated successfully
•![]() Use the p3vlink command to show the subscribers that are associated with a specific CMTS device:
Use the p3vlink command to show the subscribers that are associated with a specific CMTS device:
p3vlink --show-subs -d Test0 --direction=Down --vlink-id=23
Subscribers related to device: Test0 vlink-id: 23, giaddr: 24.191.128.17, direction
DOWN010101010106010101010107
Command terminated successfully
•![]() Use the p3vlink command to show the subscribers that are associated with a specific vlink:
Use the p3vlink command to show the subscribers that are associated with a specific vlink:
p3vlink --show-subs --vlink-name test1_Cmts0/0-upstream2
Subscribers related to device: test1 vlink-id: 5, giaddr: 10.78.233.149, direction UP
010101010101
1 subscriber was found
Command terminated successfully
•![]() Use the p3vlink command to show the subscribers that are associated to a channel name:
Use the p3vlink command to show the subscribers that are associated to a channel name:
p3subs --show -s sub1
Name: sub1
Domain: subscribers
Properties:
downVlinkId=11 Name=local_Modular-Cable1/0/0:1-L194
upVlinkId=11 Name=local_Cable7/0/2-upstream2
Custom Properties:
giaddr=10.78.233.233
Command terminated successfully
p3vlink --show-subs --channel-name=local_Cable7/0/2-upstream2
Subscribers related to device: local vlink-id: 11, giaddr: 10.78.233.233, direction UP
sub1
1 subscriber was found
Command terminated successfully
p3vlink --show-subs --channel-name=local_Modular-Cable1/0/0:1-L194
Subscribers related to device: local vlink-id: 11, giaddr: 10.78.233.233, direction
DOWN
sub1
1 subscriber was found
Command terminated successfully
To view the subscribers with partial, no, and 0 vlink mappings for a given device:
p3vlink --show-subs-partial-vlink -d cisco
Subscribers with partial and default vlinks in Device cisco :
=============================================================
000101010d10,000101010e10
Monitoring Virtual Links Using the Cisco SCE CLI
The Cisco SCE provides CLI commands to monitor the virtual links in the solution.
Table 5-3 lists the virtual links CLI commands.
virtual-links Command Examples
These examples show the output from the CLI virtual links commands:
SCE2000#> show interface Linecard 0 virtual-links template
Virtual Link enabled
Global Virtual link Global Controller, upstream:
name = globalGC - pir: 8000000 - cir: 0 - al: 5
name = globalGC1 - pir: 8000000 - cir: 0 - al: 5
Virtual link Global Controller, upstream Template hierarchic:
Total bandwidth limit in Virtual-Link:
name = Virtual-Link Global Controller - pir: 8000000,8000000,8000000,8000000 - cir: 0
- al: 5
name = appGC - pir: 8000000,8000000,8000000,8000000 - cir: 0 - al: 5
Global Virtual link Global Controller, downstream:
name = globalGC1 - pir: 8000000 - cir: 0 - al: 5
Virtual link Global Controller, downstream Template hierarchic:
Total bandwidth limit in Virtual-Link:
name = Virtual-Link Global Controller - pir: 8000000,8000000,8000000,8000000 - cir: 0
- al: 5
name = appGC - pir: 8000000,8000000,8000000,8000000 - cir: 0 - al: 5
name = appGC1 - pir: 8000000,8000000,8000000,8000000 - cir: 0 - al: 5
name = appGC2 - pir: 8000000,8000000,8000000,8000000 - cir: 0 - al: 5
SCE2000#> show interface LineCard 0 virtual-links all
Virtual Link enabled
upstream Virtual-Link:
index=1, name=virtual link 1
index=2, name=virtual link 2
index=3, name=virtual link 3
downstream Virtual-Link:
index=1, name=virtual link 1
index=2, name=virtual link 2
index=3, name=virtual link 3
SCE2000#> show interface LineCard 0 virtual-links different-from-template
Virtual Link enabled
upstream Virtual-Link:
virtual index=1, name=virtual link 1
channel index=1, name=virtual channel 1, pir=99999, cir=99, al=9, agc index=3
application index=1, name=appGC-1, pir=8000000, cir=0, al=5, agc index=2
virtual index=2, name=virtual link 2
channel index=2, name=virtual channel 2, pir=99999, cir=99, al=9, agc index=7
application index=1, name=appGC-2, pir=8000000, cir=0, al=5, agc index=6
downstream Virtual-Link:
virtual index=3, name=virtual link 3
channel index=3, name=virtual channel 3, pir=99999, cir=99, al=9, agc index=15
application index=1, name=appGC-3, pir=8000000, cir=0, al=5, agc index=12
application index=2, name=appGC1-3, pir=8000000, cir=0, al=5, agc index=13
application index=3, name=appGC2-3, pir=8000000, cir=0, al=5, agc index=14
SCE8000#> show interface LineCard 0 virtual-links index 1 direction upstream agc-mapping
Virtual Link enabled
upstream Virtual-Link:
virtual index=1, name=virtual link 1
channel index=1, name=virtual channel 1, pir=99999, cir=99, al=9, agc index=3
application index=1, name=appGC-1, pir=8000000, cir=0, al=5, agc index=2
SCE8000#> show interface LineCard 0 virtual-links index 1 direction upstream counter
Virtual Link enabled
upstream Virtual-Link:
virtual index=1, name=virtual link 1
channel index=1, name=virtual channel 1, pir=99999, cir=99, al=9, agc index=3,
enforce rate=99999, actual rate=0
application index=1, name=appGC-1, pir=8000000, cir=0, al=5, agc index=2, enforce
rate=8000000, actual rate=0
Monitoring Virtual Links Using the Reporter
The Cisco SCA BB includes a Reporter tool that allows you to produce reports based on the traffic analysis performed by the Cisco SCE platform. The information is sent from the Cisco SCE platform and is stored in a database. The Reporter can query and retrieve information from the database and present the results in a comprehensive range of reports.
The Reporter includes the Virtual Links Monitoring group of report templates that allow you to view statistics of bandwidth or volume of traffic used by a virtual link. The reports are provided per service usage counter for the total volume used by the virtual link. The volume consumption can be displayed per service for the virtual link. The reports are provided per channel.
Each report can be filtered to focus on a virtual link ID, a virtual link name, a virtual link direction, or a combination of the virtual link identifiers.
The Virtual Links Monitoring group includes these report templates:
•![]() VLink Bandwidth per Service—Shows the distribution of bandwidth among the different service usage counters defined in the system for all subscribers.
VLink Bandwidth per Service—Shows the distribution of bandwidth among the different service usage counters defined in the system for all subscribers.
•![]() VLink Aggregated Usage Volume per Service—Shows the total volume of traffic (upstream and downstream) for each service usage counter.
VLink Aggregated Usage Volume per Service—Shows the total volume of traffic (upstream and downstream) for each service usage counter.
•![]() VLink Bandwidth per Package—Shows the distribution of bandwidth among the different packages defined in the system for selected vlinks.
VLink Bandwidth per Package—Shows the distribution of bandwidth among the different packages defined in the system for selected vlinks.
•![]() VLink Hourly Usage Volume per Service—Shows the distribution of volume among the different service usage counters defined in the system, grouped by hour.
VLink Hourly Usage Volume per Service—Shows the distribution of volume among the different service usage counters defined in the system, grouped by hour.
•![]() VLink Daily Usage Volume per Service—Shows the distribution of volume among the different service usage counters defined in the system, grouped by day.
VLink Daily Usage Volume per Service—Shows the distribution of volume among the different service usage counters defined in the system, grouped by day.
•![]() Daily Peak BW for all VLinks—Shows the daily value of the maximum bandwidth (1-hour or 2-hour average) for all virtual links.
Daily Peak BW for all VLinks—Shows the daily value of the maximum bandwidth (1-hour or 2-hour average) for all virtual links.
•![]() Total Active Subscribers per VLink—Shows the number of active subscribers for a selected vlink.
Total Active Subscribers per VLink—Shows the number of active subscribers for a selected vlink.
•![]() VLink Bandwidth per Channel—Shows the distribution of bandwidth among the different channels for selected vlinks.
VLink Bandwidth per Channel—Shows the distribution of bandwidth among the different channels for selected vlinks.
•![]() Top Subscribers per VLink—Shows a list of the top subscriber volume consumption in a specific hour or day for a selected vlink.
Top Subscribers per VLink—Shows a list of the top subscriber volume consumption in a specific hour or day for a selected vlink.
•![]() Average Bandwidth per Subscribers per VLink—Shows the average bandwidth for a specific subscriber for a selected vlink.
Average Bandwidth per Subscribers per VLink—Shows the average bandwidth for a specific subscriber for a selected vlink.
•![]() Accumulated Bandwidth Distribution per VLink—Shows the accumulated bandwidth distribution for a selected vlink.
Accumulated Bandwidth Distribution per VLink—Shows the accumulated bandwidth distribution for a selected vlink.
Creating a New Report Instance Using Cisco Insight
For details on creating a new report instance using Cisco Insight, see the Cisco Insight v2 User Guide.
Creating a New Report Instance Using SCA Reporter
To create a new report instance using the SCA Reporter, complete these steps:
Step 1 ![]() Go to the Cisco SCA BB console. From the Tools menu, choose Reporter.
Go to the Cisco SCA BB console. From the Tools menu, choose Reporter.
The Reporter opens and the Templates tab appears.
Step 2 ![]() In Templates view, expand the Virtual Links Monitoring group.
In Templates view, expand the Virtual Links Monitoring group.
Step 3 ![]() Right-click a report instance (for example, VLink Bandwidth per Service).
Right-click a report instance (for example, VLink Bandwidth per Service).
A popup menu appears.
Step 4 ![]() From the menu, choose New.
From the menu, choose New.
The New Report Wizard dialog box appears (Figure 5-1), allowing you to configure the new report.
Figure 5-1 New Report Wizard Dialog Box
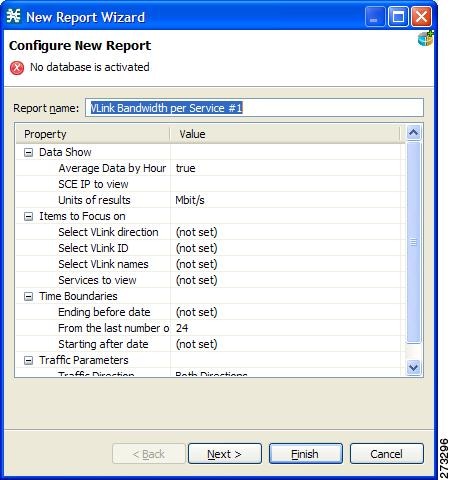
Step 5 ![]() In the Report name field, enter the name of the report instance.
In the Report name field, enter the name of the report instance.
The default report name is VLink Bandwidth per Service #1. (If you create another report instance from this report template, it is named VLink Bandwidth per Service #2, and so on. You can rename report instances.)
Step 6 ![]() To create a report that focuses on a particular CMTS device:
To create a report that focuses on a particular CMTS device:
a. ![]() In the Select VLink names row, click the right column and click the Browse button that appears.
In the Select VLink names row, click the right column and click the Browse button that appears.
b. ![]() Click the Search button.
Click the Search button.
In the search box, enter the name of the CMTS device with an asterisk (*) before and after. For example, *CMTS_1*.
All the virtual links that contain the string CMTS_1 appear.
c. ![]() Select all the results and click OK.
Select all the results and click OK.
The report that focuses on the specified CMTS device is created.
 Feedback