Monitor iftask and NPU Performance on QvPC-DI
Available Languages
Download Options
Bias-Free Language
The documentation set for this product strives to use bias-free language. For the purposes of this documentation set, bias-free is defined as language that does not imply discrimination based on age, disability, gender, racial identity, ethnic identity, sexual orientation, socioeconomic status, and intersectionality. Exceptions may be present in the documentation due to language that is hardcoded in the user interfaces of the product software, language used based on RFP documentation, or language that is used by a referenced third-party product. Learn more about how Cisco is using Inclusive Language.
Introduction
This document describes how to monitor performance of iftask / NPU on QvPC-DI.
It also provides more information on some key concepts of iftask.
Components Used
The information in this document is based on QvPC-DI.
The information in this document was created from the devices in a specific lab environment. All of the devices used in this document started with a cleared (default) configuration. If your network is live, ensure that you understand the potential impact of any command.
Iftask Architecture
iftask is a process in QvPC-DI. It enables Data Plane Development Kit (DPDK) functionality on the Service Function Virtual Card (SF) and Control Function Virtual Card (CF) for the DI network ports and the service ports. DPDK is a more efficient way to handle Input/output in virtualized environments.
The device drivers of high performance Network interface controllers (NIC) are now moved to userspace, that avoids expensive context switches (userspace/kernelspace).
The drivers run in un-interruptable mode in userspace, and threads have direct access to the HW queues/ring buffers in these NIC drivers.
Documentation about architecture is available at :
Ultra Services Platform (USP) Introduction from Ultra Gateway Platform System Administration Guide.
Availability for different versions.
In depth iftask architecture (for SF) is seen in this diagram:
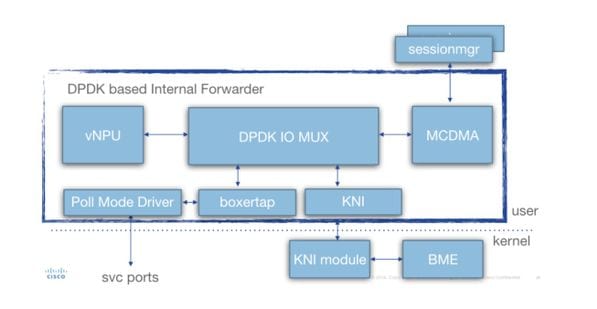
Various components are present:
Poll Mode Driver (PMD): This is the function that is continuously polling the HW Queues from the NIC's (in case of SR-IOV), or the SW ring buffers (in case of virtio/vmxnet type of interfaces). This is why the CPU's associated with these PMDs is continuously pegged at 100%.
During deployment the nr's of CPU's allocated to iftask and to various functions within iftask can be statically allocated through the param.cfg file.
Boxertap: attaching/removing staros metadata (MEH header) to packets based on where packet is coming from (ex: Di port/service port), and where it should be sent (ex: local vNPU)
IOMUX: Has a BIA library with all destinations (sessmgr's/ports/vNPU's/..). This function is basically routing the packets based on their BIA
vNPU: -flow classification/lookup. This is comparable to the NPU in the HW-based systems (ASR5000/ASR5500).
The flows in vNPU are still programmed by NPUmgr (who gets its information from demuxmgr's/sessmgr etc) in shared memory that is accessible by vNPU.
-Additionally an API is created such that npumgr/sessmgr can poll the vNPU for statistics/configuration
MCDMA: packets destined for sessmgr are written to MCDMA interface (through the various MCDMA cores/threads that are available). These packets are then made availble to sessmgr via DMA. This provides a real performance boost as kernel is involved only in a limited way. This is explained further in this article.
MCDMA also provides batching capabilities (to handle many packets in one system call).
KNI: interface for packets which need to go towards linux kernel (DI control/ARP/icmp/routing/...)
Iftask Packet Flow
The below diagram explains the packet flow of a control plane packet. Example: GTPv2 Create session Request
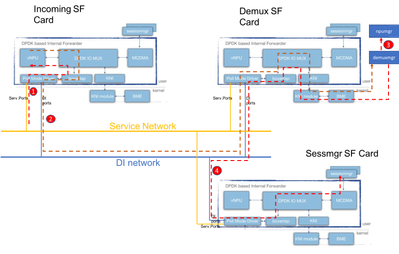
Step 1: The GTPv2 CSR packet will come in through the service port on any of the available SF's. It will be put in the Rx Queues of the Service interface NIC, and picked up by one of the PMD cores of the iftask process. Boxertap will put the MEH header, and the packet will be forwarded through IOMux to the local vNPU for flow lookup.
Since this is a new session, the vNPU has no specific flow programmed for this, and it will have to route the packet to the demuxmgr on the demux card.
Step 2: vNPU changes the MEH header (with a new BIA for the relevant demux process). IOMUX knows it has to send this off over the DI network towards the demux card. Iftask process on the Demux card will handle the incoming packet, and IOMux will route it to the KNI module (which is the interface towards kernel). Through the kernal it will eventually end up in the demuxmgr process (egtpinmgr in this case).
Step 3: The Demuxmgr will perform it's tasks. Select a sessmgr, and program npumgr with the flows for the subsequent GTPv2 packets
The vNPU's of all cards will be able to access the shared memory that npumgr uses to program these flows.
Step 4: The GTPv2 CSR is now forwarded to the selected sessmgr. It's MEH is changed again, and forwarded out of the Demux card, on the DI net towards the Sessmgr SF card. IOMUX process on that card will forward the packet over MCDMA interface towards the selected sessmgr. From here onwards, sessmgr will handle all GTPv2 traffic for this session. Once the GTPU TEID's are negotiated, it will program the flows through NPUmgr such that subsequent GTPU packets can also go directly from incoming SF card to sessmgr SF card.
vCPU's in iftask
During deployment, certain amount of virtual central processing units (vCPU's) are statically allocated to the iftask process. This reduces the amount of cores for userspace applications (sessmgr etc), but it greatly enhance the performance of I/O.
This allocation is done via below parameter in that param.cfg template that is associated with each SF/CF during deployment:
- IFTASK_CORES (% of available cores to be assigned with iftask)
- (IFTASK_CRYPTO_CORES - (% of available cores to be assigned for crypto processing (in the case of EPDG))
- (IFTASK_MCDMA_CORES - (to further tune to number of cores allocated to MCDMA functionality)
- On an SF, The iftask process internally will distribute its assigned cores into:
- Poll Mode Drivers (PMD) vCPU’s (doing tx/rx/vnpu activity)
- MCDMA vCPU’s, doing transfer of packets from iftask to sessmgr and back
- On a CF, no MCDMA vCPU's are required, since SF's are not hosting sessmgr processes.
The command 'show cloud hardware iftask' gives more details about this on your QVPC-DI deployment:
[local]UGP# show cloud hardware iftask
Card 1:
  Total number of cores on VM:      8
  Number of cores for PMD only:     0
  Number of cores for VNPU only:    0
  Number of cores for PMD and VNPU: 2     <--  CF: 2 out of 8 cores are assigned to iftask PMD/VNPU
  Number of cores for MCDMA:        0     <--  CF: no cores allocated to MCDMA as there is no sessmgr process on CF
  Number of cores for Crypto:        0
  Hugepage size:           2048 kB
  Total hugepages:      3670016 kB
  NPUSHM hugepages:           0 kB
  CPU flags: avx sse sse2 ssse3 sse4_1 sse4_2
  Poll CPU's: 1 2
  KNI reschedule interval: 5 us
 ...
Card 3:
  Total number of cores on VM:      8
  Number of cores for PMD only:     0
  Number of cores for VNPU only:    0
  Number of cores for PMD and VNPU: 2     <-- SF: 2 out of 8 core are assigned to iftask PMD/VNPU
  Number of cores for MCDMA: 1            <-- SF: 1 out of 8 cores is assigned to iftak MCDMA
  Number of cores for Crypto: 0
  Hugepage size: 2048 kB
  Total hugepages: 4718592 kB
  NPUSHM hugepages: 0 kB
  CPU flags: avx sse sse2 ssse3 sse4_1 sse4_2
  Poll CPU's: 1 2 3
  KNI reschedule interval: 5 us
Command 'show cloud configuration' will give more details on the parameters used:
[local]UGP# show cloud configuration
Card 1:
  Config Disk Params:
-------------------------
CARDSLOT=1
CPUID=0
CARDTYPE=0x40010100
DI_INTERFACE=BOND:TYPE:ixgbevf-1,TYPE:ixgbevf-2
DI_INTERFACE_VLANID=2111
VNFM_INTERFACE=MAC:fa:16:3e:23:aa:e9
VNFM_PROXY_ADDRS=172.16.180.3,172.16.180.5,172.16.180.6
MGMT_INTERFACE=MAC:fa:16:3e:87:23:9b
VNFM_IPV4_ENABLE=true
VNFM_IPV4_DHCP_ENABLE=true

  Local Params:
-------------------------
CARDSLOT=1
CARDTYPE=0x40010100
CPUID=0

...

Card 3:
  Config Disk Params:
-------------------------
CARDSLOT=3
CPUID=0
CARDTYPE=0x42030100
DI_INTERFACE=BOND:TYPE:ixgbevf-1,TYPE:ixgbevf-2
SERVICE1_INTERFACE=BOND:TYPE:ixgbevf-3,TYPE:ixgbevf-4
SERVICE2_INTERFACE=BOND:TYPE:ixgbevf-5,TYPE:ixgbevf-6
DI_INTERFACE_VLANID=2111
VNFM_INTERFACE=MAC:fa:16:3e:29:c6:b7
IFTASK_CORES=30
VNFM_IPV4_ENABLE=true
VNFM_IPV4_DHCP_ENABLE=true

  Local Params:
-------------------------
CARDSLOT=3
CARDTYPE=0x42010100
CPUID=0
Design considerations:
There are a number of factors which have to be taken into account when allocating vCPU's to iftask.
-total vCPU's availble to the SF vs iftask vCPU's: The default config specifies 30% of vCPU's associated to iftask via the IFTASK_CORES parameter in param.cfg file. But this may vary depending on the application (MME vs SPGW vs ePDG) --> To be consulted with engineering.
-iftask vCPU's allocated to PMD vs iftask vCPU's allocated to MCDMA. To verify if this is balanced, please see the iftask performance section below.
-iftask MCDMA vCPU's vs remaining vCPU's for all applications. Typically it's good to have a 1/x distribution of iftask MCDMA vCPU's against the remaining vCPU's for the applications (sessmgr/aaamgr/...).
Example:
Total cores 38 available to SF:
-14 assigned to iftask (6 PMD, 8 MCDMA)
-leaving 24 assigned to other processes
Which means there is 1 MCDMA vCPU for each 3 application vCPU's.
this helps to ensure equal loading for each MCDMA vCPU.
Monitoring iftask performance
The iftask process can be monitored in several ways.
Consolidate list of show commands:
show subscribers data-rate
show npumgr dinet utilization pps
show npumgr dinet utilization pps
show cloud monitor di-network summary
show cloud hardware iftask
show cloud configuration
show iftask stats summary
show port utilization table
show npu utilization table
show npumgr utilization information
show processes cpu
Command #show cpu info verbose will not give information about the iftask cores. They will always be listed at 100% utilization.
In the example below, core 1,2,3 are associated with iftask, and are listed at 100% utilization, this is expected.
Card 3, CPU 0:
  Status                : Standby, Kernel Running, Tasks Running
  Load Average          : 3.12, 3.12, 3.13 (3.95 max)
  Total Memory          : 16384M
  Kernel Uptime         : 4D 21H 56M
  Last Reading:
    CPU Usage All       : 1.9% user, 0.3% sys, 0.0% io, 0.0% irq, 97.8% idle
        Core 0          : 5.8% user, 0.2% sys, 0.0% io, 0.0% irq, 94.0% idle
        Core 1          : Not Averaged (Poll CPU)
        Core 2          : Not Averaged (Poll CPU)
        Core 3          : Not Averaged (Poll CPU)
        Core 4          : 2.2% user, 0.2% sys, 0.0% io, 0.0% irq, 97.6% idle
        Core 5          : 0.8% user, 0.5% sys, 0.0% io, 0.0% irq, 98.7% idle
        Core 6          : 0.4% user, 0.5% sys, 0.0% io, 0.0% irq, 99.1% idle
        Core 7          : 0.1% user, 0.3% sys, 0.0% io, 0.0% irq, 99.6% idle
    Poll CPUs           : 3 (1, 2, 3)
        Core 1          : 100.0% user, 0.0% sys, 0.0% io, 0.0% irq, 0.0% idle
        Core 2          : 100.0% user, 0.0% sys, 0.0% io, 0.0% irq, 0.0% idle
        Core 3          : 100.0% user, 0.0% sys, 0.0% io, 0.0% irq, 0.0% idle
    Processes / Tasks   : 143 processes / 16 tasks
    Network mcdmaN      : 0.002 kpps rx, 0.001 mbps rx, 0.002 kpps tx, 0.001 mbps tx
    File Usage          : 1504 open files, 1627405 available
    Memory Usage        : 7687M 46.9% used
    Memory Details:
      Static            : 330M kernel, 144M image
      System            : 10M tmp, 0M buffers, 54M kcache, 79M cache
      Process/Task      : 6963M (120M small, 684M huge, 6158M other)
      Other             : 104M shared data
      Free              : 8696M free
      Usable            : 5810M usable (8696M free, 0M reclaimable, 2885M reserved by tasks)
Command #show npu utilization table will give a good summary on the utilization of each core associated with iftask process (on each card).
Note: Important here is to identify if some cores are consistently higher in utilization than other cores.
[local]UGP# show npu utilization table
          -------iftask-------
   lcore     now   5min  15min
--------  ------ ------ ------
  01/0/1      0%     0%     0%
  01/0/2      0%     0%     0%
  02/0/1      0%     0%     0%
  02/0/2      2%     1%     0%
  03/0/1      0%     0%     0%
  03/0/2      0%     0%     0%
  03/0/3      0%     0%     0%
  04/0/1      0%     0%     0%
  04/0/2      0%     0%     0%
  04/0/3      0%     0%     0%
  05/0/1      0%     0%     0%
  05/0/2      0%     0%     0%
  05/0/3      0%     0%     0%
Command #show npumgr utilization information (hidden command)
This command gives more information about each iftask core, and what is consuming CPU on these cores.
Note: PMD cores are having their CPU consumed on PortRX, PortTX, KNI, Cipher. MCDMA cores are having their CPU consumed by MCDMA.
Both PMD and MCDMA cores should have fairly even load.
If this is not the case, some tuning might be required (allocating more/less MDMA cores for example).
******** show npumgr utilization information 3/0/0 *******
    5-Sec Avg: lcore01| lcore02| lcore03| lcore04| lcore05| lcore06| lcore07| lcore08| lcore09| lcore10| lcore11| lcore12| lcore13| lcore14| lcore15| lcore16|
         Idle:     31%|     37%|     32%|     35%|     41%|     48%|     47%|     38%|     57%|     56%|     55%|     56%|     46%|     56%|     54%|     52%|
       PortRX:     28%|     26%|     27%|     26%|      0%|      0%|      0%|      0%|     12%|     14%|     11%|     11%|      0%|      0%|      0%|      0%|
       PortTX:      5%|      5%|      6%|      5%|      8%|      8%|      8%|     14%|      0%|      0%|      0%|      0%|      0%|      0%|      0%|      0%|
        KniRX:      6%|      0%|      0%|      0%|      0%|      0%|      0%|      0%|      0%|      0%|      0%|      0%|      0%|      0%|      0%|      0%|
          Kni:      1%|      0%|      0%|      0%|      0%|      0%|      0%|      0%|      0%|      0%|      0%|      0%|      0%|      0%|      0%|      0%|
      McdmaRX:      0%|      0%|      0%|      0%|     34%|     29%|     29%|     32%|      0%|      0%|      0%|      0%|     35%|     28%|     28%|     28%|
        Mcdma:      0%|      0%|      0%|      0%|     11%|      7%|      4%|      6%|      0%|      0%|      0%|      0%|     14%|      7%|      7%|      7%|
         Vnpu:     28%|     29%|     28%|     32%|      0%|      0%|      0%|      0%|     30%|     28%|     33%|     28%|      0%|      0%|      0%|      0%|
   McdmaFlush:      0%|      0%|      0%|      0%|      6%|      8%|     12%|     10%|      0%|      0%|      0%|      0%|      6%|     10%|     11%|     14%|
       Cipher:      1%|      2%|      6%|      2%|      0%|      0%|      0%|      0%|      1%|      2%|      1%|      5%|      0%|      0%|      0%|      0%|
 rx kbits/sec:  728563|  736103|  647535|  626595|  811362|  698724|  717147|  799281|  617199|  595268|  623670|  633132|  819270|  672732|  790849|  719498|
rx frames/sec:   94409|   95586|   91107|   84997|  109526|   97466|   98557|  107690|   81122|   82076|   86959|   87960|  114114|   96198|  108108|  100259|
 tx kbits/sec:  715038|  722181|  634227|  614221|  827124|  712740|  731329|  814782|  605373|  583318|  611001|  620328|  835692|  686575|  806395|  733924|
tx frames/sec:   94310|   95491|   90969|   84896|  109526|   97466|   98557|  107690|   81002|   81986|   86858|   87859|  114114|   96198|  108108|  100259|

   5-Min Avg: ...
  15-Min Avg: ...
more explananation:
CPU is accounted for as follows for a packet coming in on iftask process via Service port or DI port.
The Vnpu lookup is the most cpu intensive part.
If after Vnpu lookup:
-the packet is sent out to MCDMA core, the CPU time will be accounted for on the McdmaRx of the relevant MCDMA core.
-the packet is sent out to another iftask core, the CPU time will be accounted for under Vnpu
-the packet is sent out on the same iftask core, the CPU time will be accounted for under PortRx
-the packet is sent out on the same iftask core, the CPU time will be accounted for underKniRx
PortRx also includes significant general overhead for pulling packets off the receive queues and dispatching/queuing them to where they need to go
Commands #show npumgr dinet utilization pps, #show npumgr dinet utilization bbps and #show port utilization table
They provide information about the load on the DI ports, and the services ports.
The actual performance depends on NIC's/CPU's and CPU allocation to iftask.
[local]UGP# show npumgr dinet utilization pps
                           ------ Average DINet Port Utilization (in kpps) ------
Port   Type                       Current           5min             15min
                                 Rx      Tx      Rx       Tx       Rx     Tx
----- ------------------------  ------- -------  ------- -------  ------- -------
 1/0  Virtual Ethernet          0       0        0       0        0       0
 2/0  Virtual Ethernet          0       0        0       0        0       0
 3/0  Virtual Ethernet          0       0        0       0        0       0
 4/0  Virtual Ethernet          0       0        0       0        0       0
 5/0  Virtual Ethernet          0       0        0       0        0       0

[local]UGP# show npumgr dinet utilization bps
                           ------ Average DINet Port Utilization (in mbps) ------
Port   Type                       Current           5min             15min
                                 Rx      Tx      Rx       Tx       Rx     Tx
----- ------------------------  ------- -------  ------- -------  ------- -------
 1/0  Virtual Ethernet          1       1        1       1        1       1
 2/0  Virtual Ethernet          1       0        1       0        1       0
 3/0  Virtual Ethernet          0       0        0       0        0       0
 4/0  Virtual Ethernet          0       0        0       0        0       0
 5/0  Virtual Ethernet          0       0        0       0        0       0

[local]UGP# show port utilization table
                                ------ Average Port Utilization (in mbps) ------
Port   Type                       Current           5min             15min
                                 Rx      Tx      Rx       Tx       Rx     Tx
----- ------------------------  ------- -------  ------- -------  ------- -------
 1/1  Virtual Ethernet          0       0        0       0        0       0
 2/1  Virtual Ethernet          0       0        0       0        0       0
 3/10 Virtual Ethernet          0       0        0       0        0       0
 3/11 Virtual Ethernet          0       0        0       0        0       0
 4/10 Virtual Ethernet          0       0        0       0        0       0
 4/11 Virtual Ethernet          0       0        0       0        0       0
 5/10 Virtual Ethernet          0       0        0       0        0       0
 5/11 Virtual Ethernet          0       0        0       0        0       0
Command #show cloud monitor di-network summary
This command monitors the health of the DI network. Cards are sending heartbeats to each other, and the Loss is monitored. In a healthy system, no loss is reported.
[local]UGP# show cloud monitor di-network summary
Card 3 Heartbeat Results:
ToCard   Health   5MinLoss   60MinLoss
   1      Good       0.00%      0.00%
   2      Good       0.00%      0.00%
   4      Good       0.00%      0.00%
   5      Good       0.00%      0.00%
Card 4 Heartbeat Results:
ToCard   Health   5MinLoss   60MinLoss
   1      Good       0.00%      0.00%
   2      Good       0.00%      0.00%
   3      Good       0.00%      0.00%
   5      Good       0.00%      0.00%
Card 5 Heartbeat Results:
ToCard   Health   5MinLoss   60MinLoss
   1      Good       0.00%      0.00%
   2      Good       0.00%      0.00%
   3      Good       0.00%      0.00%
   4      Good       0.00%      0.00%
Command #show iftask stats summary
With higher NPU loads, it might be possible that traffic is getting dropped.
To evaluate this, command #show iftask stats summary output can be taken.
Note: DISCARDS can be non-zero, all other counters ideally should remain 0.
[local]VPC# show iftask stats summary
Thursday January 18 16:01:29 IST 2018

-----------------------------------------------------------------------------------------------
Counter                               SF3         SF4         SF5         SF6         SF7         SF8         SF9         SF10         SF11         SF12         ___TOTAL___
------------------------------------------------------------------------------------------------
svc_rx                       32491861127   16545600654   37041906441   37466889835   32762859630   34931554543   38861410897   16025531220   33566817747   32823851780  312518283874
svc_tx                       46024774071   14811663244   40316226774   39926898585   40803541378   48718868048   35252698559    1738016438    4249156512   40356388348  312198231957
di_rx                        42307187425   14637310721   40072487209   39584697117   41150445596   44534022642   31867253533    1731310419    4401095653   40711142205  300996952520
di_tx                        28420090751   16267050562   36423298668   36758561246   32731606974   30366650898   35201117980   16009902791   33536789041   32815316570  298530385481
__ALL_DROPS__                    1932492           252         17742        790473         11228        627018        844812         60402             0        460830       4745249
svc_tx_drops                           0             0             0             0             0             0             0             0             0             0             0
di_rx_drops                            0             1             0             0            49           113           579         30200             0          4888         35830
di_tx_drops                            0             0             0             0             0             0             0             0             0             0             0
sw_rss_enq_drops                       0             0             0             0             0             0             0             0             0             0             0
kni_thread_drops                       0             0             0             0             0             0             0             0             0             0             0
kni_drops                              0             1             0             0             0             0           124         30200             0             0         30325
mcdma_drops                            0             0             0           168            80        194535        758500             0             0         11628        964911
mux_deliver_hop_drops                  0             0             0             0             0             0             0             0             0          1019          1019
mux_deliver_drops                      0             0             0             0             0             0             0             0             0             0             0
mux_xmit_failure_drops                 0             3             0             0             0             0             7             2             0             0            12
mc_dma_thread_enq_drops                0             0             0             0            49           113           580             0             0          3457          4199
sw_tx_egress_enq_drops           1904329             0             0        787971          9004        429214         85022             0             0        429810       3645350
cpeth0_drops                           0             0             0             0             0             0             0             0             0             0             0
mcdma_summary_drops                28163           247         17742          2334          2046          3043             0             0             0         10028         63603
fragmentation_err                      0             0             0             0             0             0             0             0             0             0             0
reassembly_err                         0             0             0             0             0             0             0             0             0             0             0
reassembly_ring_enq_err                0             0             0             0             0             0             0             0             0             0             0
__DISCARDS__                    20331090       9051092      23736055      23882896      23807520      24231716      24116576       8944291      22309474      20135799      20135799
SW-RSS and HW-RSS
RSS is a feature that is able to distribute inbound traffic coming from a NIC across multiple DPDK processors. Typically the NIC supports RSS in HW, enabling it to distribute traffic across multiple iftask cores.
The iftask process in Staros has implemented a software version of rss that can be enabled if:
-nic doesn't support HW rss (and hence all tx/rx traffic will land on a single iftask CPU).
-nic does not have enough tx/rx queues (less queues than available tx/rx CPU's assigned to iftask). In that case the SW-RSS (comprehensive) enables proper distribution across all available iftask cores assigned for rx/tx.
This feature only works for traffic coming in through service ports. DI traffic is not taken into account.
3 configurtion modes exist:
-no iftask sw-rss - sw-rss disabled. The system relies on HW RSS.
-iftask sw-rss comprehensive - using sw rss for all traffic. SW RSS can run together with HW RSS. No need to disable HW RSS. But the SW RSS will be responsible for the actual load balancing of SERVICE traffic to the iftask cores.
-iftask sw-rss supplemental - using sw rss for only the traffic that is not supported by hw-rss (example: MPLS traffic)
With both HW and SW RSS, it's important to understand how the traffic is hashed into the various iftask/dpdk processors.
HW RSS: hashing depends on the hardware. Below is an example:
[root@host]# ethtool -n enp10s0f1
4 RX rings available
Total 0 rules

[root@host] # ethtool -n enp10s0f0 rx-flow-hash udp4
UDP over IPV4 flows use these fields for computing Hash flow key:
IP SA
IP DA
SW RSS: Starting from Staros 21.6, the SW RSS version hashing behaves like this:
1. In case of IPV6
     we only support L3( IP src/dst ) based hashing (same as the old behaviour).
2. In case of IPV4
  a. For TCP we support IP src/dst + tcp ports src/dst
  b. For UDP fragmented - only IP src/dst
  c. For UDP non-fragmented not gtpu ( I.e. Port !=2152) ? IP src/dst + udp port src/dst
  d. For UDP non-fragmented and gtpu ( I.e. Port ==2152) - IP src/dst + udp port src/dst + gtp tunnel id
  e. Any other protocol ? we default back to IP src/dst
Important: RSS for encrypted DI traffic:
In the absence of SW-RSS (supplemental/comprehensive), it might be possible that all encrypted DI traffic is hashed into a single Core on iftask.
This will cause this core to consistently have higher utilization than the others.
Since CSCvi06080  , this can now be mitigated by this configuration command:
iftask di-net-encrypt-rss
After integration of CSCvm41257 , this option will be made default.
More detailed information on SW RSS:
The purpose of sw-rss is to load balance the PMD cores and avoid throughput limiting scenarios where one PMD core maxes out when the others have significant available capacity.
All service port ingress packets are pulled off NIC and given MEH encapsulation by the PMD core servicing the Rx queue on which they arrive.
At this point, iftask does not know where to send packet. Packets must be processed by VNPU to determine internal destination. Virtually all of these packets go through IOC/flow lookup when handed off to VNPU. The exceptions relate to discards for reasons like unconfigured/disabled vlan or invalid destination MAC (there’s also the L3 forwarding scenario, but this is uncommon).
If sw-rss is not configured, VNPU IOC/flow lookup processing occurs on same core immediately following MEH encap. If sw-rss is configured, packets are queued to a core for VNPU processing based on a hash. The VNPU IOC/flow lookup operation is the single most expensive iftask function; sw-rss allows us to balance that work load across all the PMD cores.
Following the VNPU IOC/flow lookup, the packet is either transmitted to another SF via DINet transmit or queued to local app via MCDMA transfer (again, there are exceptions, but I don’t believe them relevant to this discussion).
Packets sent to another SF are directly queued to appropriate MCDMA channel on the destination card following DINet Rx. They do not require a (second) VNPU pass.
TX/RX queues
In the iftask logs, we can see logs like:
Tue May 7 15:26:48 2019 PID:8188 APP: max rx queues supported 16 ...
Tue May 7 15:26:48 2019 PID:8188 APP: max tx queues supported 8 ...
Tue May 7 15:26:48 2019 PID:8188 APP: hw rx requested 2 ...
Tue May 7 15:26:48 2019 PID:8188 APP: hw tx requested tx 5
This related to the supported number of rx and tx queues that the actual hardware supports vs the number of tx/rx queues that iftask requests.
What iftask requests is closely related to the number of processors allocated to iftask.
Note: Every driver is different. Some query host, some have hardcoded.
The hw tx requested count is the number of cores dpdk is using. This is typically one more than the total cores allocated to iftask because dpdk includes the core on which the control/ipc thread runs. This core is shared with boxer and scheduled as a general purpose cpu (the dpdk control/ipc thread does not use a lot of cpu).
The hw rx requested count is typically the number of PMD cores.
Iftask allocates the min (requested, max) for each port and distribute them across the cores. The distribution algorithm is a bit complicated. The goal is to distribute the work load as evenly as possible across all the cores.
Iftask txbatch
Since Release 21.9, staros has the following default iftask configuration options that are important for batching (aggregating traffic). This has some negative impact on performance when the node is under test with single (or few) subscribers.
# iftask mcdmatxbatch burst size 32
# iftask mcdmatxbatch latency 200
# iftask txbatch burst size 32
# iftask txbatch latency 200
More explanation on this is in a separate:
Bulkstats
Bulkstat scheme is developed for QPVC-DI performance related to iftask/dinet. This is useful for monitoring the dinet, service ports, and npu utilization from a performance/load perspective:
card schema iftask-dinet format EMS,IFTASKDINET,%date%,%time%,%dinet-rxpkts-curr%,%dinet-txpkts-curr%,%dinet-rxpkts-5minave%,%dinet-txpkts-5minave%,%dinet-rxpkts-15minave%,%dinet-txpkts-15minave%,%dinet-txdrops-curr%,%dinet-txdrops-5minave%,%dinet-txdrops-15minave%,%npuutil-now%
   file 2
port schema iftask-port format EMS,IFTASKPORT,%date%,%time%,%util-rxpkts-curr%,%util-txpkts-curr%,%util-rxpkts-5min%,%util-txpkts-5min%,%util-rxpkts-15min%,%util-txpkts-15min%,%util-txdrops-curr%,%util-txdrops-5min%,%util-txdrops-15min%
  file 3
card schema npu-util format EMS,NPUUTIL,%date%,%time%,%npuutil-now%,%npuutil-5minave%,%npuutil-15minave%,%npuutil-rxbytes-5secave%,%npuutil-txbytes-5secave%,%npuutil-rxbytes-5minave%,%npuutil-txbytes-5minave%,%npuutil-rxbytes-15minave%,%npuutil-txbytes-15minave%,%npuutil-rxpkts-5secave%,%npuutil-txpkts-5secave%,%npuutil-rxpkts-5minave%,%npuutil-txpkts-5minave%,%npuutil-rxpkts-15minave%,%npuutil-txpkts-15minave%
Revision History
| Revision | Publish Date | Comments |
|---|---|---|
1.0 |
09-Jun-2018
|
Initial Release |
Contributed by Cisco Engineers
- Steven Loos
 Feedback
Contact Cisco
- Open a Support Case

- (Requires a Cisco Service Contract)