Introduction
This document describes IW Monitor; a tool for monitoring and troubleshooting a Cisco URWB network.
Background Information
IW Monitor is an on-premise application that provides robust monitoring capabilities, including a dashboard for real-time status updates, a topology view, and both real-time and historical wireless KPI tracking.
It also offers historical event reporting and supports both IW devices and legacy URWB radios, ensuring broad compatibility across various deployments.
Installation
Step 1:
Download and install Docker by following the instructions at https://docs.docker.com/engine/install/.
Step 2:
Obtain the latest version of the IW Monitor software from Cisco Software Central by searching for "IW Monitor."
Step 3:
Load the IW Monitor Docker image using this command:
docker load -i iw-monitor-docker-v2.1.tar.gz
Step 4:
Verify that the IW Monitor image has been loaded by entering:
docker images
Step 5:
Start the Docker container for IW Monitor by running:
docker run -d --name iw_monitor -p 8080:8080 -p 8443:8443 --restart always <IMAGE_ID>
Replace <IMAGE_ID> with the actual IMAGE ID value of the IW Monitor Docker image.
IW-Monitor Initial Setup
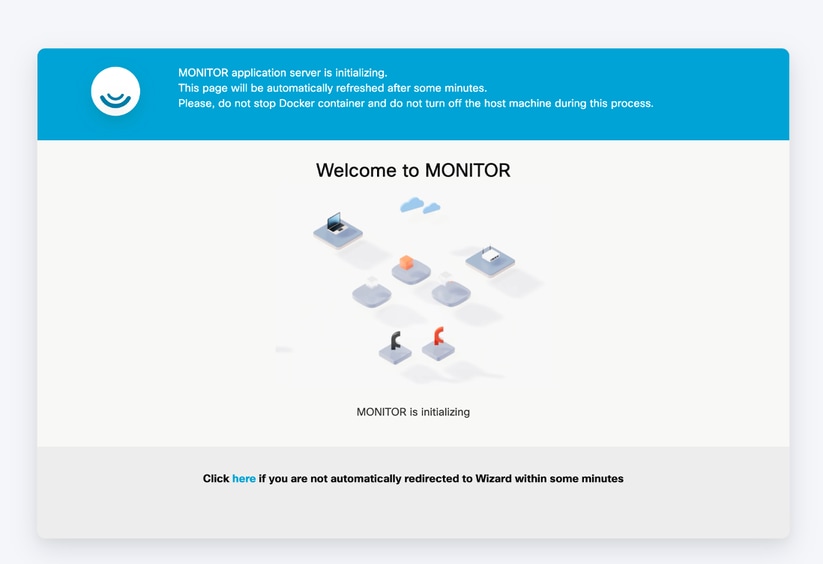
- From your browser, navigate to the URL https://X:Y where X is the IP address of the MONITOR server, and Y is the chosen host port number (For example, 8443).
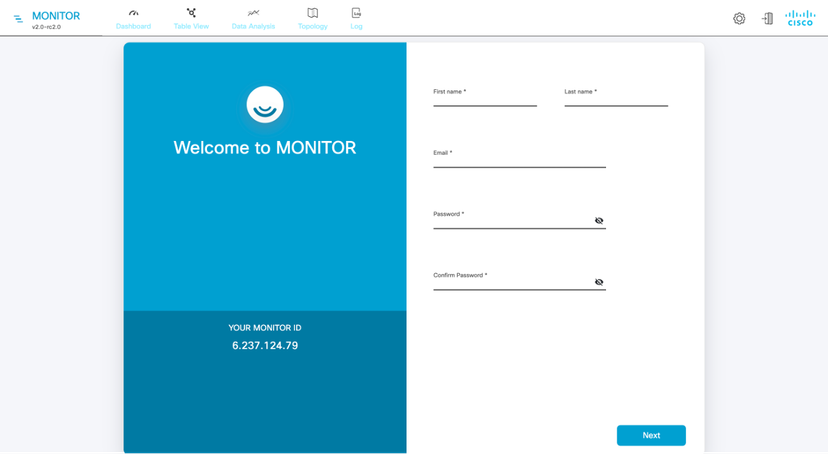
- Create an account as required for access and authentication.
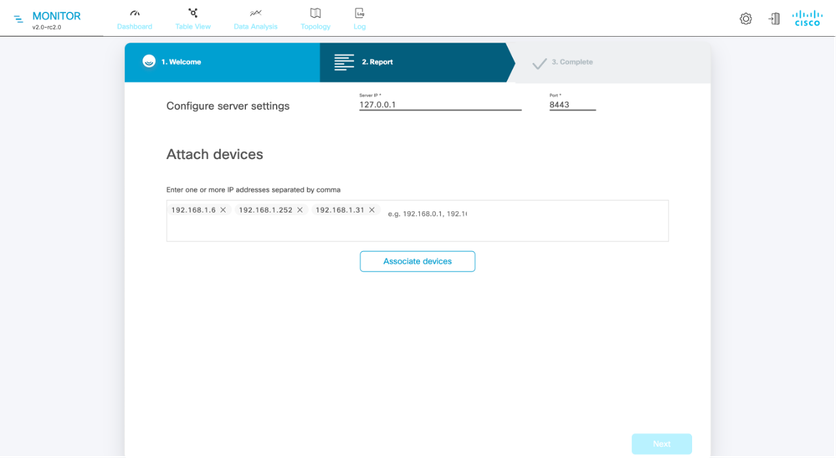
- Type the IP address of the devices, separated by commas and click Next.
The Attach report pop up indicates that attaching the devices was successful.
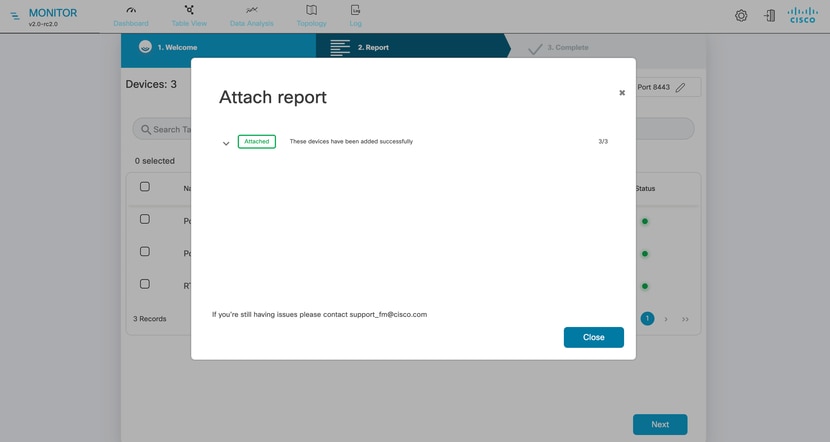
- After the devices are attached and the DONE button is clicked, this screen appears.
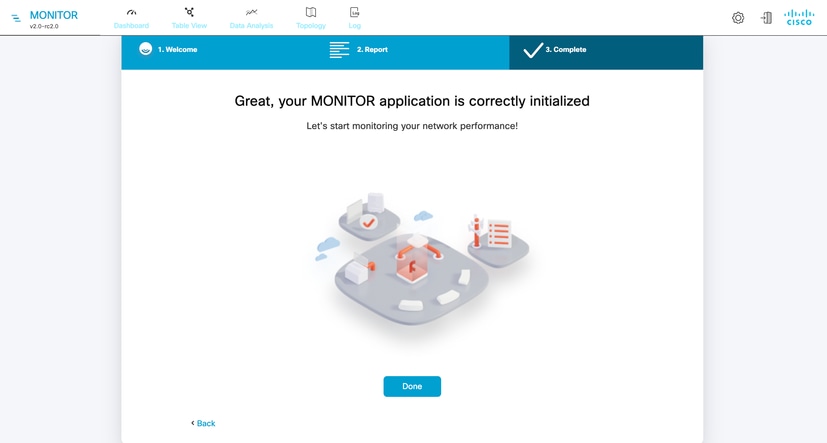
Finally, it launches the Dashboard.
Customization
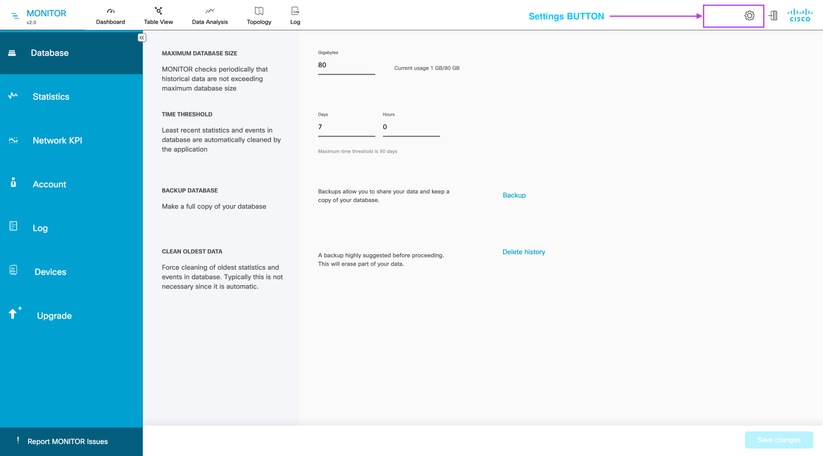
- Most of the system customizations are done using the settings page. These customizations are allowed:
- Database Size limit, How old data is kept in database, and data base backups
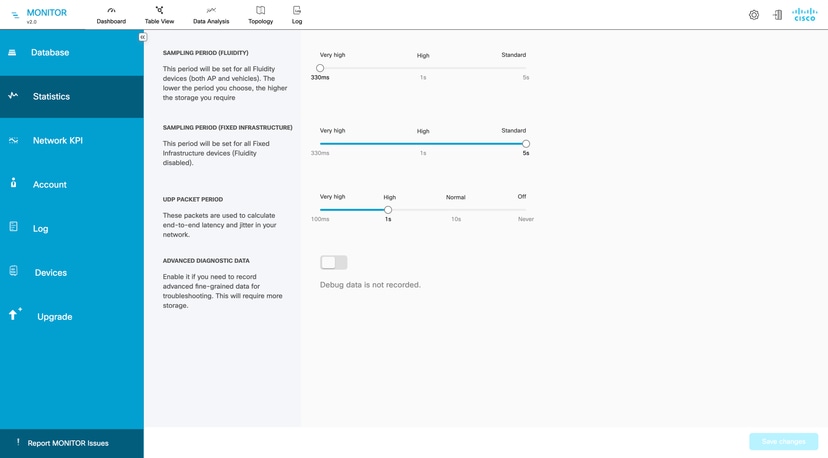
- Data Sample period can be customized from Statistics page, based on different application this sampling period can change.
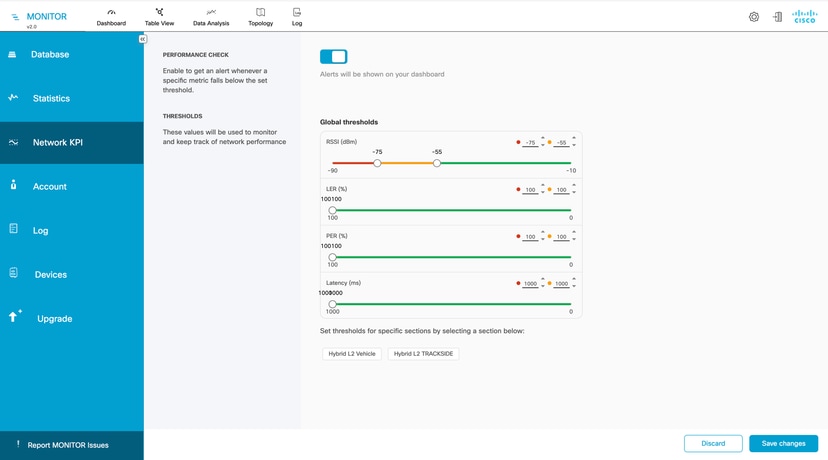
- By Default network KPI alerts are disabled, but these can be enabled if needed also alerts can be set either globally or Section-wise.
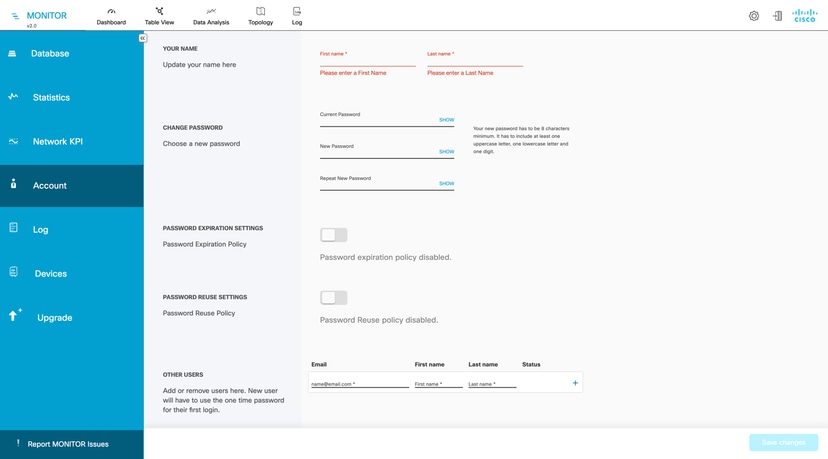
- From Account page multiple users can be created.
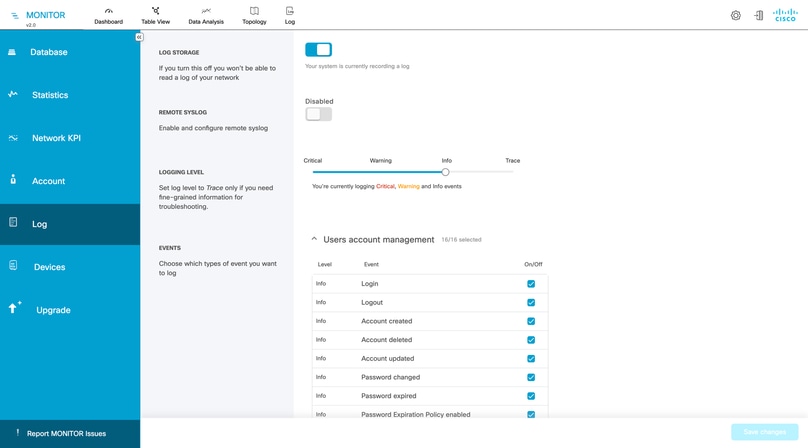
- If data logging is enabled, logging levels and specific parameters can be set for event recording, with the option to send logs to a remote syslog server; logging for individual events can be toggled on or off by selecting the square next to each event listing, and the user can turn any log message off or on.
Category of events
- Users account management
- RADIUS events
- Network events/failures
- Settings
- Devices management
- Configuration changes
- Network performance
- Database
- System
- Titan (Fast-Failover)
- Ethernet Port
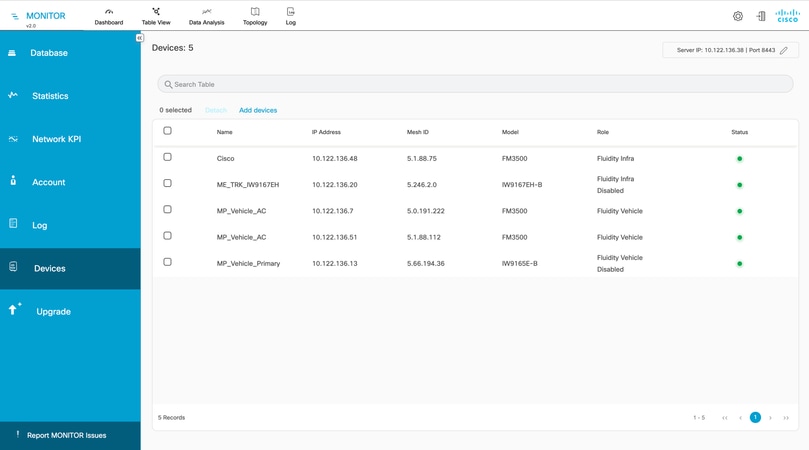
- The Devices page shows the list of current devices on the system and provides a way to add new devices or detach existing ones.
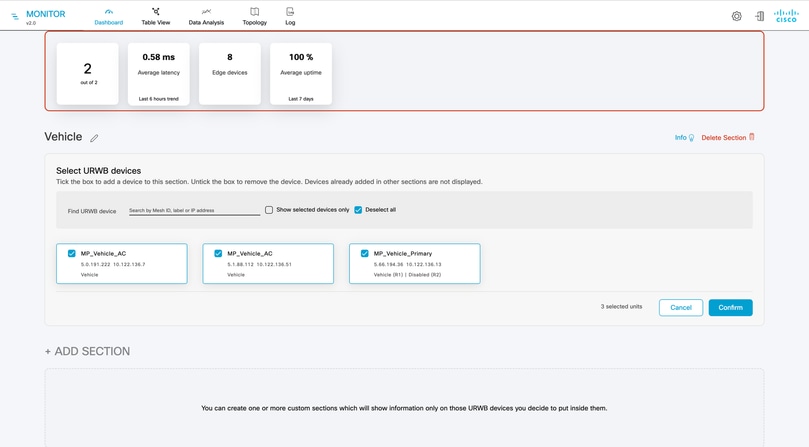
To add devices to a section, click the ADD SECTION button, then enter the IP addresses or Mesh ID numbers of the relevant devices or select the devices from the list, and click Confirm.
To add devices to an existing section, click Edit for the section, enter the IP addresses or Mesh ID numbers (or select devices from the list), and click Confirm. Sections can also be deleted from this page.
IW-Monitor Troubleshooting
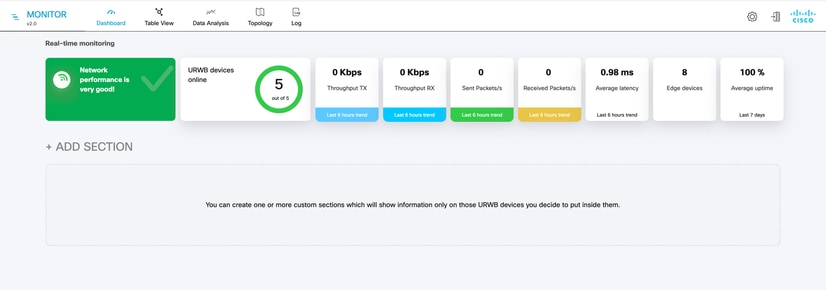
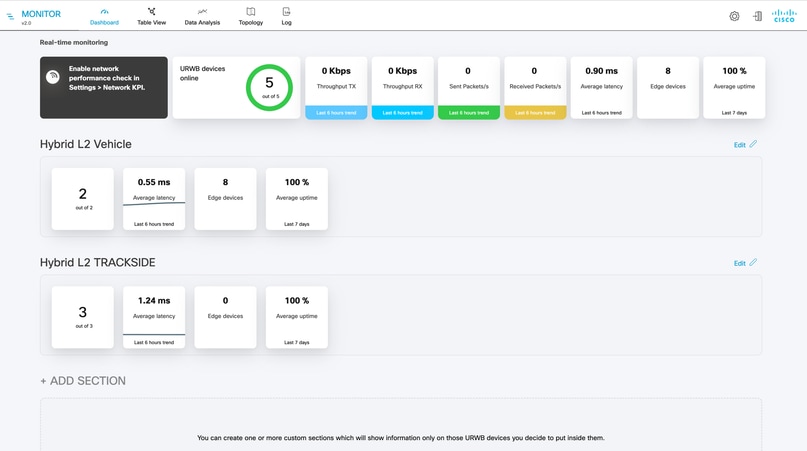
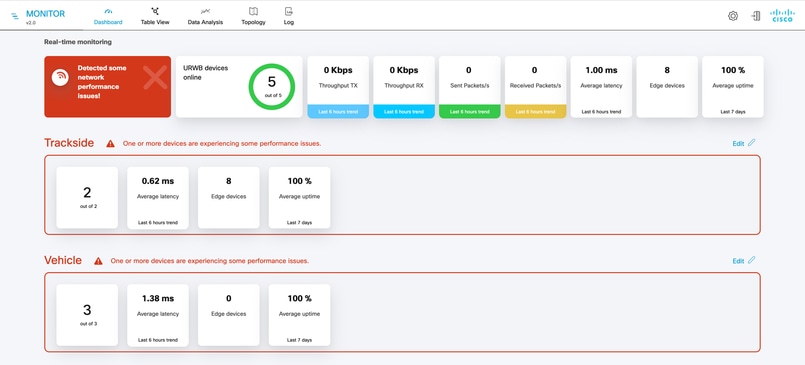
The Dashboard provides an overview of system status, including connected devices, throughput, latency, edge device count, and uptime.
If the network is divided into sections, the dashboard displays statistics for each section, with options to edit and manage device groupings.
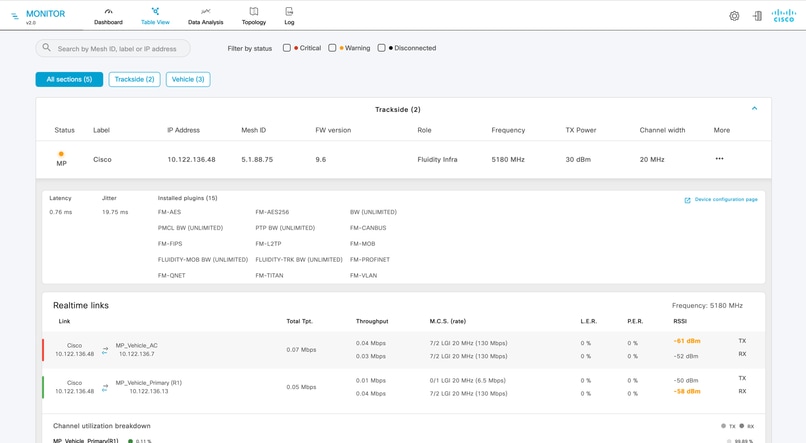
The Table view offers a detailed overview of unit configuration and status, displaying devices by section with information such as status, Mesh ID, IP address, frequency, channel width, and firmware version.
Status icons indicate connectivity and performance: gray for disconnected, green for normal operation, and orange or red for threshold alerts. Additional details are available by clicking the icon in the More column.
Clicking the More link in the Table view displays detailed wireless KPIs for the selected link, including RSSI, MCS, throughput, LER, and PER for both upstream and downstream.
For vehicle units, the connected access point is shown; for trackside units, all KPIs for each link to connected vehicles are displayed.
Additional information includes latency, jitter, active plugins, attached devices, and a channel utilization breakdown.
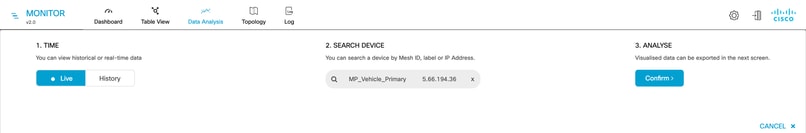
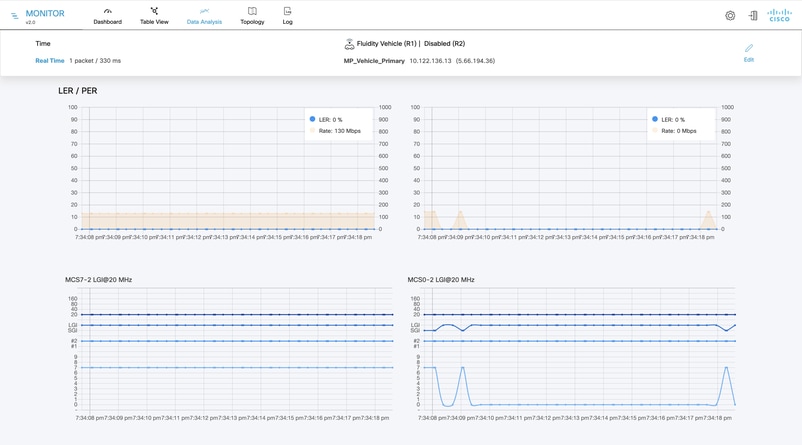
The Data Analysis section provides tools for in-depth analysis and troubleshooting of specific units using live or recorded data.
To begin, enter the Mesh ID, IP address, or device name label, and confirm the process to trace and analyze connections for the selected device.
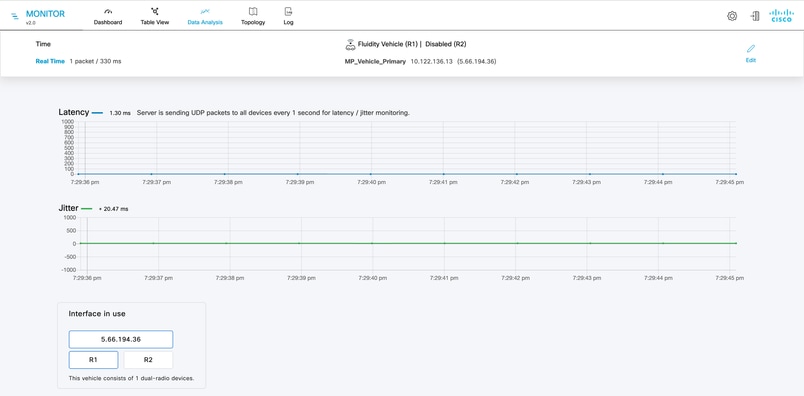
The server sends UDP packets to all attached devices at intervals defined in the Statistics settings to measure latency and jitter.
In this scenario, a UDP packet is sent to each unit every second, while packets sent every 330 milliseconds are used for mobility KPI sampling.
Latency between the unit and server typically averages under 1 millisecond, and jitter is as close to zero as possible, indicating a stable connection.
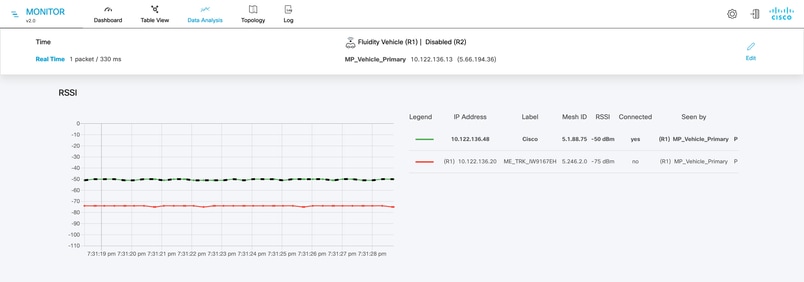
The RSSI graph displays the received signal strength from all vehicles visible to the access point, along with information about each vehicle and its connection status.
Vehicles connected to the access point, typically those with the strongest signals, are clearly identified.
For devices equipped with dual radios, the graph allows toggling between signal information for each radio.
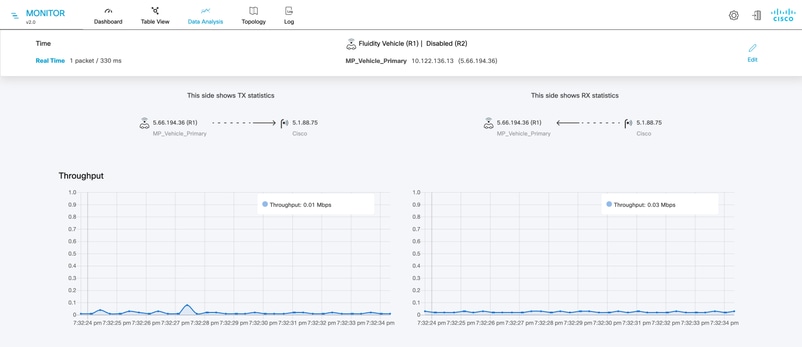
The Throughput graph displays data traffic statistics for the link, showing both upstream (vehicle to access point) and downstream (access point to vehicle) traffic.
Upstream traffic is presented on the left side of the graph, while downstream traffic is shown on the right.
The graphs display LER, PER, and wireless rate statistics for both upstream and downstream traffic between the access point and the vehicle.
The lower section presents MCS values, the number of spatial streams used, and the interval between packet transmissions.
A Small Guard Interval of 400 nanoseconds is shown, indicating higher potential throughput compared to a larger guard interval.
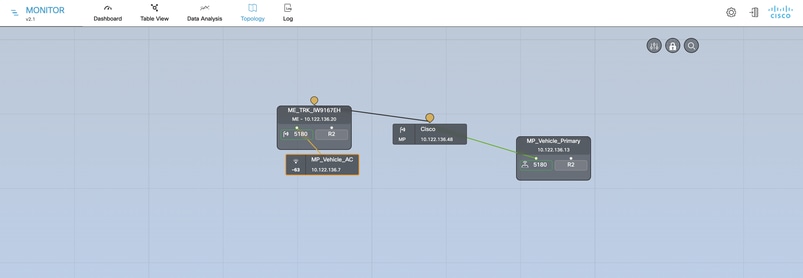
Topology section allows customer to view the entire network topology.
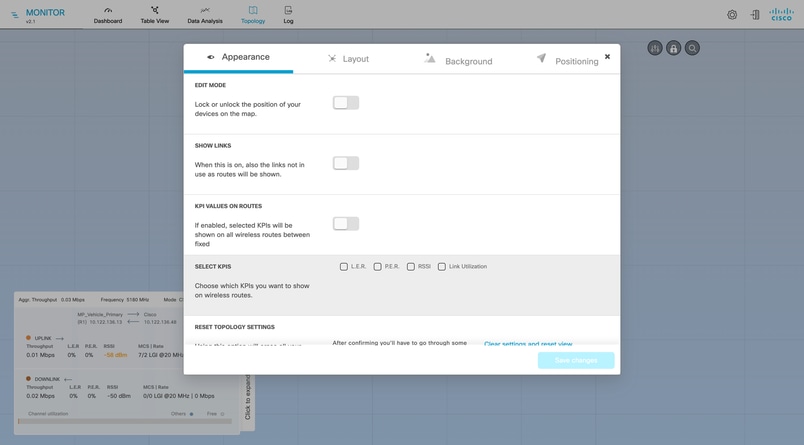
The Appearance and Background settings window allows customization of which KPIs—such as link error rate, packet error rate, RSSI, and link utilization—are displayed for wireless links.
The colors of wireless links and device nodes reflect the status of key metrics, with each link or node shown according to the most critical KPI status; for example, if one KPI is yellow, but another is red, the link and nodes are displayed in red.
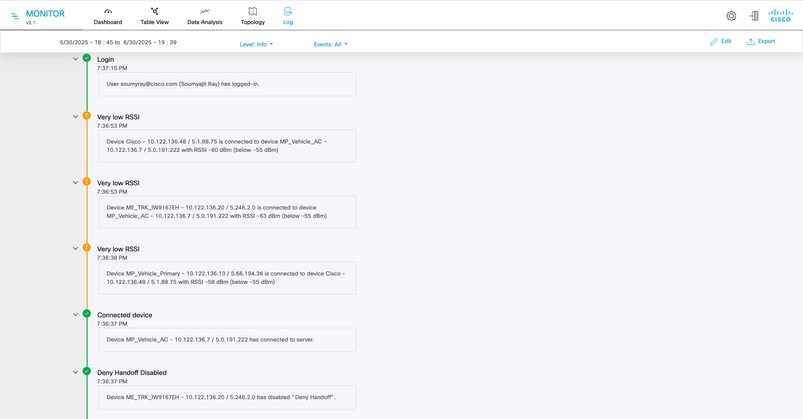
The VIEW LOG feature allows logs to be viewed for a specified time period, providing details on errors, status, and other user-specified event categories.
Logging levels can be customized to capture relevant events as they occur, aiding in system performance analysis over time. To access logs, click the ‘Log’ icon, define the desired time period, and click ‘Confirm.’
Filters can be applied for more targeted analysis, and logging levels can be adjusted via the ‘Level’ drop-down menu.
Logs can also be exported for reference. Click the Export button, confirm the export period, and validate the request to download a CSV file named in the format monitor_log_YYYY-MONTH-DAY.csv.
 Feedback