Nexus 7000 Storm Control: Selecting appropriate suppression values
Available Languages
Download Options
Bias-Free Language
The documentation set for this product strives to use bias-free language. For the purposes of this documentation set, bias-free is defined as language that does not imply discrimination based on age, disability, gender, racial identity, ethnic identity, sexual orientation, socioeconomic status, and intersectionality. Exceptions may be present in the documentation due to language that is hardcoded in the user interfaces of the product software, language used based on RFP documentation, or language that is used by a referenced third-party product. Learn more about how Cisco is using Inclusive Language.
Contents
Introduction
A traffic storm occurs when packets flood the LAN, creating excessive traffic and degrading network performance. You can use the traffic storm control feature to prevent disruptions on Layer 2 ports by a broadcast, multicast, or unicast traffic storm on physical interfaces.
Traffic storm control (also called traffic suppression) allows you to monitor the levels of the incoming broadcast, multicast, and unicast traffic over a 10-millisecond interval. During this interval, the traffic level, which is a percentage of the total available bandwidth of the port, is compared with the traffic storm control level that you configured. When the ingress traffic reaches the traffic storm control level that is configured on the port, traffic storm control drops the traffic until the interval ends.
The traffic storm control threshold numbers and the time interval allow the traffic storm control algorithm to work with different levels of granularity. A higher threshold allows more packets to pass through.
By default, the Cisco Nexus Operating System (NX-OS) software takes no corrective action when the traffic exceeds the configured level. However, you can configure an Embedded Event Management (EEM) action to error-disable an interface if the traffic does not subside (drop below the threshold) within a certain time period
Guidelines and Limitations for Traffic Storm Control
When configuring the traffic storm control level, note the following guidelines and limitations:
- You can configure traffic storm control on a port-channel interface.
- Do not configure traffic storm control on interfaces that are members of a port-channel interface. Configuring traffic storm control on interfaces that are configured as members of a port channel puts the ports into a suspended state.
- Specify the level as a percentage of the total interface bandwidth:
- The level can be from 0 to 100.
- The optional fraction of a level can be from 0 to 99.
- 100 percent means no traffic storm control.
- 0 percent suppresses all traffic.
Because of hardware limitations and the method by which packets of different sizes are counted, the level percentage is an approximation. Depending on the sizes of the frames that make up the incoming traffic, the actual enforced level might differ from the configured level by several percentage points.
Default Settings for Traffic Storm Control
|
Parameters |
Default |
|
Traffic storm control |
Disabled |
|
Threshold percentage |
100 |
Configuring Traffic Storm Control
You can set the percentage of total available bandwidth that the controlled traffic can use.
- configure terminal
- interface {ethernet slot/port | port-channel number}
- storm-control {broadcast | multicast | unicast} level percentage[.fraction]
Note: Traffic storm control uses a 10-millisecond interval that can affect the behavior of traffic storm control.
Verifying Traffic Storm Control Configuration
To display traffic storm control configuration information, perform one of the following tasks:
|
Command |
Purpose |
|
show interface [ethernet slot/port | port-channel number] counters storm-control |
Displays the traffic storm control configuration for the interfaces. |
|
show running-config interface |
Displays the traffic storm control configuration. |
Monitoring Traffic Storm Control Counters
You can monitor the counters the Cisco NX-OS device maintains for traffic storm control activity.
switch# show interface counters storm-control
Nexus 7000 Storm Control: Selecting appropriate suppression values
To help customer select appropriate threshold value, this section provides insight on the logic behind using the threshold values.
Note: the information presented here does not provide any best practice numbers but customer can arrive at a logical decision after going through the information.
Components Used
The information in this document is based on these software and hardware versions:
- Nexus 7700 with Release 6.2.12 and later.
- F3 series line card.
The information in this document was created from the devices in a specific lab environment. All of the devices used in this document started with a cleared (default) configuration. If your network is live, make sure that you understand the potential impact of any command.
Lab testing
Storm control is a traffic suppression mechnicm which is applied to the ingress traffic on a particular port.
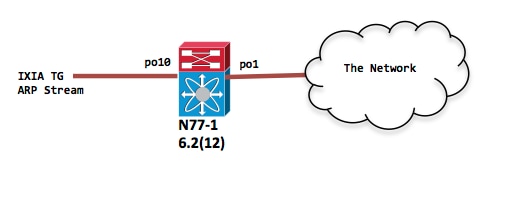
N77-1(config-if)# sh port-c sum
1     Po1(SU)     Eth     LACP     Eth2/4(P)
10    Po10(SU)    Eth     LACP     Eth1/1(P)

interface port-channel1
switchport

interface port-channel10
switchport
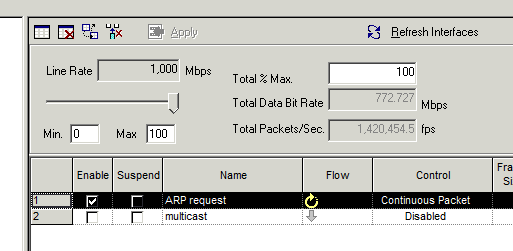
Scenerio 1 : Supression rate is 0.01%
Ingress traffic rate is set to 1Gbps of ARP request traffic
Config
interface port-channel10
storm-control broadcast level 0.01
IXIA snapshot for reference
N77-1(config-if)# sh int po10 | in rate | in "30 sec"
   30 seconds input rate 954649416 bits/sec, 1420607 packets/sec
   30 seconds output rate 1856 bits/sec, 0 packets/sec
input rate 954.82 Mbps, 1.42 Mpps; output rate 1.97 Kbps, 0 pps

N77-1(config-if)# sh int po1 | in rate | in "30 sec"
   30 seconds input rate 8656 bits/sec, 8 packets/sec
   30 seconds output rate 853632 bits/sec, 1225 packets/sec >>>> Output rate is ~ 1200 pps
input rate 8.74 Kbps, 8 pps; output rate 875.32 Kbps, 1.22 Kpps

N77-1# sh int po10 counters storm-control
--------------------------------------------------------------------------------
Port        UcastSupp %     McastSupp %     BcastSupp %     TotalSuppDiscards
--------------------------------------------------------------------------------
Po10             100.00          100.00            0.01           67993069388
The storm control drops are shown for reference.
Scenerio 2 : Supression rate is 0.1%
Ingress traffic rate is set to 1Gbps of ARP request traffic
Config
interface port-channel10
storm-control broadcast level 0.10
Only going to show the egress interface since the ingress interface po10 has the same incoming traffic rate of 1gbps
N77-1(config-if)# sh int po1 | in rate | in "30 sec"
   30 seconds input rate 8840 bits/sec, 8 packets/sec
   30 seconds output rate 8253392 bits/sec, 12271 packets/sec >>>> Output rate is ~ 12k pps
Scenerio 3 : Supression rate is 1%
Ingress traffic rate is set to 1Gbps of ARP request traffic
Config
interface port-channel10
storm-control broadcast level 1
Only going to show the egress interface since the ingress interface po10 has the same incoming traffic rate of 1gbps
N77-1(config-if)# sh int po1 | in rate
   30 seconds input rate 8784 bits/sec, 7 packets/sec
   30 seconds output rate 86601056 bits/sec, 129293 packets/sec >>>> Output rate is ~ 120k pps
   input rate 8.78 Kbps, 7 pps; output rate 86.60 Mbps, 129.29 Kpps
Scenerio 4 : Supression rate is 10%
Ingress traffic rate is set to 1Gbps of ARP request traffic
Config
interface port-channel10
storm-control broadcast level 10.00
 N77-1(config-if)# sh int po1 | in rate
   30 seconds input rate 8496 bits/sec, 7 packets/sec
   30 seconds output rate 839570968 bits/sec, 1249761 packets/sec >>>> Output rate is ~ 1.2mil pps
   input rate 8.50 Kbps, 7 pps; output rate 839.57 Mbps, 1.25 Mpps
Summary:
All the above scenerios deal with sustained traffic stream possibly caused due to a loop or a malfunctioning NIC. Storm control is effective in this scenario in rate limiting the traffic before it is injected into the network. The different suppression levels tell how how much traffic you will be injecting into your network.
When storm control is in place, would it cause normal ARP to get dropped if you keep the threshold at an aggressive level?
There are a few things to consider
- First and foremost, if ARP does get dropped first time there are always retries initiated by the application layer so the chances of ARP getting resolved during subsequent retries are higher and will lead to successful IP to MAC resolution.
- Storm control is an ingress policer and it should be applied as close to the edge as possible. So you maybe dealing with one physical hosts or a VM cluster. If one host then the number of ARPs is not really a problem during a normal working scenario. If this is a VM cluster, then you may have certain number of hosts but again nothing that will indicate an entire layer 2 domain behind an edge port.
- If you apply storm control config on core ports then be aware of how broadcast traffic can get aggregated before it reaches the core layer.
Going back to our tests – for bursty ARP traffic here are some of the tests-
Test 1: 5000 packets burst @ 5000pps single burst
Supression level 0.01%
Config
interface port-channel10
storm-control broadcast level 0.01
N77-1# sh int po10
port-channel10 is up
admin state is up
RX
   12985158 unicast packets 27 multicast packets 5000 broadcast packets
   12990674 input packets 1091154042 bytes
   0 jumbo packets 2560 storm suppression packets

N77-1#Sh int po1
port-channel1 is up
admin state is up
TX
   0 unicast packets 507 multicast packets 2440 broadcast packets

N77-1(config-if)# sh int po10 counters storm-control
--------------------------------------------------------------------------------
Port       UcastSupp %     McastSupp %     BcastSupp %     TotalSuppDiscards
--------------------------------------------------------------------------------
Po10             100.00         100.00            0.01                 2560
The above shows 2560 dropped ARP packets. Of course, if you have 5000 hosts behind one interface then half of them get through during the first iteration and the second half will get through during the next or so on. If your application is only sending one ARP request to get the IP to MAC resolution then the application may need to be modified to retransmit ARP requests if no response. In this case, check with the application vendor for assistance in changing this behavior.
Test 2: 5000 packets burst @ 50000pps single burst
Supression level 0.01%
Config
interface port-channel10
storm-control broadcast level 0.01
N77-1(config-if)# sh int po10
port-channel10 is up
admin state is up
RX
   0 unicast packets 19 multicast packets 5000 broadcast packets
   5019 input packets 435550 bytes
   0 jumbo packets 3771 storm suppression packets

N77-1(config-if)# sh int po1
port-channel1 is up
admin state is up
TX
   0 unicast packets 712 multicast packets 1229 broadcast packets

N77-1(config-if)# sh int po10 counters storm-control
--------------------------------------------------------------------------------
Port       UcastSupp %     McastSupp %     BcastSupp %     TotalSuppDiscards
--------------------------------------------------------------------------------
Po10             100.00         100.00           0.01                 3771
In the above output there are a higher number of drops due to the higher rate of packet burst.
Similar results are seen as the pps rate is increased for 5000 packet burst @ 100kpps till a 1 gbps packet rate
Following options are available for the detection of the storm condition.
Alerting at data plane:
- Configuring storm control generates syslog message for alerts and you can tie in EEM to generate Simple Network Management Protocol (SNMP) traps or shutdown the port as a preventative action.
Alerting at Control plane:
- Configure 'logging drop threshold' option:
On Nexus 7k there is a default policy-map - control-plane:
This policy map is regulating which traffic is passing to CPU. Within this policy-map you can see a class which is regulating how much ARP goes to CPU.
Configuring 'logging drop threshold' under this class will report any violations in syslog, you can further use EEM to generate SNMP trap.
- Control Plane Policing (CoPP) MIB polling
Starting in NX-OS 6.2(2), CoPP supports the Cisco Class-Based QoS MIB (cbQoSMIB) and all its elements can be monitored using SNMP
Conclusion
Storm Control is the useful feature which prevents disruptions on Layer 2 ports by a broadcast, multicast, or unicast traffic storm on physical interfaces. This feature controls the storm at the data plane before it impacts the control-plane and CoPP.
Contributed by Cisco Engineers
 Feedback
Contact Cisco
- Open a Support Case

- (Requires a Cisco Service Contract)