Troubleshoot Secure Web Appliance Latency
Available Languages
Download Options
Bias-Free Language
The documentation set for this product strives to use bias-free language. For the purposes of this documentation set, bias-free is defined as language that does not imply discrimination based on age, disability, gender, racial identity, ethnic identity, sexual orientation, socioeconomic status, and intersectionality. Exceptions may be present in the documentation due to language that is hardcoded in the user interfaces of the product software, language used based on RFP documentation, or language that is used by a referenced third-party product. Learn more about how Cisco is using Inclusive Language.
Contents
Introduction
This document describes the troubleshooting steps to tackle High Latency, High Disk, and High CPU in Cisco Secure Web Appliance (SWA).
Prerequisites
Requirements
Cisco recommends that you have knowledge of these topics:
- Cisco SWA administration
-
Proxy deployment methods (Explicit and Transparent)
- SWA Command Line Interface (CLI) commands
Components Used
This document is not restricted to specific software and hardware versions.
The information in this document was created from the devices in a specific lab environment. All of the devices used in this document started with a cleared (default) configuration. If your network is live, ensure that you understand the potential impact of any command.
Background Information
When contacting Cisco Technical Support, you are asked to provide details on the SWA outbound and inbound network activity, which can be monitored by running a packet capture to collect traffic for debugging or verification purposes.
Frequent Causes of High Latency in SWA
In general, there are three main categories for the high latency in SWA:
1. Inadequate SWA Sizing or Overloaded Resources
2. Complex Configurations
3. Network-Related Latency Issues
One of the most common causes of high latency in SWA is inadequate sizing of the solution. Proper sizing is critical to ensure that the SWA system has sufficient resources to handle current and expected workloads. If the system is undersized, it can struggle to process requests efficiently, leading to delays in operations and reduced performance. Factors such as the number of users, volume of decryption, and specific scanning demands must be carefully evaluated during deployment to avoid resource constraints. Failure to align the SWA capacity with organizational needs can result in persistent latency and degraded user experience.
Complex configurations can degrade performance and cause latency on the SWA, especially under high load, as each request must be processed through numerous conditions.
Network-related latency can stem from the SWA itself, third-party services like Active Directory, DLP, DNS, or from network delays between the client, SWA, and upstream servers.
Analyzing the requests sent to the SWA, including identifying the top users and the most accessed URLs, can help uncover potential misbehavior and pinpoint the root causes of latency. This information is invaluable for diagnosing performance issues, managing bandwidth consumption, and ensuring appropriate usage of the system.
SWA Latency Troubleshooting Tools
System Status
Use these steps to check the current resource consumption in SWA:
Step 1. Access the SWA Graphical User Interface (GUI).
Step 2. Navigate to Reporting > System Information > System Status.
Step 3. Check these critical metrics to assess system performance:
- CPU Usage (%): Indicates the current CPU load
- RAM Usage (%): Reflects the memory utilization
- Reporting/Logging Usage (%): Shows the percentage of disk space being used for reporting and logging
- System Uptime: Displays the total time the system has been running without a restart
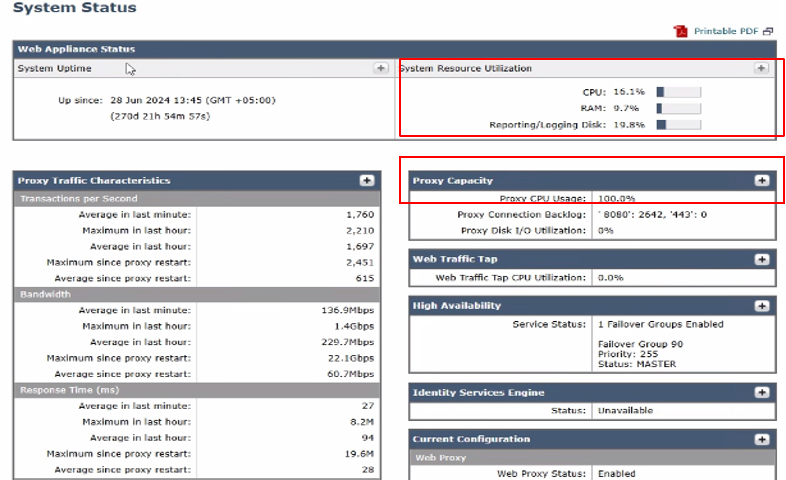 Image- System Status
This page provides an overview of the current status of RAM, CPU, and disk usage. To view resource usage over time, from SWA GUI, navigate to Reporting and choose System Capacity.
System Capacity
The System Capacity page in the SWA provides a comprehensive view of resource utilization and performance metrics over a specified time range. This page offers detailed graphs to help monitor and analyze system behavior, ensuring optimal performance and identifying potential bottlenecks.
Available Graphs and Metrics in System Capacity page are:
- Overall CPU Usage: Displays the total CPU usage, giving a high-level overview of system performance.
- CPU Usage by Function: Breaks down CPU usage based on specific functions, including:
- Web Proxy
- Logging
- Reporting
- McAfee
- Sophos
- Webroot
- Acceptable Use and Reputation
3. Response Time/Latency (milliseconds): Tracks response times to identify any delays in processing requests.
4. Transactions Per Second: Shows the number of transactions being handled by the SWA per second.
5. Connections Out: Monitors the number of outbound connections being established.
6. Bandwidth Out (Bytes): Measures the amount of outbound bandwidth being utilized.
7. Proxy Buffer Memory (%): Displays the percentage of memory used by the proxy process.
Check the metrics for any signs of high resource usage in this dashboard.
 Image- System Capacity
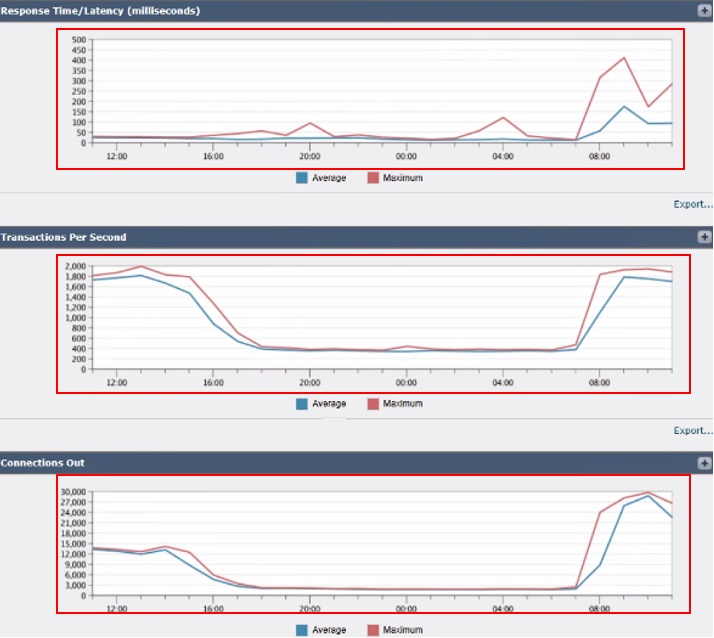 Image- SWA Transactions Per Second and Connections Out
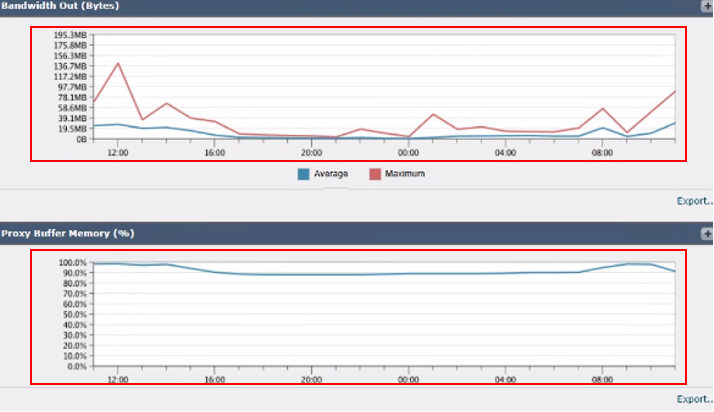 Image- SWA Memory Usage
Analyze Top Destinations
To analyze top destinations, navigate to the SWA GUI, navigate to Reporting, and select Websites. Review the list of top HTTP/HTTPS websites and identify high-traffic or frequently accessed domains.
Based on your findings, consider bypassing or exempting generic URLs, such as Microsoft Updates, Adobe, Office365, and online meeting platforms. This approach helps reduce traffic on the SWA, leading to lower latency and a reduced proxy processing load.
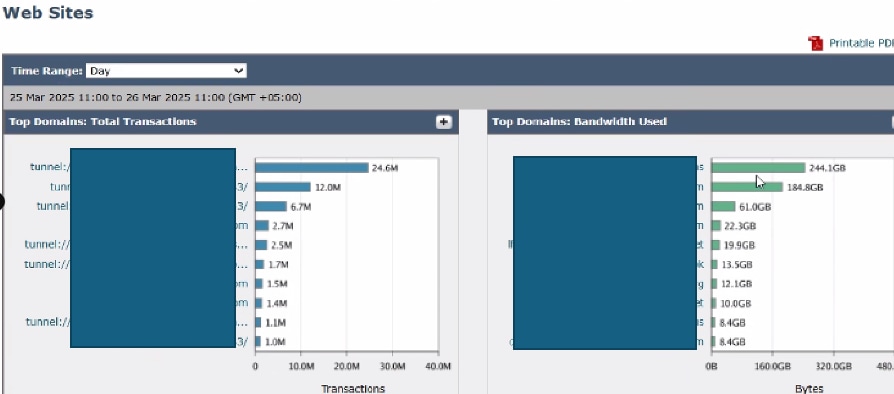 Image- SWA Top Websites Dashboard
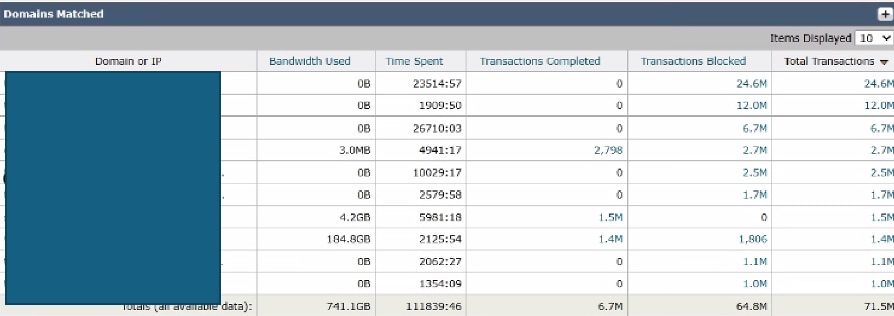 Image- SWA Top Domains Dashboard
Analyze Top Users
To identify potential sources of excessive traffic, navigate to the SWA GUI from Reporting choose Users.
Review the list to determine which users are generating the highest number of transactions to the SWA. Additionally, check for user machines that are generating the highest number of transactions to the SWA and consuming the maximum bandwidth.
This analysis can help pinpoint users or devices responsible for significant traffic loads, enabling targeted actions to reduce overall system strain.
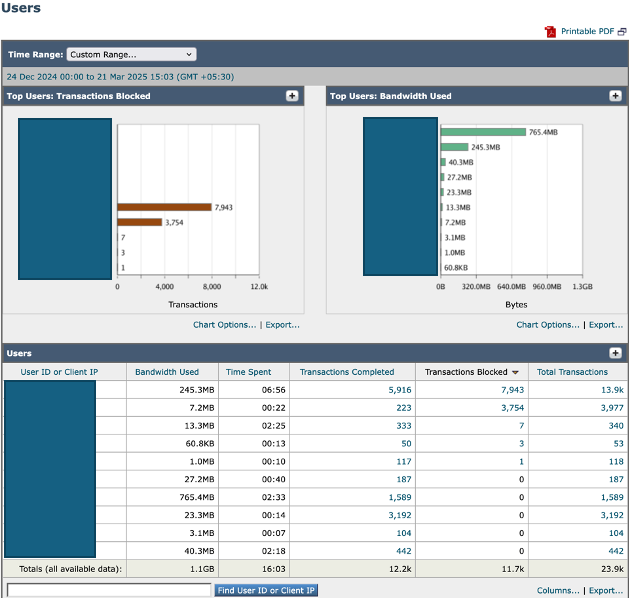 Image-SWA Top Users Dashboard
SHD Logs
By reviewing the SHD_log, you can analyze some of the performance metrics such as number of sessions from users to SWA (CliConn), number of sessions from SWA to the Internet (SrvConn), the average requests per seconds (Reqs) and so on.
For more information about the SHD Log, refer to link Troubleshoot Secure Web Appliance Performance with SHD Logs,
Some key Parameters to review in the SHD logs are:
- ClientConns: Number of active client connections
- ServerConns: Number of active server connections
- ProxLd: Average Proxy process load
- CPULD: Average overall CPU load
- RAMUTIL: RAM utilization
- Latency: Average service time in one minute
- DiskUtil: Disk usage and I/O performance
As in this example, having around 1,600 Requests per Seconds, leads to high proxy process load.
Wed Mar 26 11:09:30 2025 Info: Status: CPULd 16.3 DskUtil 19.9 RAMUtil 9.3 Reqs 1661 Band 152966 Latency 4245 CacheHit 3 CliConn 27180 SrvConn 24356 MemBuf 93 SwpPgOut 222877 ProxLd 100 Wbrs_WucLd 0.0 LogLd 0.0 RptLd 0.0 WebrootLd 0.0 SophosLd 0.0 McafeeLd 0.0 WTTLd 0.0 AMPLd 0.0
Wed Mar 26 11:10:31 2025 Info: Status: CPULd 13.6 DskUtil 19.9 RAMUtil 9.5 Reqs 1699 Band 107048 Latency 5724 CacheHit 2 CliConn 26921 SrvConn 24164 MemBuf 93 SwpPgOut 222877 ProxLd 99 Wbrs_WucLd 0.0 LogLd 0.0 RptLd 9.0 WebrootLd 0.0 SophosLd 0.0 McafeeLd 0.0 WTTLd 0.0 AMPLd 0.0
Wed Mar 26 11:11:31 2025 Info: Status: CPULd 15.0 DskUtil 19.9 RAMUtil 9.5 Reqs 1669 Band 178803 Latency 4871 CacheHit 1 CliConn 26676 SrvConn 23922 MemBuf 93 SwpPgOut 222877 ProxLd 100 Wbrs_WucLd 11.2 LogLd 0.0 RptLd 0.0 WebrootLd 0.0 SophosLd 0.0 McafeeLd 0.0 WTTLd 0.0 AMPLd 0.0
Wed Mar 26 11:12:31 2025 Info: Status: CPULd 17.6 DskUtil 19.9 RAMUtil 9.2 Reqs 1785 Band 143721 Latency 4349 CacheHit 1 CliConn 25929 SrvConn 23256 MemBuf 92 SwpPgOut 222877 ProxLd 99 Wbrs_WucLd 0.0 LogLd 3.6 RptLd 0.0 WebrootLd 0.0 SophosLd 0.0 McafeeLd 0.0 WTTLd 0.0 AMPLd 0.0
Using Access Logs to Troubleshoot Latency Issues
When latency issues occur with traffic being proxied through an SWA, Access Logs can serve as a valuable tool for identifying the probable root cause. To enhance troubleshooting efforts, you can either modify the existing Access Log settings or create a new Access Log. By including Performance Parameters in the Custom Field, you can gain deeper insights into factors contributing to latency, enabling more effective analysis and resolution.
For more information about the Performance Parameters and the configuration steps, refer to link: Configure Performance Parameter in Access Logs
Here is the detailed guide to collect logs in the SWA: Access Secure Web Appliance Logs
Latency sources can be analyzed by examining key parameters that help determine whether delays occur between the client and the SWA, inside SWA internal processes or between the SWA and the web server. Important indicators to consider include network-based services such as DNS resolution, authentication time, and server or client response times. Additionally, delays caused by scanning engines like AMP, Sophos, and AVC must be evaluated to identify their impact on overall latency.
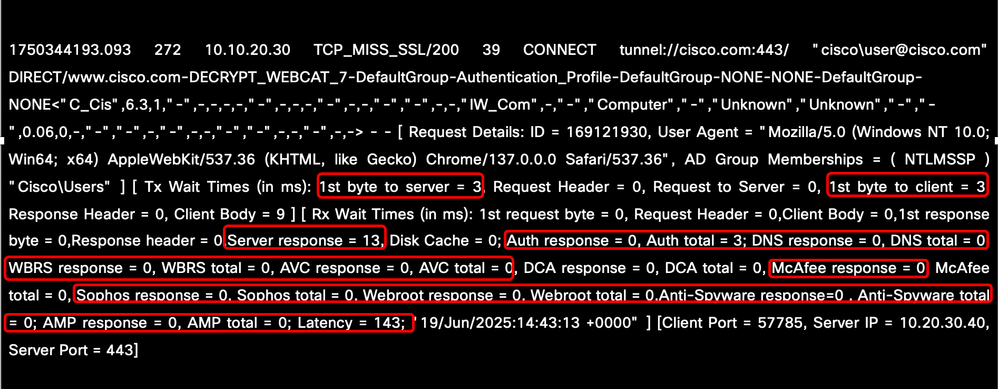 Image - Performance Parameters in the AccessLog
High Authentication Time
If the authentication response time is high, this information is required for TAC to troubleshoot the authentication latency better and faster:
-
Current SWA configuration
-
Authentication logs in debug or trace mode
-
Packet captures from
-
Client machine.
-
SWA (With filter to capture the Client traffic and the SWA traffic to all active directories configured in the realm settings.)
-
-
Make sure Accesslogs has both custom field %m and %g to identify the authentication mechanism and groups
-
HAR file from the Client while reproducing the issue
- The output of testauthconfig command from the CLI
This example shows the high latency time related to Authentication:
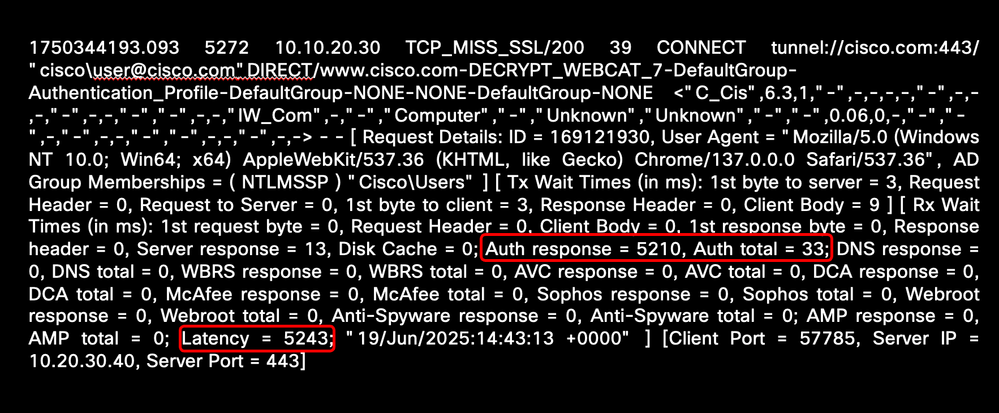 Image - Sample of High Authentication Latency
High DNS Time
If the DNS response time is high, this information is required for TAC to troubleshoot DNS latency issues:
-
Current SWA configuration
-
System logs in trace mode
- DNS servers IP address
-
Packet captures from
-
Client machine
-
SWA (Filtering with DNS servers IP address.)
-
-
Make sure your Accesslogs have both %:<d and %:>d in the custom field
-
HAR file from the Client while reproducing the issue
To read more about the DNS configuration and troubleshooting, refer to link Troubleshoot Secure Web Appliance DNS Service
This example shows the high latency time related to DNS name resolution:
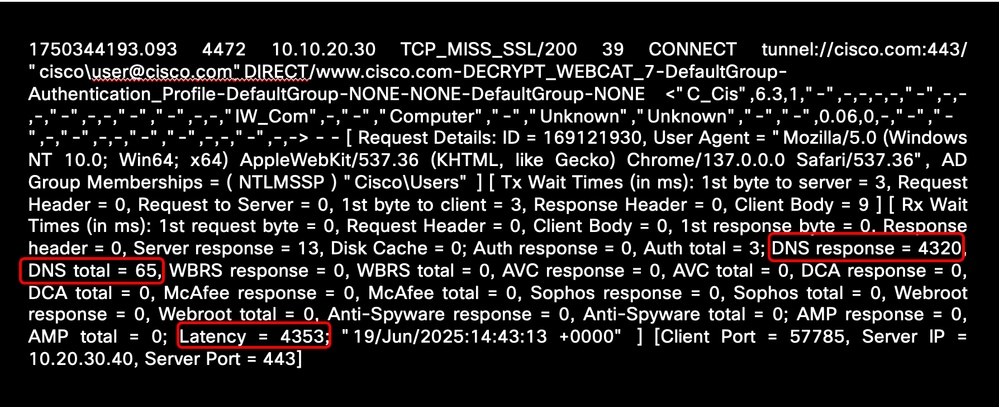 Image - Sample of High DNS Resolution Latency
High Scanning Engine Time
If the response time is high for Web Reputation Score (WBRS), Application and Visibility Control (AVC), and Malware Scanning engines, this information is required for TAC to troubleshoot scanning engine high response time:
-
Current SWA configuration.
-
Depends on the Engine that has high response time, change the logging level to debug.
This example shows the high latency time related to Sophos Engine:
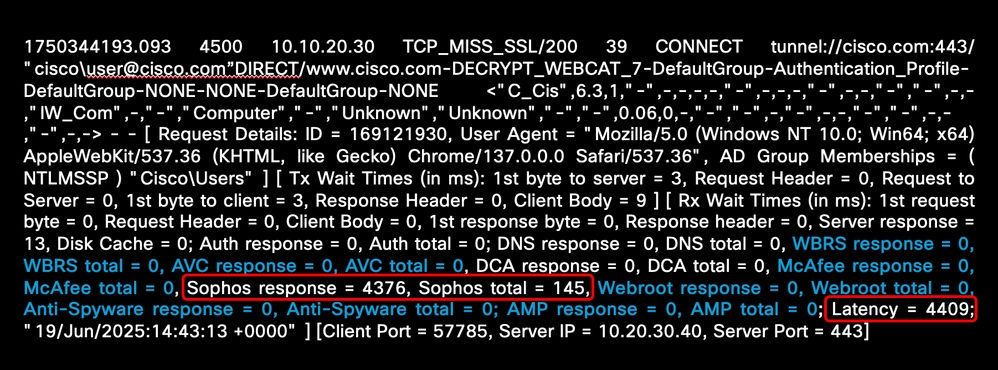 Image - Malware Scanning Engine High Latency
If the scanning engines show high response, for immediate recovery, you can restart the scanning service from CLI using these steps:
Step 1. Type diagnostic and press Enter (This is a hidden command and you need to type the exact command.)
Step 2. Choose SERVICES.
Step 3. To restart the WBRS service, choose WBRS else skip to step 6.
Step 4. Choose RESTART.
Step 5. Keep pressing Enter to exit the wizard.
Step 6. In case you are planning to restart any Malware scanning engine, choose ANTIVIRUS.
Step 7. Select your scanners.
Step 8. Choose RESTART.
Step 9. Keep pressing Enter to exit the wizard.

Warning: Restarting the internal services causes service interruption. Recommend to perform this in off-production hours or by caution.
Best Practice While Connecting Packet Capture
While performing any packet capture please collect and share this information with Cisco TAC.
- Client IP address.
- The URL which you were trying to access.
- The IP address resolved for that URL from Client PC and from the SWA.
- User experience (such as page did not load or has partial load, and if there are any error messages, please take a screen shot).
- Time-stamp of the test.
- Close all other browsers and apps on the client machine. Access the website, capture logs in Notepad for one success/failure attempt, and share with Cisco Support.
For detailed information about how to perform packet capture in SWA, refer to link Configure Packet Capture on Content Security Appliance
Configuration Complexity
Another common cause of high latency and poor performance is configuration complexity. This occurs when the SWA is configured with an excessive number of conditions, profiles, and policies. Such complexity can significantly increase response times and place a heavy load on the proxy process. This issue tends to become more pronounced during peak hours, when traffic is at its highest.
Here are some tips to Optimize Configuration:
- Limit HTTPS Decryption: Only decrypt the traffic essential to your security policies. Whenever possible, reduce processing overhead while maintaining security.
- Prioritize Policies for Efficiency: Arrange the most frequently used policies at the top of the policy list. This ensures faster processing by addressing most demanding traffic first.
- Streamline Policy Design: Simplify policies by minimizing their number as much as possible. This reduces unnecessary processing and improves overall system performance.
- Optimize Anti-Malware and Anti-Virus Scanning: Review scanning configurations for anti-malware and anti-virus processes. These can be CPU-intensive, so fine-tuning them can significantly lower resource consumption without compromising security.
- Use Lightweight Regular Expressions: Avoid complex or resource-heavy regular expressions. Ensure characters like dots (.) and stars (*) are properly escaped to reduce processing strain and prevent inefficiencies.
For detailed information about SWA Best Practice, visit Use Secure Web Appliance Best Practices
CLI Commands
Version
Use version command to verify hardware allocation (for Virtual SWA) and RAID status (for physical SWA). Check hardware configuration: Ensure number of CPU cores, Memory and Hard disks are allocated as expected. In virtual models, RAID status shows as Unknown, if the RAID Status is Degraded or Failed in physical appliance, please contact Cisco TAC to review the disk status from back end.
Here is a Sample of allocating more CPU to the SWA that can lead to misbehavior:
SWA Lab> version
Current Version
===============
Product: Cisco S100V Secure Web Appliance
Model: S100V
BIOS: 6.00
CPUs: 3 expected, 4 allocated
Memory: 8192 MB expected, 8192 MB allocated
Hard disk: 200 GB, or 250 GB expected; 200 GB allocated
RAID: NA
RAID Status: Optimal
displayalerts
Use displayalerts command to check SWA network related alert messages that can indicate the root cause.
In this example, the DNS server at IP address 10.10.10.10 was not responding, and the message "The File Reputation service is not reachable" can indicate a network connectivity issue.
SWA LAB> displayalerts
Date and Time Stamp           Description
--------------------------------------------------------------------------------
26 Mar 2025 11:20:07 +0500 The File Reputation service is not reachable.
26 Mar 2025 11:20:07 +0500 Critical: Reached maximum failures querying DNS server 10.10.10.10
26 Mar 2025 11:20:07 +0500 Critical: Reached maximum failures querying DNS server 10.10.10.10
26 Mar 2025 10:16:18 +0500 Warning: Communication with the File Reputation service has been established.
process_status
Use process_status command to view process and memory usage of SWA internal services.
If the Prox process, which is the main process handling traffic proxying, consistently exceeds 100% usage for several minutes, it indicates a sustained high load on the process. However, occasional short spikes in CPU usage on the Prox or other processes are normal and expected.
SWA LAB> process_status
USER     PID   %CPU %MEM     VSZ     RSS TT  STAT STARTED           TIME COMMAND
root      11 2805.4  0.0       0     512  -  RNL  28Jun24 11863204:12.63 idle
root   71189  102.0 19.5 6670700 6478032  -  R    23Feb25    18076:32.80 prox
root   91880   99.0  0.6  369564  214832  -  R    28Jun24    58854:51.78 counterd
root   91267   76.0  0.9  379804  292324  -  R    28Jun24    59371:01.26 counterd
root      12   25.9  0.0       0    1600  -  WL   28Jun24    30899:57.88 intr
root   46955   25.0  0.2   91260   59336  -  S    23Jan25     7547:02.96 wbnpd
root   95056   23.0 11.2 5369332 3710348  -  I    28Jun24    31719:23.99 java
root   93190   12.0  1.4 3118384  456088  -  S    01:15         29:57.05 beakerd
root   64579   11.0  0.2  101336   71204  -  S     6Aug24    12074:55.55 coeuslogd
status detail
The status detail command provides a real-time summary of system resource usage, network traffic metrics, and connection statistics, reflecting the overall health and performance of the SWA. It mirrors the System Status view in the GUI for quick monitoring and troubleshooting.
SWA LAB> Status detail
Status as of:                  Wed Mar 26 11:51:27 2025 PKT
Up since:                      Fri Jun 28 13:45:43 2024 PKT (270d 22h 5m 43s)
System Resource Utilization:
  CPU                                    16.0%
  RAM                                    10.3%
  Reporting/Logging Disk                 19.8%
Transactions per Second:
  Average in last minute                  1745
  Maximum in last hour                    2210
  Average in last hour                    1708
  Maximum since proxy restart             2451
  Average since proxy restart              615
Bandwidth (Mbps):
  Average in last minute               149.699
  Maximum in last hour                1356.387
  Average in last hour                 229.634
  Maximum since proxy restart        22075.244
  Average since proxy restart           60.689
Response Time (ms):
  Average in last minute                    99
  Maximum in last hour                 8194128
  Average in last hour                      87
  Maximum since proxy restart         19608632
  Average since proxy restart               28
Cache Hit Rate:
  Average in last minute                     3
  Maximum in last hour                       6
  Average in last hour                       2
  Maximum since proxy restart                89
  Average since proxy restart                2
Connections:
  Idle client connections                 3481
  Idle server connections                  754
  Total client connections               21866
  Total server connections               19049
SSLJobs:
  In queue Avg in last minute                0
  Average in last minute                 12050
  SSLInfo Average in last min                0
Network Events:
  Average in last minute                  16.0
  Maximum in last minute                   171
  Network events in last min            151918
Ipcheck
The ipcheck command displays detailed system information for the Secure Web Appliance, including hardware specs, disk usage, network interfaces, installed software keys, and version details, providing a comprehensive snapshot of the appliance's current state.
SWA LAB > ipcheck
  Ipcheck Rev           1
  Date                  Fri Mar 21 16:34:56 2025
  Model                 S100V
  Platform              vmware (VMware Virtual Platform)
  Secure Web Appliance Version  Version: 15.2.1-011
  Build Date            2024-10-03
  Install Date          2025-02-13 17:49:24
  Burn-in Date          Unknown
  BIOS Version          6.00
  RAID Version          NA
  RAID Status           Unknown
  RAID Type             NA
  RAID Chunk            Unknown
  BMC Version           NA
  Disk 0                200GB VMware Virtual disk 1.0 at mpt0 bus 0 scbus2 target 0 lun 0
  Disk Total            200GB
  Root                  4GB 64%
  Nextroot              4GB 65%
  Var                   400MB 38%
  Log                   130GB 24%
  DB                    2GB 0%
  Swap                  8GB
  Proxy Cache           50GB
  RAM Total             8192M
rate
The rate command prints the connection rates and the number of requests per seconds for every 10 seconds .
SWA LAB> rate
Press Ctrl-C to stop.
%proxy  reqs                        client    server    %bw  disk disk
  CPU  /sec    hits blocks misses    kb/sec    kb/sec  saved  wrs   rds
100.00  1800     17  16352   1626    178551    178551    0.0  2366   0
100.00  1813     18  16453   1659    226301    224952    0.6  3008   0
99.00  1799      10  16338   1645    206234    206234    0.0  3430   1
Collecting Logs for High Latency
It depends on the section that you are seeing high response time from Access Logs or high process load from SHD logs, for further troubleshooting, it is best to change the corresponding log subscription to Debug.
Warning: Setting the log level to debug or trace can lead to increased resource usage and cause log files to rotate or overwrite quickly.
|
Access Log Field |
SHD Log Field |
Corresponding Log Subscription |
|
Auth response , Auth total |
-- |
authlogs |
|
DNS response, DNS total |
-- |
system_logs |
|
WBRS response, WBRS total |
Wbrs_WucLd |
Contact Cisco TAC |
|
AVC response, AVC total |
-- |
avc_logs |
|
McAfee response, McAfee total |
McafeeLd |
mcafee_logs |
|
Sophos response, Sophos total |
SophosLd |
sophos_logs |
|
Webroot response, Webroot total |
WebrootLd |
webrootlogs |
|
AMP response, AMP total |
AMPLd |
amp_logs |
Related Information
Troubleshoot Secure Web Appliance Performance with SHD Logs
Access Secure Web Appliance Logs
Configure Packet Capture on Content Security Appliance
Use Secure Web Appliance Best Practices
Configure Performance Parameter in Access Logs
Troubleshoot Unusual Process States in SWA
Determine Decryption Rate in SWA
Revision History
| Revision | Publish Date | Comments |
|---|---|---|
1.0 |
26-Jun-2025
|
Initial Release |
Contributed by Cisco Engineers
- Magesh BTechnical Consulting Engineer
 Feedback
Contact Cisco
- Open a Support Case

- (Requires a Cisco Service Contract)