Introduction
This document describes the methods to analyze the packet captured from Secure Web Appliance (SWA) using Wireshark.
Prerequisites
Requirements
Cisco recommends that you have knowledge of these topics
Components Used
This document is not restricted to specific software and hardware versions.
The information in this document was created from the devices in a specific lab environment. All of the devices used in this document started with a cleared (default) configuration. If your network is live, ensure that you understand the potential impact of any command.
Background Information
When contacting Cisco Technical Support, you are asked to provide details on the SWA outbound and inbound network activity, which can be monitored by running a packet capture to collect traffic for debugging or verification purposes.
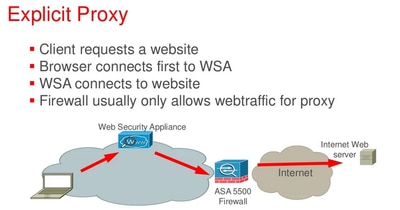
Explicit Proxy Deployment
An explicit proxy requires clients to be configured to send their traffic directly to the proxy server, often through specific proxy settings in their network configuration (PAC file or DHCP options) or the browser settings. This allows the proxy server to manage and filter requests before forwarding them to the destination.
Note: In an explicit deployment, the destination IP address of the packet leaving the client machine is the Proxy server IP address.
Here is the network logical flow while using the explicit proxy deployment:
 Explicit Proxy Packet Flow
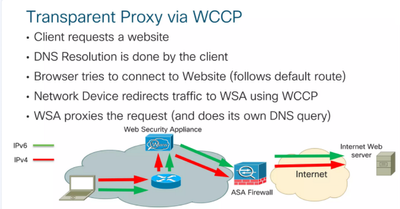
Transparent Proxy Deployment
A transparent proxy intercepts network traffic without requiring any configuration changes on the client side. Traffic is redirected to the proxy server automatically, allowing it to filter and monitor requests without the client explicit awareness.
Note: In the transparent deployment, the destination IP address of the packet leaving the client machine is the destination server IP address.
Here is the network logical flow while using the transparent proxy deployment:
 Transparent Proxy Packet Flow
For more information about the SWA Explicit Transparent packet flow refer Understand Packet Flow in Secure Web Appliance
Packet Captures on AsyncOS Versions 7.x and Later
In order to start a packet capture from the Graphical User Interface (GUI), navigate to the Help and Support menu at the top right, choose Packet Capture, and then click Start Capture. In order to stop the packet capture process, click Stop Capture.

Note: A capture started in the GUI remains saved across sessions, even after SWA GUI session expiry or logout.
In order to start a packet capture from the Command Line Interface (CLI), enter the Packetcapture > Start command. In order to stop the packet capture process, enter the Packetcapture > Stop Command, and the SWA stops the packet capture when the session ends.
Configuration Guides on SWA Packet Capture
For more information about how to perform packet capture in SWA.
Configure Packet Capture on Content Security Appliance
SWA User Guide - Packet Capture Section
Packet Capture Filters on SWA
The default capture from SWA GUI and CLI (Packetcapture command) uses standard tcpdump filter syntax. This section provides information in regards to tcpdump capture filters and provides some examples.
Here are some of the most used filters:
- ip: Filters for all IP protocol traffic.
- tcp: Filters for all TCP protocol traffic.
- host: Filters for a specific IP address source or destination.
There are two logical conditions that frequently used in tcpdump:
- And: Captures packets only if all specified conditions are met (use
&&).
- Or: Captures packets if at least one condition is met (use
||).
Note: Those logical conditions are case sensitive.
Here is an example filter in SWA to collect the packets by IP address in transparent or explicit deployments:
Source IP: 192.168.1.1
Destination IP: 10.20.3.15
host 192.168.1.1 || host 10.20.3.15
This filter captures traffic between 10.20.3.15 and SWA, and the traffic between SWA and 192.168.1.1.
Tip: There is no need to add the SWA IP address in the filter.
Troubleshoot
When client tries to access a website, the entire communication process can be split into two parts:
- The client communicates to the SWA.
- SWA communicating with the destination server.

Tip: Before capturing packets, verify that the client IP address remains unchanged in the path to SWA. IP address changes occur due to Network Address Translation (NAT) rules configured before the traffic reaches SWA or the presence of a downstream proxy between SWA and the client machine.
Analyse Explicit Connections Using Wireshark Filters
Wireshark Filters for Explicit Connections
For first phase of communication in packet capture: Source ip would be Client IP address and the destination IP address is the SWA IP (the inbound interface of the SWA, is usually P1 interface).
You can use these filters in Wireshark:
Filter by the client IP:
ip.addr == <client_IP_Address>
For second phase of communication, Source IP would be SWA IP address (The outside interface, is usually P2 interface) and destination ip address is the web server IP address.
Filter by the server IP:
ip.addr == <web_server_IP_address>
In the explicit deployment, the client send its request as HTTP Connect to the proxy, to filter by the HTTP Connect:
http.request.method == "CONNECT"
Filter by the HTTP request method:
http.request.method==GET
or
http.request.uri contains "<Enter_your_URL_here>"
In the HTTPS request to filter for Client Hello:
ssl.handshake.type==1
In case you want to see both sides communicate together, the best action is to use is TCP stream filter.
Tip:To find the TCP stream number, right-click on any packet in your current filter or right-click on your desired packet, select Follow, choose TCP Stream. You can see the TCP stream number in the filter bar.
To isolate both the first and second phase TCP stream numbers, use the filter:
tcp.stream eq <first_phase_stream_number> || tcp.stream eq <second_phase_stream_number>
Replace <first_phase_stream_number> and <second_phase_stream_number> with the appropriate stream numbers.
Analyse Transparent Connections Using Wireshark Filters
In the transparent requests involving Web Cache Communication Protocol (WCCP) redirection or Policy-Based Routing (PBR), while client traffic is directed to the SWA, the SWA responds with the destination server IP address rather than its own IP address. As a result, in transparent requests, the packet capture displays the destination server IP address but uses the SWA MAC address as the destination MAC address (in traffic between Client to SWA) and the packets going out from the SWA if the IP spoofing is not enabled, the source IP is the Client IP address with SWA MAC address.
Wireshark Filters for Transparent Connections
As is the case of transparent request, Wireshark filters the same as explicit connections, but keeps a note that SWA cannot communicate to client using its actual IP address and rather spoofed itself as actual destination server.
Filter by the client IP:
ip.addr == <client_IP_Address>
Filter by the server IP:
ip.addr == <web_server_IP_address>
Caution: If IP Spoofing is not enabled in the SWA, the source IP address of the packet from SWA to the web server is the Client IP address.
Filter by the HTTP request method:
http.request.method==GET
or
http.request.uri contains "<Enter_your_URL_here>"
In the HTTPS request to filter for Client Hello:
ssl.handshake.type==1
In case you want to see both sides communicate together, the best action is to use is TCP stream filter.
Tip: To find the TCP stream number, right-click on any packet in your current filter or right-click on your desired packet, select Follow, choose TCP Stream. You can see the TCP stream number in the filter bar
To isolate both the first and second phase TCP stream numbers, use the filter:
tcp.stream eq <first_phase_stream_number> || tcp.stream eq <second_phase_stream_number>
Replace <first_phase_stream_number> and <second_phase_stream_number> with the appropriate stream numbers.
Wireshark filters are similar to explicit connections.
How to Confirm Client Web Request is Explicit or Transparent Connection
In the explicit requests: the client accesses a URL while being aware of the proxy server, so the client sends the HTTP Connect request to the Proxy IP address and the Proxy port.
SWA by default, listens to TCP port 3128 and 80 for the proxy service. In explicit deployment packet captures, you can see the traffic between the client and SWA is destined to those proxy port numbers.
In the transparent requests: the client accesses a URL while client is not aware of the proxy IP, and SWA does not communicate using its own IP address. Instead SWA spoofed the destination server IP address.
In transparent mode, traffic instead appears as if it flows between the client and the destination server (For example, Cisco's website), but the MAC address of the destination server is that of the SWA. To confirm the SWA MAC address, use the CLI Command: etherconfig > MEDIA.
Modifying the Wireshark View
To have a better overview of the packets in the Wireshark while troubleshooting the web requests using a Proxy, it is best to have the Server Name Indication (SNI) and TCP Stream ID in your packet view.
Adding SNI Column to the Wireshark View
Step 1. Open Packet capture file with your Wireshark.
Step 2. Right click the columns name in the Wireshark.
Step 3. Choose Column Preferences.
Step 4. Click the + sign (Add a new Column).
Step 5. Enter a Name for that Column (for Example, SNI).
Step 6. In the Type section, choose Custom.
Step 7. In the Field section, enter tls.handshake.extensions_server_name.
Step 8. Click OK to save the changes.
Or you can use these steps:
Step 1. Apply the Filter on Wireshark: ssl.handshake.type==1 to isolate the Client Hello messages in the SSL/TLS handshake.
Step 2. Expand Protocol Details: Click Transport Layer Security > Expand Handshake Protocol: Client Hello > Expand Extension: Server name > Expand Server Name Indication Extension (SNI).
Step 3. Add Server Name as a Column. Right-click the Server name (or the specific server name) and select Apply as Column.
Adding Stream Number Column to the Wireshark View
Step 1. Open Packet capture file with your Wireshark.
Step 2. Right click the columns name in the Wireshark.
Step 3. Choose Column Preferences.
Step 4. Click the + sign (Add a new Column).
Step 5. Enter a Name for that Column (for example, Stream).
Step 6. In the Type section, choose Custom.
Step 7. In the Field section, enter tcp.stream.
Step 8. Click OK to save the changes.
Or you can use these steps:
Step 1. Locate HTTP/TCP Packets: Ensure you are viewing packets that include the HTTP/TCP protocol.
Step 2. Select or click the packet and one bottom left pane transmission Control protocol. Scroll down to get (Stream Index:Number).
Step 3. Right click the Stream Index: number and apply as column.
Related Information
 Feedback