Configure PBR with HTTP Path Monitor on FMC
Available Languages
Download Options
Bias-Free Language
The documentation set for this product strives to use bias-free language. For the purposes of this documentation set, bias-free is defined as language that does not imply discrimination based on age, disability, gender, racial identity, ethnic identity, sexual orientation, socioeconomic status, and intersectionality. Exceptions may be present in the documentation due to language that is hardcoded in the user interfaces of the product software, language used based on RFP documentation, or language that is used by a referenced third-party product. Learn more about how Cisco is using Inclusive Language.
Contents
Introduction
This document describes how to configure Policy-Based Routing (PBR) with HTTP Path Monitoring on the Cisco Secure Firewall Management Center (FMC).
Prerequisites
Requirements
Cisco recommends that you have knowledge of these topics:
- PBR basic knowledge
- Basic Cisco Secure Management Center experience
- Basic Cisco Secure Firewall Threat Defense (FTD)
Components Used
The information in this document is based on these software and hardware versions:
- Cisco Secure Firewall Management Center Virtual (FMCv) VMware running 7.4 release
- Cisco Secure Firewall Threat Defense Virtual Appliance (FTDv) VMware running 7.4 release
The information in this document was created from the devices in a specific lab environment. All of the devices used in this document started with a cleared (default) configuration. If your network is live, ensure that you understand the potential impact of any command.
Background Information
In traditional routing, packets are routed based on the destination IP address, however, it is difficult to change the routing of specifying traffic in a destination-based routing system. PBR gives you more control over routing by extending and complementing the existing mechanisms provided by routing protocols.
PBR allows to set the IP precedence. It also allows the specifying of a path for certain traffic, such as priority traffic over a high-cost link. With PBR, routing is based on criteria other than the destination network such as source port, destination address, destination port, protocol applications, or a combination of these objects. PBR can be used to classify the network traffic based on application, username, group membership, and security group association. This routing method is applicable in situations where numerous devices access applications and data in a large network deployment. Traditionally, large deployments have topologies that backhaul all the network traffic to a hub as encrypted traffic in a routed-based VPN. Those topologies often result in issues such as packet latency, reduced bandwidth, and packet drop.
PBR is supported only on routed firewall mode and it is not applied for Embryonic connections. HTTP-based application is supported on physical, port-channel, subinterfaces, and status tunnel interfaces. It is not supported on cluster devices.
When configured interfaces derive metrics such as round trip time (RTT), jitter, mean opinion score (MOS), and packet loss per interface, they are used to determine the best path for routing PBR traffic. Path Monitoring computes flexible metrics for multiple remote peers per interface. In order to monitor and determine the best path for multiple applications through a policy on a branch firewall, HTTP is preferred over ICMP for these reasons:
- HTTP-ping can derive the performance metrics of the path up to the application layer of the server, where the application is hosted.
- The need to change the firewall configuration whenever the application server IP address is changed is removed as the application domain is tracked instead of the IP address.
Configure
Network Diagram
Consider a typical corporate network scenario where all the branch network traffic is sent through a route-based VPN of the corporate network and diverges to the extranet when it is required. The next topology shows a branch network connected to the corporate network through a route-based VPN. Traditionally, the corporate threat defense is configured to handle both the internal and external traffic of the branch office. With the PBR policy, the branch threat defense is configured with a policy that routes specific traffic to the WAN network instead of the virtual tunnels. The rest of the traffic flows through the route-based VPN, as usual.
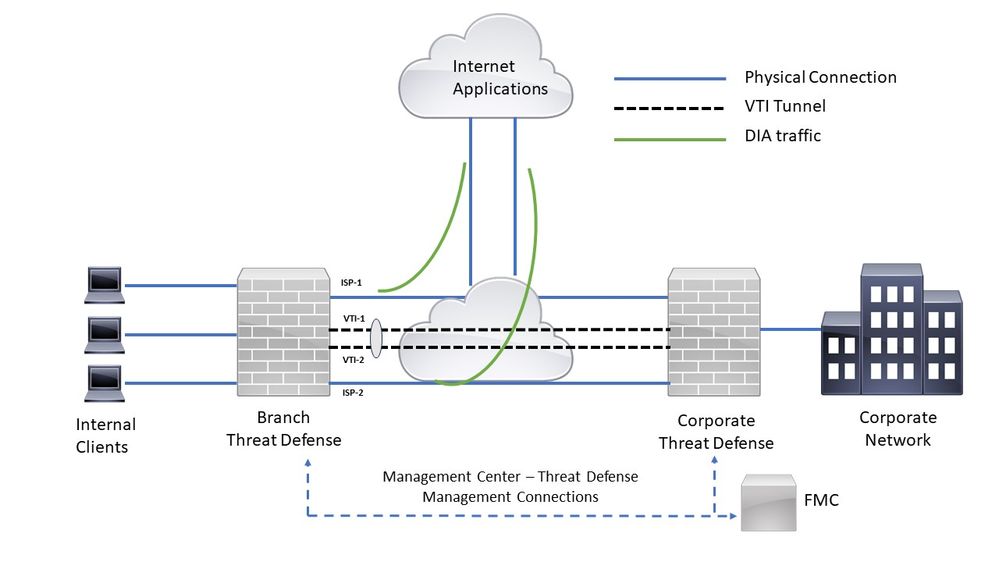 Network Topology
The configure section assumes that the ISP and VTI interfaces are already configured for the branch threat defense in the Secure FMC.
Configure PBR for HTTP Path Monitoring
This configuration section shows the Path Monitoring configuration on ISP-1 and ISP-2 interfaces.
Step 1. Create an Extended access list for monitored Applications. Navigate to Objects > Object Management
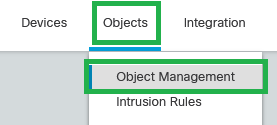 Objects - Objects Management
Step 2. Navigate to Access-list > Extended
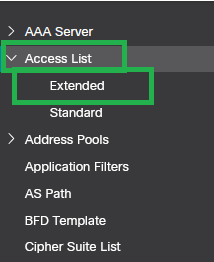 Access-list - Extended
Step 3. Click Add Extended Access List.
 Add Extended Access List
Step 4. Set up a name in the Extended Access List and click Add.
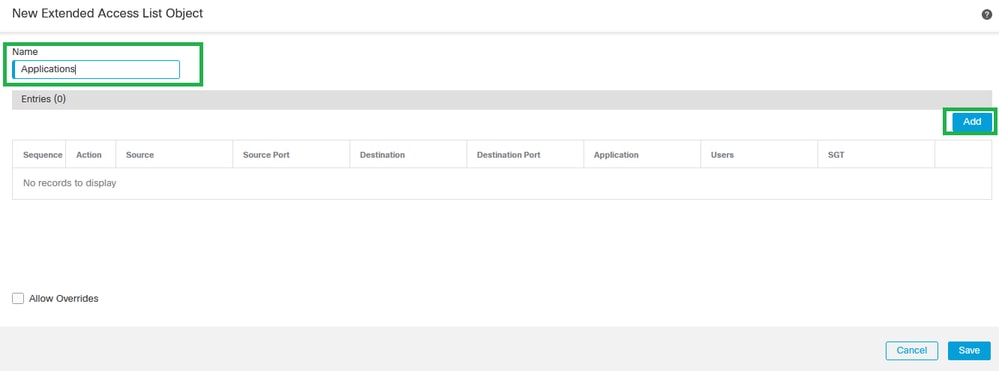 New Extended Access List Object
Step 5. Click ApplicationAdd.
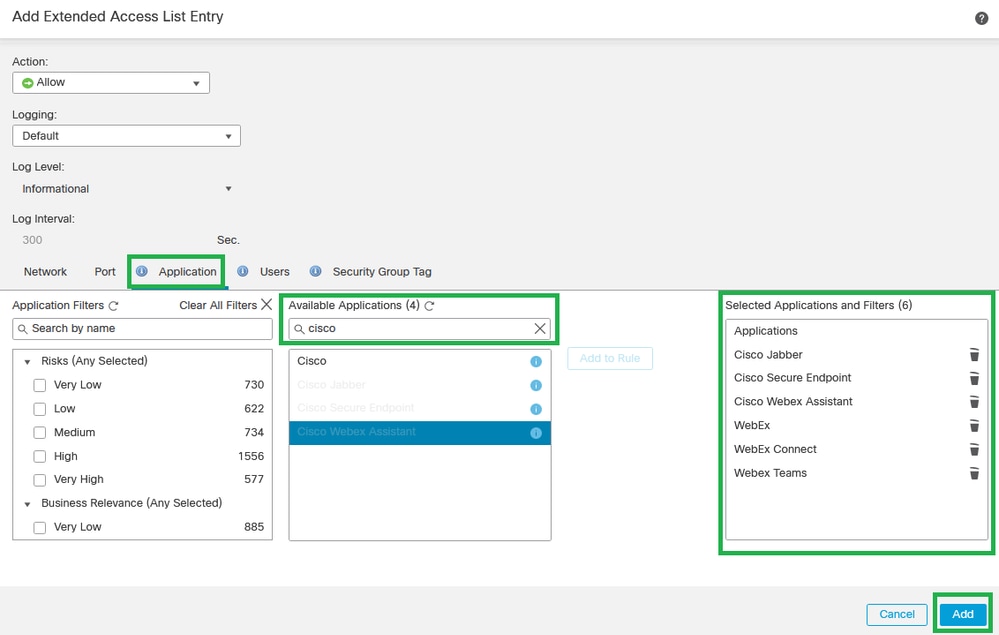 Add Extended Access List Entry

Note: Extended Access List can be configured with Source/Destination IPs and Ports in order to match specific traffic to the desired applications. You can create multiple Extended Access Control Lists in order to apply to PBR configuration.
Step 6. Validate the Extended Access List configuration and click Save.
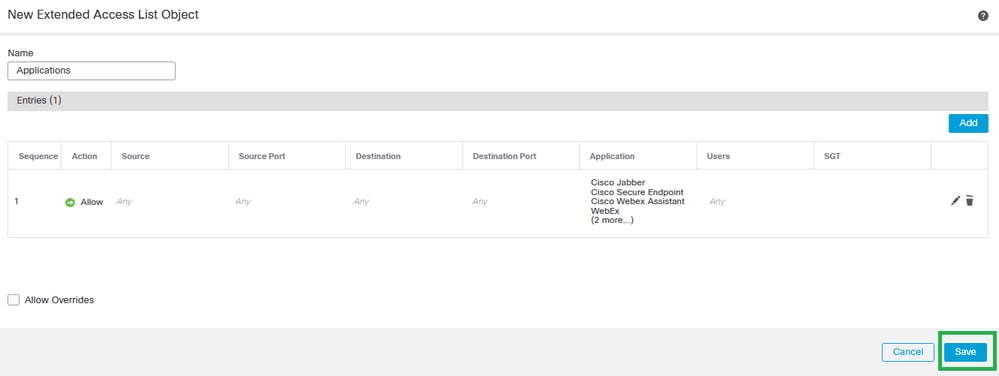 Save Extended Access List Object
Step 7. Navigate to Devices > Device Management
 Device - Device Management
Step 8. Navigate to Routing > Policy-Based Routing
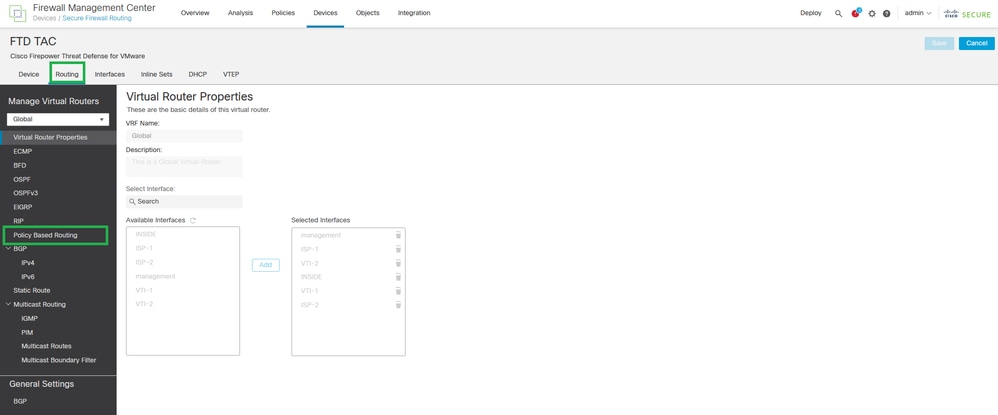 Routing - Policy Based Routing
Step 9. Click Add.
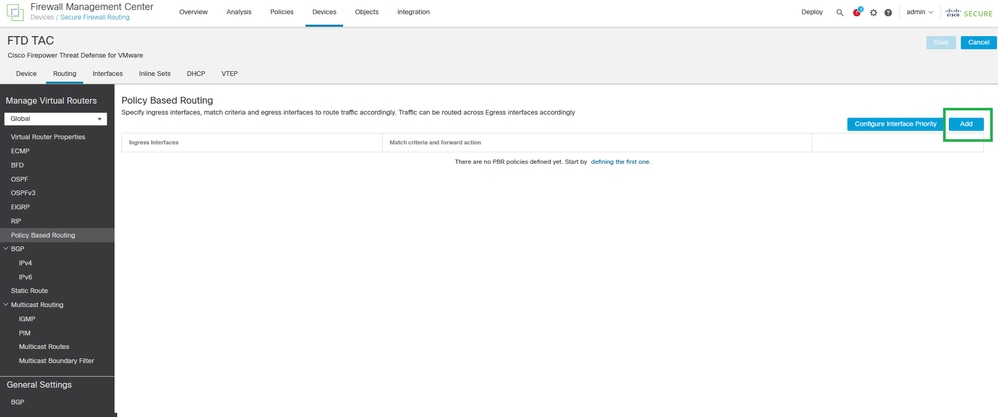 Add Policy Based Routing
Step 10. Add the ingress interface for PBR configuration (INSIDE in this example), then click Add.
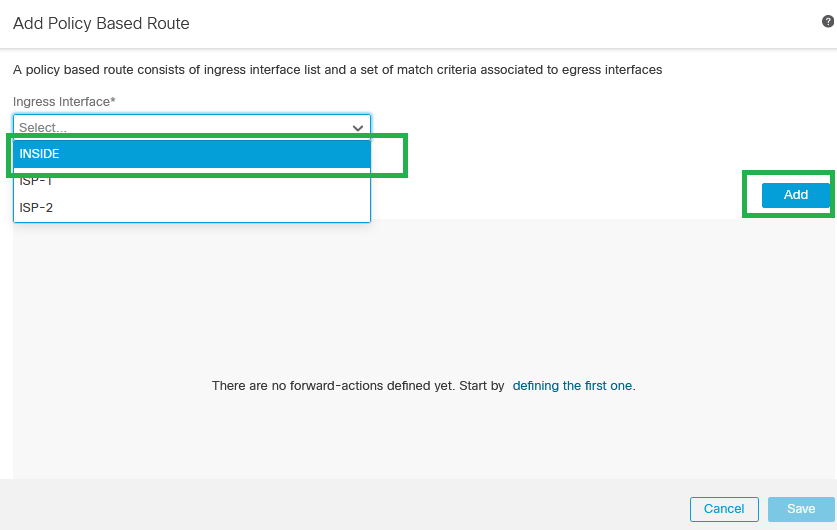 Add Policy Based Route
Step 11. Define Match Criteria (with the Extended Access List Created in the earlier steps), Egress Interfaces, and Interface Ordering.
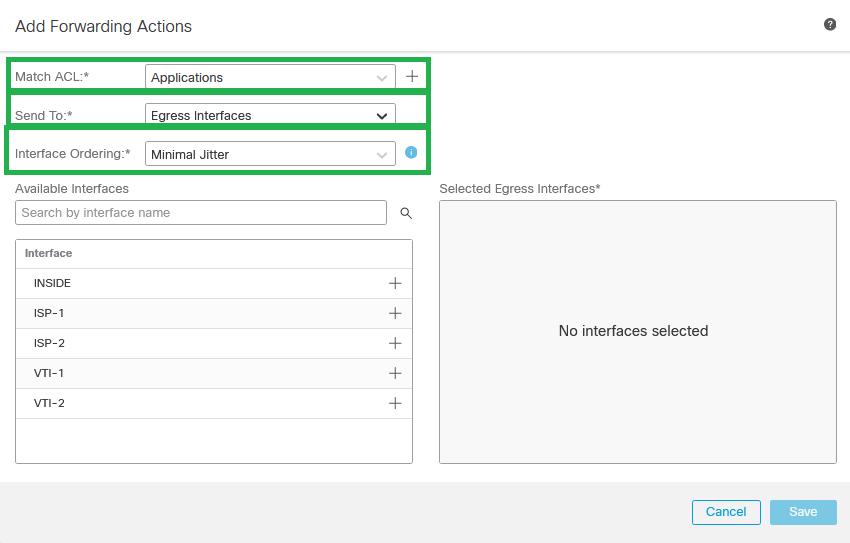 Add Forwarding Actions

Note: Egress Interfaces and Minimal Jitter were chosen for this configuration guide. Check the official PBR documentation in order to learn more about the other options.
Step 12. Choose the Egress Interfaces (ISP-1 and ISP-2 for this example), then click Save.
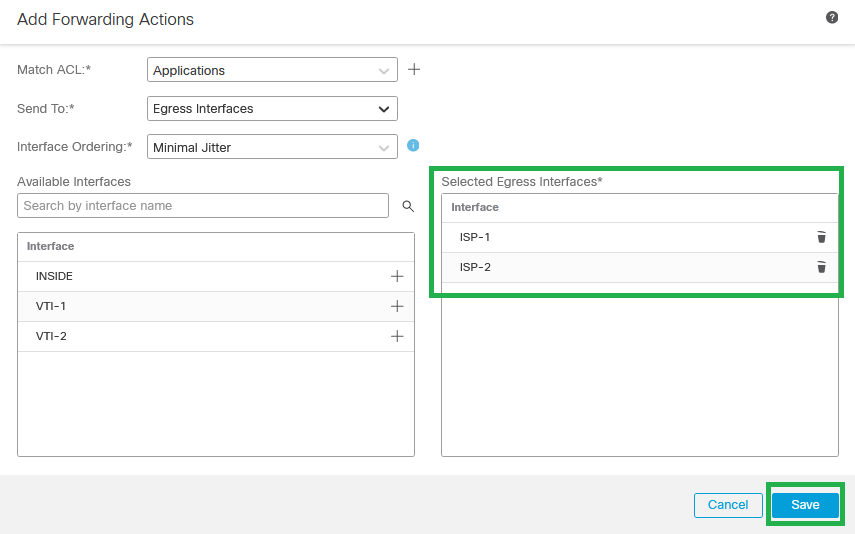 Selected Egress Interfaces
Step 13. Validate the PBR configuration and click Save.
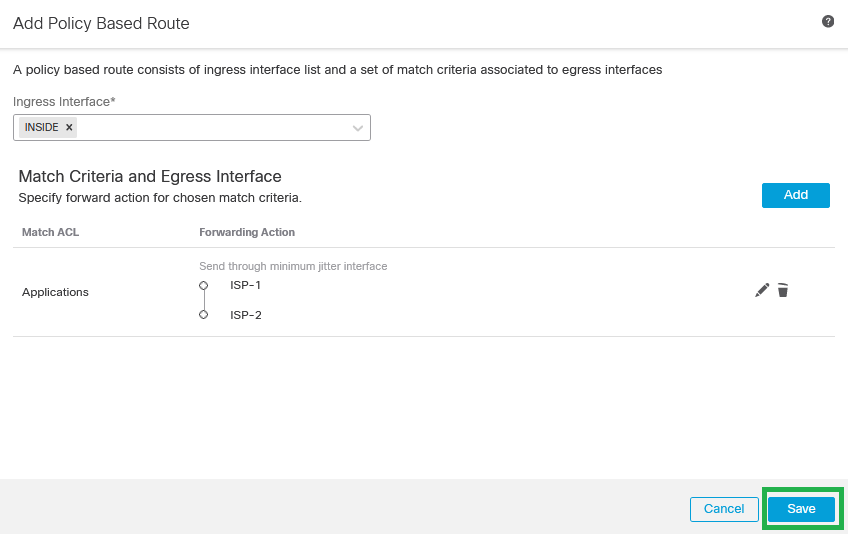 Policy Based Routing Validation
Step 14. (Optional) Repeat Steps 9, 10, 11, 12, and 13 if more Extended Access Control Lists were created or if there are more source interfaces where PBR configuration must be applied.
Step 15. Save and Deploy changes from FMC.
Configure Equal-cost-multi-path (ECMP)
Step 1. Navigate to Devices > Device Management, and edit the threat defense.
 Device - Device Management
Step 2. Navigate to Routing > ECMP.
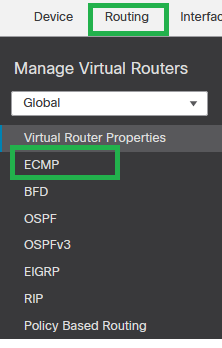 Routing - ECMP
Step 3. Click Add in order to create ECMP between the VTIs and WAN interfaces (ISP-1 and ISP-2 for this configuration guide).
 Equal-Cost Multipath Routing (ECMP)
Step 4. Set up the ECMP name and choose all VTIs interfaces, then click Add.
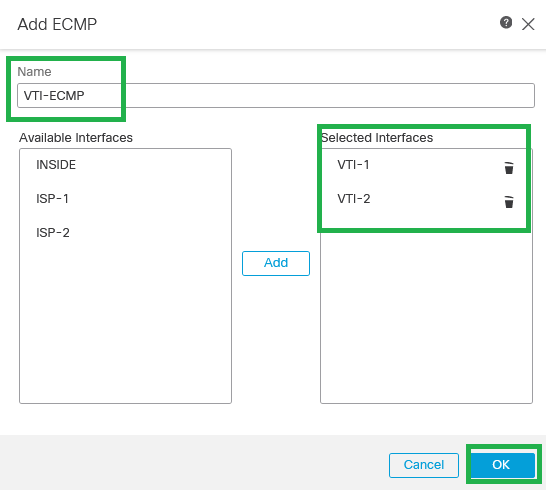 ECMP for VTIs
Step 5. Repeat Steps 3 and 4 in order to create ECMP between WAN interfaces (ISP-1 and ISP-2 for this configuration guide).
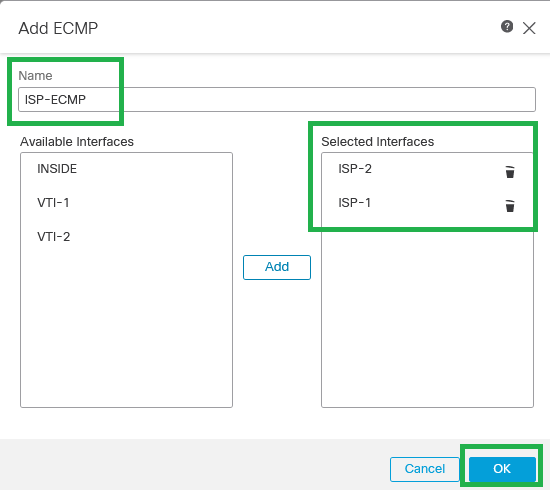 ECMP for ISP interfaces
Step 6. Save the ECMP configuration.
Step 7. Configure the Static Routes for the zone interfaces in order to load balance. Navigate to Routing > Static Route.
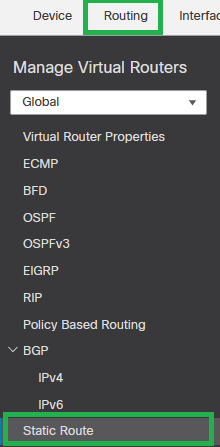 Routing - Static Route
Step 8. Click + Add Route.
 + Add Route
Step 9. Create a Default Static Route for the VTI interface(s) (VTI-1 for this configuration guide) with 1 as the metric value, then click OK.
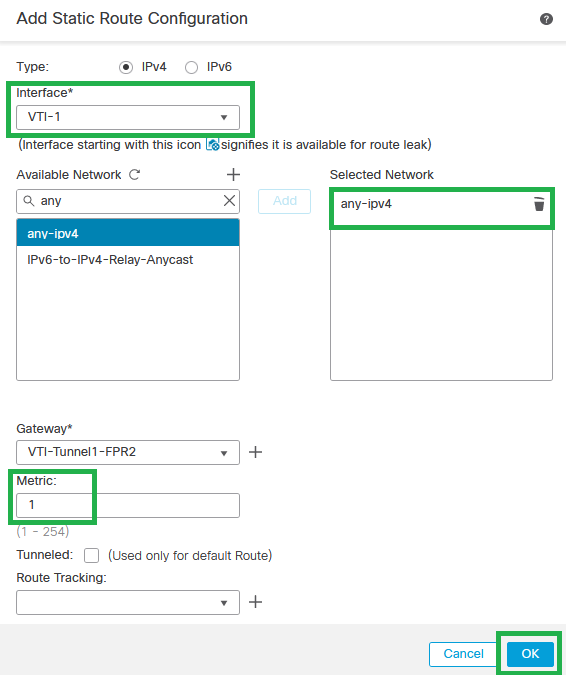 Default Static Route for VTI-1
Step 10. Repeat Step 8. if there are more VTI interfaces configured.

Note: Create a Default Route for each VTI interface configured.
Step 11. Create a Default Static Route for the WAN/ISP interface(s) (ISP-1 for this configuration guide) with a bigger metric value than VTI, then click OK.
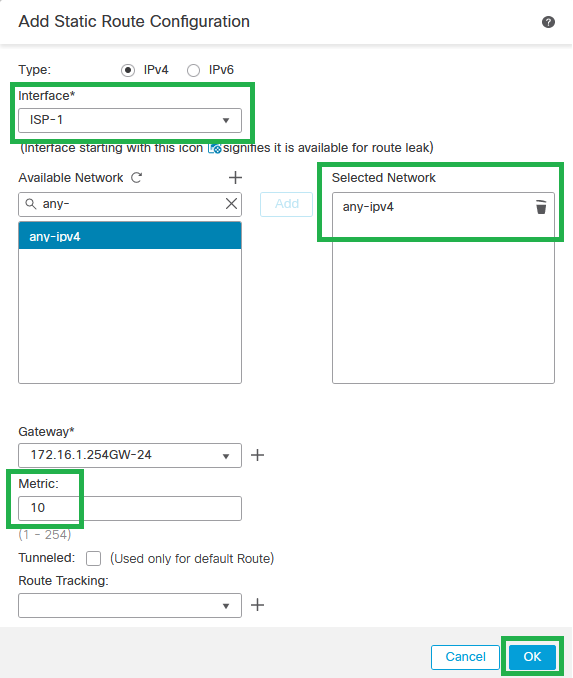 Default Static Route for ISP-1
Step 12. Repeat Step 10. if there are more WAN/ISP interfaces configured.

Note: Create a Default Route for each WAN/ISP interface configured.
Step 13. Validate the default routes configuration and click OK.
 Static Route Configuration
Configure Trusted DNS for Secure FTD
Step 1. Navigate to Devices > Platform Settings.
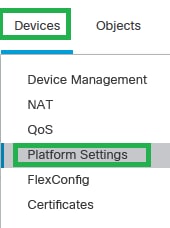 Devices - Platform Settings
Step 2. Create or edit an existing Platform Settings Policy.

Note: Ensure the Platform Settings Policy is applied to Secure Threat Defense devices.
Step 3. Click DNS.
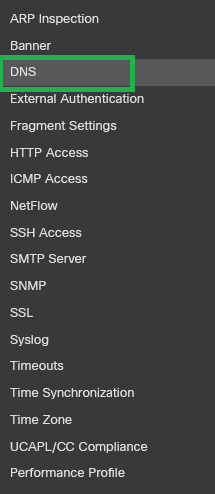 DNS Platform Settings
Step 4. Enable DNS name resolution by deviceand click Add or choose an existing DNS group. Choose Make as default, and then click OK.
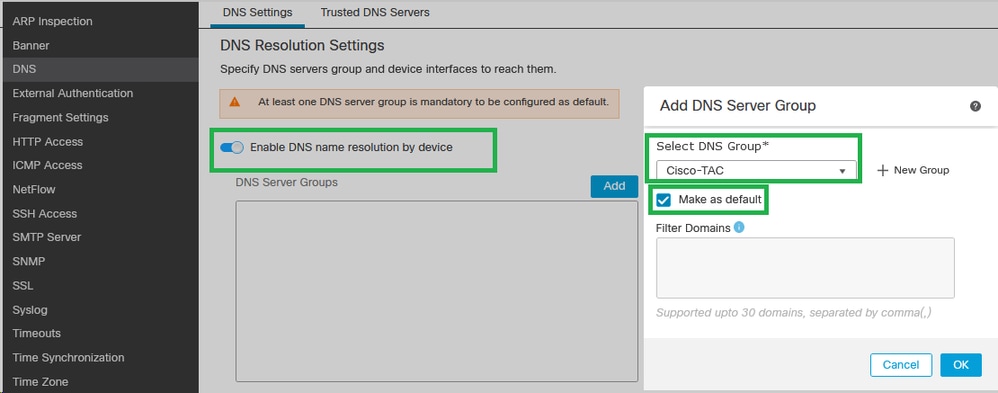 Add DNS Server Group

Note: If you want to learn more about DNS configuration on the Platform Settings Policy, check the official Platform Settings documentation.
Step 5. Choose the WAN/ISP interfaces under the Interface Objects section.
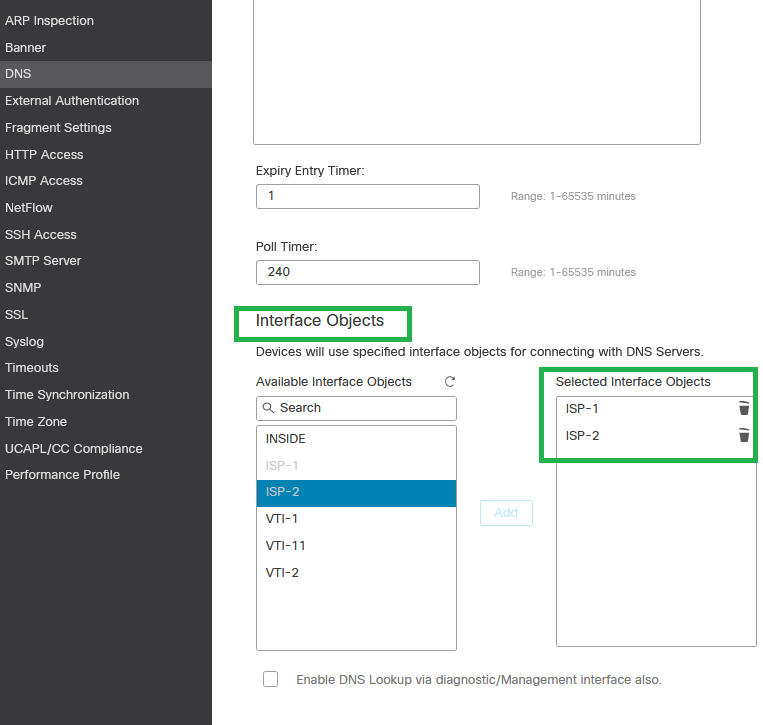 DNS Interface Configuration
Step 6. Save the changes.
Step 7. Navigate to the Trusted DNS Servers and specify the trusted DNS servers.
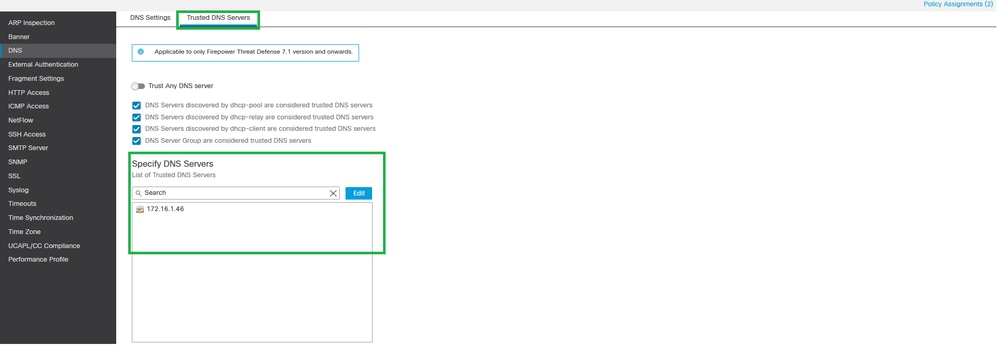 Trusted DNS Servers
Step 8. Click Save and deploy the changes.
Enable Path Monitoring
Step 1. Navigate to Devices > Device Management, and edit the threat defense.
 Device - Device Management
Step 2. Under the Interfaces tab, edit the interface WAN/ISP interfaces (ISP-1 and ISP-2 for this configuration guide).
 Interface Configuration
Step 3. Click the Path MonitoringEnable IP Monitoring and enable the HTTP-based Application Monitoring checkbox. Then click Save.
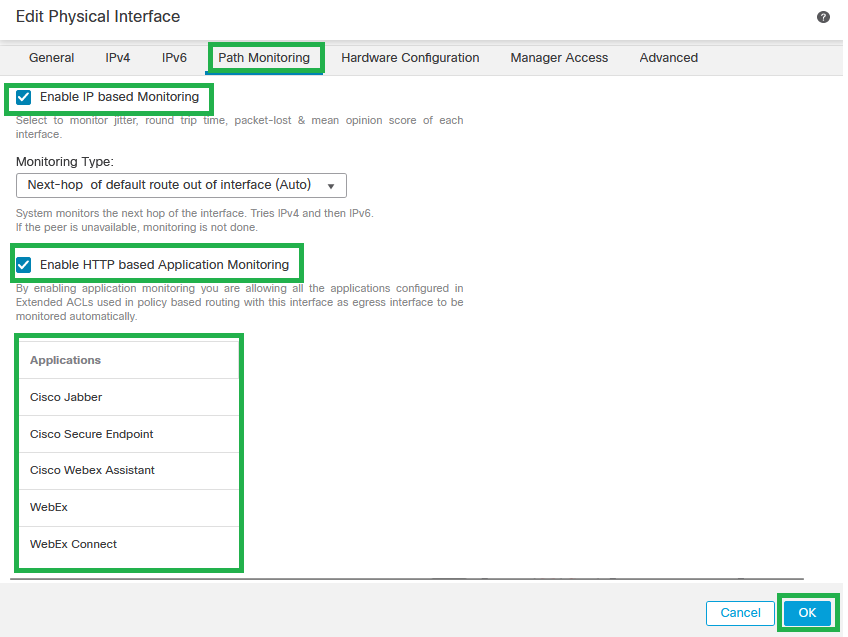 Interface Path Monitoring Configuration

Caution: The applications configured in the earlier configuration section must be listed.

Note: 'Monitoring Type' has been chosen for this configuration guide. Check the Path Monitoring Settings on the official configuration guide in order to learn more about other options.
Step 4. Repeat Steps 2 and 3 for all the WAN/ISP interfaces configured.
Step 5. Click Save and deploy the changes.
Add Monitoring Dashboard
Step 1. Navigate to System > Health > Monitor.
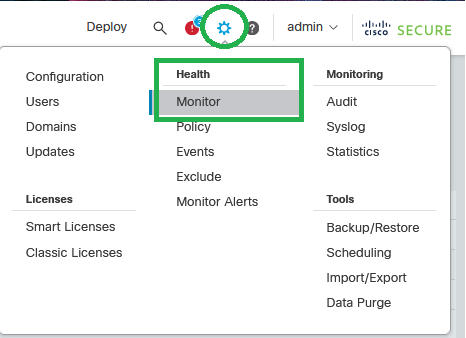 System - Health - Monitor
Step 2. Choose the Secure FTD device, and click Add New Dashboard.
 Add New Dashboard
Step 3. Set up the Dashboard Name, and in the Correlate Metrics dialog box, from the drop-down list, choose Interface - Path Metrics. Then click Add Dashboard.
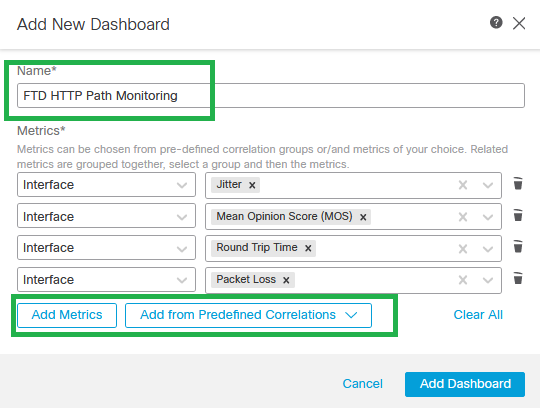 Add new Dashboard with Path Metrics
Verify
This section describes how to verify the floating static routes, ECMP, object group with applications, and PBR configurations.
Verify the default routes and floating static routes configuration:
firepower# show run route
route VTI-1 0.0.0.0 0.0.0.0 192.168.200.1 1
route VTI-2 0.0.0.0 0.0.0.0 192.168.200.5 1
route ISP-1 0.0.0.0 0.0.0.0 172.16.1.254 10
route ISP-2 0.0.0.0 0.0.0.0 172.16.11.254 10
Verify the ECMP configuration:
firepower# sh run | i ecmp
zone ECMP-VTI ecmp
zone ECMP-ISP ecmp
Verify if traffic is being balanced by the ECMP, on the routing table. The routing table must install both routes on the Secure FTD routing table.
firepower# show route static

Codes: L - local, C - connected, S - static, R - RIP, M - mobile, B - BGP
D - EIGRP, EX - EIGRP external, O - OSPF, IA - OSPF inter area
N1 - OSPF NSSA external type 1, N2 - OSPF NSSA external type 2
E1 - OSPF external type 1, E2 - OSPF external type 2, V - VPN
i - IS-IS, su - IS-IS summary, L1 - IS-IS level-1, L2 - IS-IS level-2
ia - IS-IS inter area, * - candidate default, U - per-user static route
o - ODR, P - periodic downloaded static route, + - replicated route
SI - Static InterVRF, BI - BGP InterVRF
Gateway of last resort is 172.16.11.254 to network 0.0.0.0

S* 0.0.0.0 0.0.0.0 [1/0] via 192.168.200.5, VTI-2
[1/0] via 192.168.200.1, VTI-1
Verify PBR route-map configuration:
firepower# show run route-map
!
route-map FMC_GENERATED_PBR_1694885402369 permit 5
match ip address Applications
set adaptive-interface cost ISP-1 ISP-2
!
Verify the ACL assigned to the PBR configuration (check the ACL name on the route-map configuration):
firepower# show run access-list | i Applications
access-list Applications extended permit ip any object-group-network-service FMC_NSG_639950173988
Verify the Object Group with Applications assigned to the access list (check the Object group name on the ACL configuration):
firepower# show run object-group
object-group network-service FMC_NSG_639950173988
network-service-member "Cisco Jabber"
network-service-member "Cisco Secure Endpoint"
network-service-member "Cisco Webex Assistant"
network-service-member "WebEx"
network-service-member "WebEx Connect"
network-service-member "Webex Teams"
Verify the policy route assigned to the data interfaces used on the PBR configuration:
interface GigabitEthernet0/0
nameif INSIDE
cts manual
propagate sgt preserve-untag
policy static sgt disabled trusted
security-level 0
ip address 172.16.35.1 255.255.255.0
policy-route route-map FMC_GENERATED_PBR_1694885402369
!
interface GigabitEthernet0/1
nameif ISP-1
cts manual
propagate sgt preserve-untag
policy static sgt disabled trusted
security-level 0
zone-member ECMP-ISP
ip address 172.16.1.202 255.255.255.0
policy-route path-monitoring auto
!
interface GigabitEthernet0/2
nameif ISP-2
security-level 0
zone-member ECMP-ISP
ip address 172.16.11.2 255.255.255.0
policy-route path-monitoring auto
!
Verify and check Jitter, MOS, Round Trip Time, and Packet Loss statistics from the HTTP Path Monitoring Dashboard information.
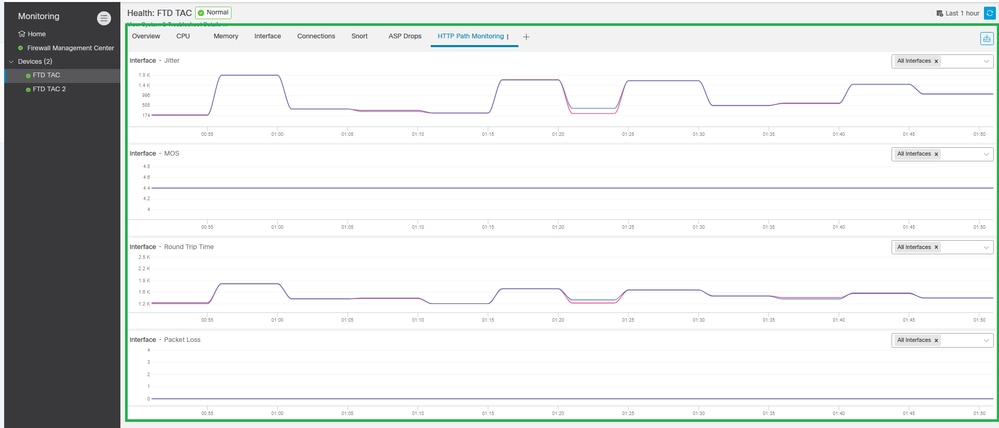 Verify HTTP Path Monitoring Dashboard
Troubleshoot
In case of Path Monitoring failure, with IP-based monitoring enabled, WAN/ISP interfaces are configured to send ICMP probe packets to the gateway configured on Static Routes. Configure ingress/egress captures on WAN/ISP interfaces in order to check if ICMP works.
Ingress and egress capture:
firepower# cap in interface ISP-1 trace match icmp any any
firepower# cap in2 interface isP-2 trace match icmp any any
Ingress capture:
firepower# show cap in
12 packets captured
1: 00:08:28.073604 172.16.1.202 > 172.16.1.254 icmp: echo request
2: 00:08:28.074672 172.16.1.254 > 172.16.1.202 icmp: echo reply
3: 00:08:29.150871 172.16.1.202 > 172.16.1.254 icmp: echo request
4: 00:08:29.151832 172.16.1.254 > 172.16.1.202 icmp: echo reply
5: 00:08:30.217701 172.16.1.202 > 172.16.1.254 icmp: echo request
6: 00:08:30.218876 172.16.1.254 > 172.16.1.202 icmp: echo reply
7: 00:08:31.247728 172.16.1.202 > 172.16.1.254 icmp: echo request
8: 00:08:31.248980 172.16.1.254 > 172.16.1.202 icmp: echo reply
9: 00:08:32.309005 172.16.1.202 > 172.16.1.254 icmp: echo request
10: 00:08:32.310317 172.16.1.254 > 172.16.1.202 icmp: echo reply
11: 00:08:33.386622 172.16.1.202 > 172.16.1.254 icmp: echo request
12: 00:08:33.387751 172.16.1.254 > 172.16.1.202 icmp: echo reply
12 packets shown
Egress capture:
firepower# show cap in2

12 packets captured

1: 00:08:28.073543 172.16.11.2 > 172.16.11.254 icmp: echo request
2: 00:08:28.074764 172.16.11.254 > 172.16.11.2 icmp: echo reply
3: 00:08:29.150810 172.16.11.2 > 172.16.11.254 icmp: echo request
4: 00:08:29.151954 172.16.11.254 > 172.16.11.2 icmp: echo reply
5: 00:08:30.217640 172.16.11.2 > 172.16.11.254 icmp: echo request
6: 00:08:30.218799 172.16.11.254 > 172.16.11.2 icmp: echo reply
7: 00:08:31.247667 172.16.11.2 > 172.16.11.254 icmp: echo request
8: 00:08:31.248888 172.16.11.254 > 172.16.11.2 icmp: echo reply
9: 00:08:32.308913 172.16.11.2 > 172.16.11.254 icmp: echo request
10: 00:08:32.310012 172.16.11.254 > 172.16.11.2 icmp: echo reply
11: 00:08:33.386576 172.16.11.2 > 172.16.11.254 icmp: echo request
12: 00:08:33.387888 172.16.11.254 > 172.16.11.2 icmp: echo reply
12 packets captured

Caution: Ensure to configure captures with Source and Destination IP addresses since captures can considerably increase performance on the box.

Tip: If ping does not work, troubleshoot the direct connection with the default gateway, check the ARP table, or contact Cisco TAC.
In order to check if PBR works, you can use the packet tracer tool to ensure application traffic is routed with PBR.
firepower# packet-tracer input insIDE tcp 172.16.35.2 54352 'PUBLIC-IP-ADDRESS-FOR-WEBEX' $
---
[Output omitted]
---
Phase: 3
Type: PBR-LOOKUP
Subtype: policy-route
Result: ALLOW
Config:
route-map FMC_GENERATED_PBR_1694885402369 permit 5
match ip address Applications
set ip next-hop 172.16.1.254
Additional Information:
Matched route-map FMC_GENERATED_PBR_1694885402369, sequence 5, permit
Found next-hop 172.16.1.254 using egress ifc ISP-1
---
[Output omitted]
---
Result:
input-interface: INSIDE
input-status: up
input-line-status: up
output-interface: ISP-1
output-status: up
output-line-status: up
Action: allow

Note: In order to learn about the application IP addresses for the network service configured on object groups, use the command show object-group network-service detail.
Related Information
Additional documents related to PBR with HTTP Path Monitoring can be found here:
- Policy-Based Routing Configuration on Secure Firewall Management Center Device Configuration Guide
- Path Monitoring on Policy-Based Routing Configuration on Secure Firewall Management Center Device Configuration Guide
- Configure Policy-Based Routing Policy
- Configuration Example for Policy-Based Routing
- Configure Example for PBR Path Monitoring
- Add Path Monitoring Dashboard
- DNS Platform Settings Configuration on Secure Firewall Management Center Device Configuration Guide
- Cisco Technical Support & Downloads
Revision History
| Revision | Publish Date | Comments |
|---|---|---|
1.0 |
10-Oct-2023
|
Initial Release |
Contributed by Cisco Engineers
- Juan Carlos Carvente JuarezCisco TAC Engineer
Contact Cisco
- Open a Support Case

- (Requires a Cisco Service Contract)
 Feedback