Introduction
This document describes the Grafana Stack components built-in Identity Services Engine (ISE) 3.3 through System 360 Advanced Monitoring.
Prerequisites
Requirements
Cisco recommends that you have knowledge of these topics:
- Cisco Identity Service Engine
- Grafana Stack
Components Used
The information in this document is based on these software and hardware versions:
The information in this document was created from the devices in a specific lab environment. All of the devices used in this document started with a cleared (default) configuration. If your network is live, ensure that you understand the potential impact of any command.
Background Information
System 360 includesMonitoringandLog Analytics features.
The Monitoring feature enables you to monitor a wide range of application and system statistics, and the key performance indicators (KPI) of all the nodes in a deployment from a centralized console. KPIs are useful to gain insight into the overall health of the node environment. Statistics offer a simplified representation of the system configurations and utilization-specific data.
Log Analytics provides a flexible analytics system for in-depth analysis of endpoint authentication, authorization, and accounting (AAA), and profiling syslog data. You can also analyze the Cisco ISE health summary and process statuses. You can generate reports that are similar to the Cisco ISE Counters and Health Summary report.
Grafana and Prometheus Stack
The Grafana stack is a third-party open-source software stack used to provide a graphical or text-based representation of statistics and counters collected within a given environment or software solution. It is conformed by Grafana, Prometheus and Node Exporter components:
- Grafana: Grafana is a visualization and analytics software that works with Prometheus. It allows you to query, visualize, alert on, and explore on a friendly way system metrics, logs, and traces stored in Prometheus database.
- Prometheus: Prometheus pulls, collects and stores time series data cached by Node Exporter.
- Node Exporter: Constantly measures various machine resources metrics such as memory, disk and CPU utilization and caches them.
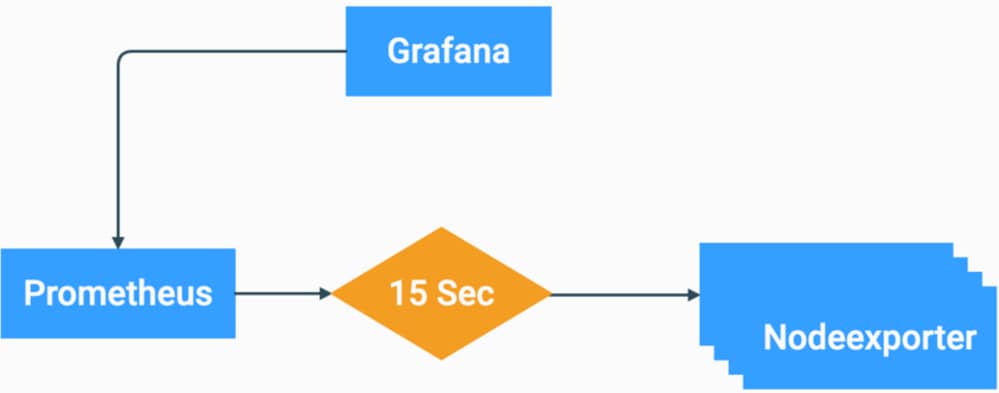 Grafana Stack Flow Chart
These components form a powerful stack for collecting, managing and analyzing diverse types of system metrics. This allows system administrators to have a real-time, and friendly visualization of the status and performance of their network solutions.
Grafana Stack for Advanced ISE Monitoring
- ISE do not require to have separate instances of Grafana stack on each node to monitor the whole deployment. The stack components running on each node depend on the roles that each ISE node has.
- Each ISE node in a deployment has its own Node exporter instance.
- Policy Administration Nodes (PAN) have independent Grafana and Prometheus instances.
- Prometheus can store up to 5GB or 7 day-old data. Once either of these thresholds is reached, the oldest data is purged first.
- The data collection, storage and processing is not handled by MnT collector. This means that enabling this feature does not have a significant impact on ISE Resource consumption.
- Monitoring feature is enabled by default.
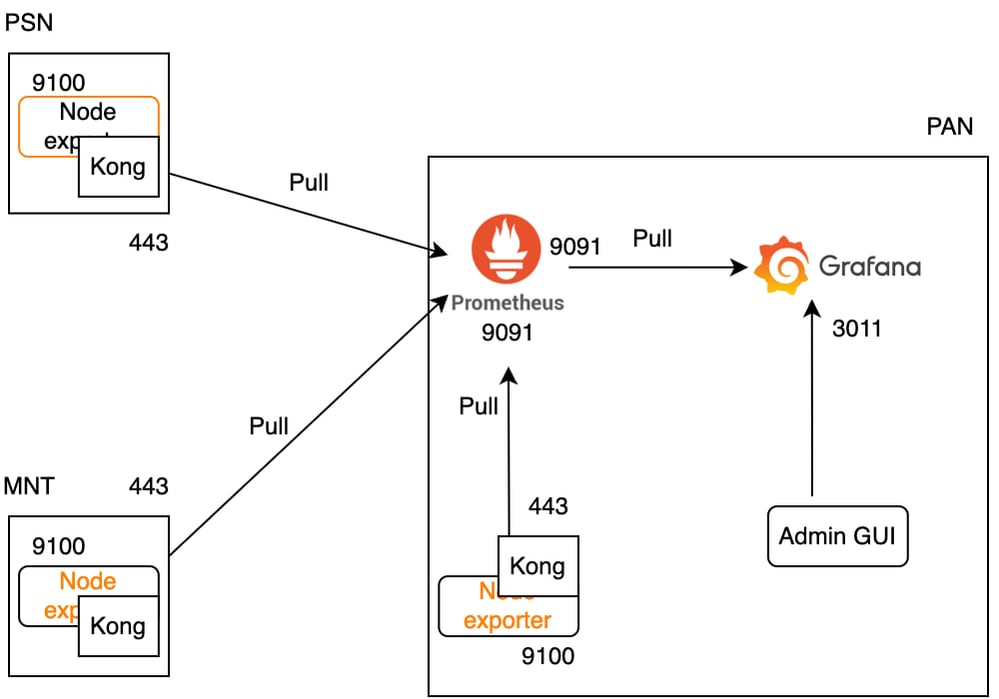 Grafana Flow for ISE Monitoring
Enable or Disable Monitoring
Monitoring is a feature that is enabled by default on ISE. However, you can enable or disable this feature at any time.
Navigate to Operations > System 360 > Settings and click the Monitoring button to Enable or Disable the feature.
Finally, click the Save button.
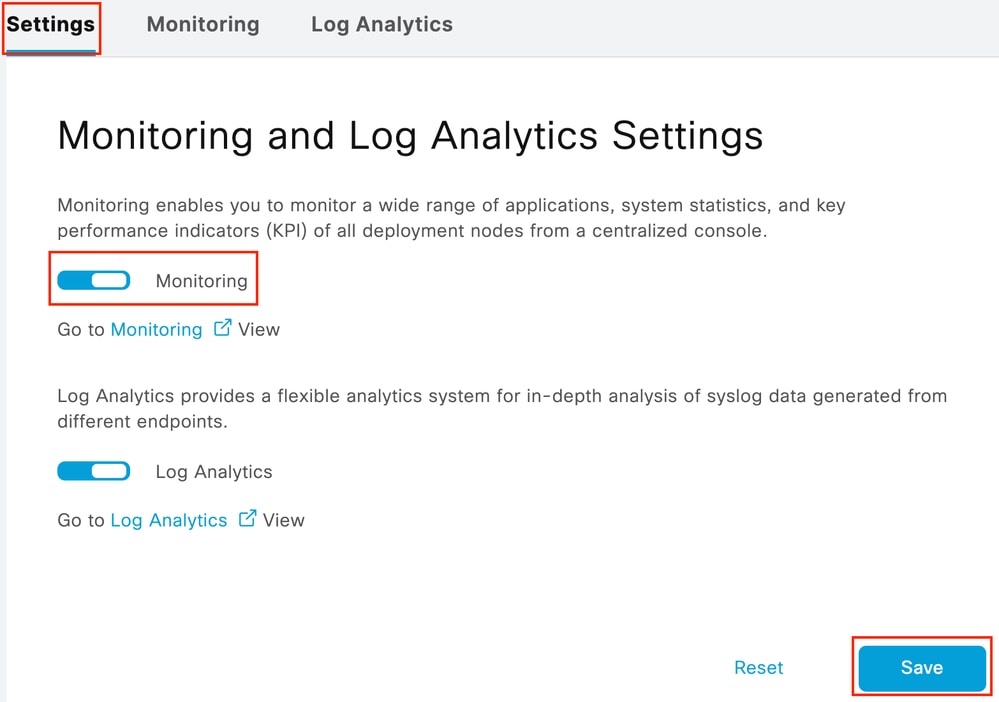 Enable or Disable Monitoring
ISE takes about a minute to initialize or shut down the Grafana stack, you can check the services status using show app stat ise.
vimontes-ise-33-1/admin#show application status ise

ISE PROCESS NAME                       STATE            PROCESS ID
--------------------------------------------------------------------
Database Listener                      running          81008
Database Server                        running          134 PROCESSES
Application Server                     running          518925
Profiler Database                      running          86939
ISE Indexing Engine                    running          486865
AD Connector                           running          90383
M&T Session Database                   running          486437
M&T Log Processor                      running          2564857
Certificate Authority Service          running          245113
EST Service                            running          583881
SXP Engine Service                     disabled
TC-NAC Service                         disabled
PassiveID WMI Service                  disabled
PassiveID Syslog Service               disabled
PassiveID API Service                  disabled
PassiveID Agent Service                disabled
PassiveID Endpoint Service             disabled
PassiveID SPAN Service                 disabled
DHCP Server (dhcpd)                    disabled
DNS Server (named)                     disabled
ISE Messaging Service                  running          247148
ISE API Gateway Database Service       running          488895
ISE API Gateway Service                running          501344
ISE pxGrid Direct Service              running          559099
Segmentation Policy Service            disabled
REST Auth Service                      disabled
SSE Connector                          disabled
Hermes (pxGrid Cloud Agent)            disabled
McTrust (Meraki Sync Service)          disabled
ISE Node Exporter                      running          91058
ISE Prometheus Service                 running          357191
ISE Grafana Service                    running          504738
ISE MNT LogAnalytics Elasticsearch     running          359800
ISE Logstash Service                   running          362762
ISE Kibana Service                     running          365658
ISE Native IPSec Service               running          507795
MFC Profiler                           running          574221

Note: Depending on the personas running on each ISE node, it can be expected to see some of the Grafana Stack services in not running status even when Monitoring is enabled.
Navigation Menu
Navigate to Operations > System 360 > Monitoring to have access to Grafana Navigaton Menu. Navigation Menu is located to the left of the dashboard that ISE displays.
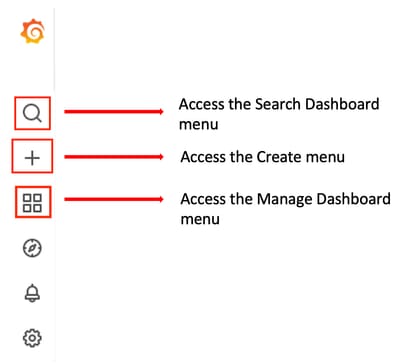 Grafana Navigation Menu
Built-in Dashboards
ISE by default has two built-in dashboard called ISE-Dashboard and MFC Profiler. These dashboard displays the most common Key Performance Indicators (KPIs),such as Memory, CPU and Disk statistics, separately for each ISE node in the deployment. These dashboards can also display process consumption metrics.
In order to access these dashboard, navigate to Operations > System 360 > Monitoring menu. By default, ISE displays ISE-Dashboard.

Note: Monitoring menu does not show in the GUI if the feature is not enabled.
You can select the ISE node, modify the time span of the displayed information and the dashboard refresh rate.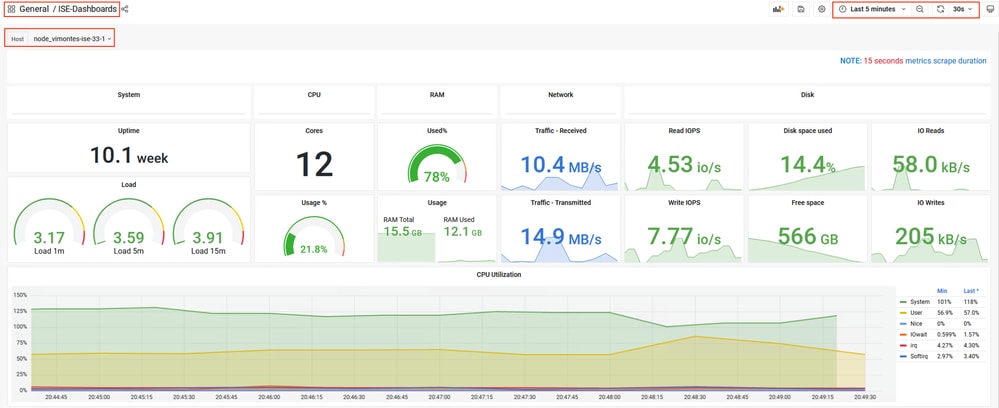 Monitoring Built-in Dashboard
To switch between dashboards, click on the four-square icon  . This opens the Manage Dashboard window. From this window, you can select between the different existing dashboards.
 Switching Between Dashboards

Note: ISE server and client machine must have the same time to avoid data inconsistencies. If a time mismatch is detected, ISE shows this warning after accessing to the built-in dashboard: "A time mismatch is detected between ISE server and client machine which can lead to inconsistent Grafana behaviour, kindly sync time on both machines."
Create Your Own Dashboard
Additional to the built-in dashboards provided, you can create your own Dashboards from zero.
Step 1. Enter the New Dashboard Menu
Navigate under Operations > System 360 > Monitoring.
Click the plus (+) icon on the Grafana Navigation Menu and click Dashboard.
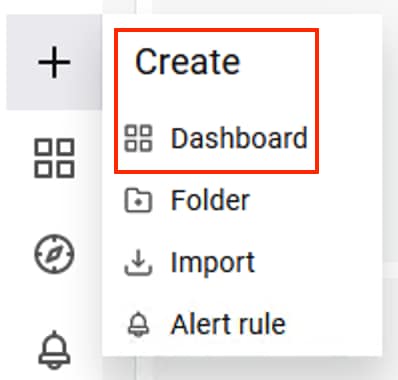 Create New Dashboard
Step 2. Add a Panel
Select Add a new panel option. This displays the Edit Panel window. Add a New Panel
This is how the Edit Panel window looks:
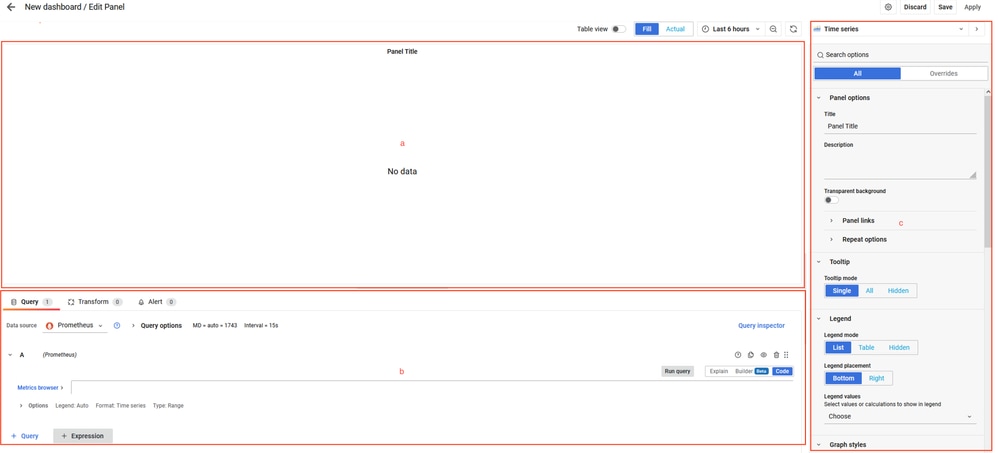 Dashboard Creation Area
a. Visualization area: Shows the graphic representation of the data pulled from the Prometheus database.
b. Data Queries area: You can select the queries to pull specific metrics and data stored in Prometheus database.
c. Panel Options area: Provides an extensive amount of options to modify the graphic panel that displays the data.
Step 3. Create Panels by Using Queries
Troubleshooting
- Verify the Monitoring feature is enabled.
- Verify the Grafana stack services are running on the ISE nodes, depending on the enabled personas on each ISE node.
- Each Grafana stack component has a separate log, you can access these log files using these commands on ISE CLI:
vimontes-ise-33-1/admin#show logging application ise-prometheus/prometheus.log
vimontes-ise-33-1/admin#show logging application ise-node-exporter/node-exporter.log
vimontes-ise-33-1/admin#show logging application ise-grafana/grafana.log

Note: There are no specific components to set to debug level to troubleshoot this feature. Gathering these log files is enough.
Related Information


 Feedback