Troubleshoot Unexpected Secure Firewall and Firepower Reboot
Available Languages
Contents
Introduction
This document describes the troubleshooting steps for unexpected reloads of Secure Firewall/Firepower firewalls.
Prerequisites
Requirements
Basic product knowledge.
Components Used
The information in this document is based on these software and hardware versions:
- Secure Firewall 1200, 3100, 4200
- Firepower 1000, 4100, 9300
- Cisco Secure eXtensible Operating System (FXOS) 2.16(0.136)
- Cisco Secure Firewall Threat Defense (FTD) 7.6.1.291
- Cisco Secure Firewall Management Center (FMC) 7.6.1.291
- Adaptive Security Appliance (ASA) 9.22.2.9
The information in this document was created from the devices in a specific lab environment. All of the devices used in this document started with a cleared (default) configuration. If your network is live, ensure that you understand the potential impact of any command.
Abbreviations
| Abbreviations |
Explanation |
| FXOS |
Firepower Extensible Operating System: The underlying operating system that runs on the Firepower 1000, 2100, 3100, 4100, 4200, and 9300 platforms. |
| Application |
Any application that runs on top of the FXOS platform (ASA or Secure Firewall Threat Defense). |
| SSP |
Security Services Platform: This term refers to the Cisco security hardware platforms that runs FXOS. |
| OBFL |
Onboard Failure Logging: The log file that stores fault-related data; for example, memory errors, bus errors, interrupts. The file resides in the CIMC. |
| CMC |
Chassis Management Controller. |
| CIMC |
Cisco Integrated Management Controller. |
| SEL |
System Event Log (SEL): The system event log resides on the CIMC on the security module in NVRAM. |
| PSU |
Power Supply Unit. |
| PDU |
Power Distribution Unit. |
| PECI |
Platform Environment Control Interface Bus: This is the bus between the board management controller (BMC) and the CPU and Platform Controller Hub (PCH). PECI is used to collect data from CPU, DIMM, and so on. |
| BMC |
Board Management Controller. |
| NPU |
Network Processor Unit. |
| FPGA |
Field-Programmable Gate Array. |
| SAM |
The FXOS Management is a collection of processes that provides chassis management functionality and is also collectively called the SAM (Server Array Manager). |
| ECC |
Error Correcting Code memory is a type of computer memory that can detect and correct errors in data as it is stored or retrieved. |
| PCIe |
PCI Express, Peripheral Component Interconnect Express. |
| PBTN (Power Button): |
PBTN represents a physical power button press. |
Background Information
In this document, “reboot”, “reload”, and “restart” are used interchangeably. From the user perspective an unexpected reboot can roughly be defined as any reboot except for these cases that are well known, documented or expected:
- Reboot due to software installation or upgrades.
- Reboot due to user-triggered actions such as, a reboot from the command line interface (CLI), graphical user interface (UI), or manual power off/on actions.
Depending on the trigger, a reboot can be either graceful or ungraceful:
- A graceful reboot generally refers to restarting a system, device, or service that allows all current processes to complete properly and all files or data to be saved before the restart occurs. This helps to avoid data loss or corruption. Examples of graceful reboot include:
- Reboot due to software installation or upgrades.
- Reboots due to user-triggered actions such as, a reboot from the CLI or the GUI.
- In some cases, software traceback.
- An ungraceful reboot is the opposite of a graceful reboots, when system reboots ungracefully, that is without graceful termination of processes. Ungraceful reboots can result in data loss or corruption. Examples of triggers include:
- Accidental power off and on by disconnecting all power cables or switching the power button.
- Shortages in power supply, issues in chassis power supply units.
- Varius issues in hardware, FPGA, environmental and so on, that cause abrupt reboot(s).
Common causes of reboots:
- Actions by users from CLI or management UI.
- Software upgrades or downgrades.
- Software traceback.
- Triggers by OS/system-critical processes for reasons other than traceback in software.
- Hardware issues such as damaged SSD, memory errors, exceptions in CPU, internal FPGA, and so on.
- Environmental issues, such as power loss, overheating, and so on.
- Software defects or other issues in third party components.
- High disk space usage.
In chassis-based platforms, it is important to consider the scope of the reboot, specifically, what exactly rebooted:
- The ASA/FTD application.
- The security module (Firepower 4100/9300).
- The chassis.
The default behavior includes:
- If a reboot on FTD running in native mode, ASA on Firepower 1000/2100, or Secure Firewall 3100/4200 is triggered; the chassis also reboots.
- If a reboot on FTD running in native mode, ASA on Firepower 4100/9300, or security modules is triggered, the security module also reboots. The chassis is not affected.
- If a reboot on FTD multi-instance mode on Firepower 4100/9300 security modules is triggered, only that instance reboots and the security module and chassis are not affected.
- If a reboot on FTD multi-instance mode on Secure Firewall 3100 and 4200 is triggered, only that instance reboots and the chassis is not affected.
- A reboot on Firepower 4100/9300 security module also reboots, all applications running on the affected modules irrespective of native multi-instance mode.
- A reboot on the chassis also reboots all security modules and all applications.
The termination of certain critical processes, whether graceful or ungraceful can cause reboots. For example:
- If the data plane process, also known as the lina terminates due to traceback, the firewall reboots. The exception is the software version with the “Data plane quick reload” feature introduced in ASA 9.20(x) and FTD 7.4.1 for specific platforms.
- If the process manager pm terminates, the firewall reboots.
Troubleshooting Workflow
Review the troubleshooting workflow that refers to the troubleshooting steps:
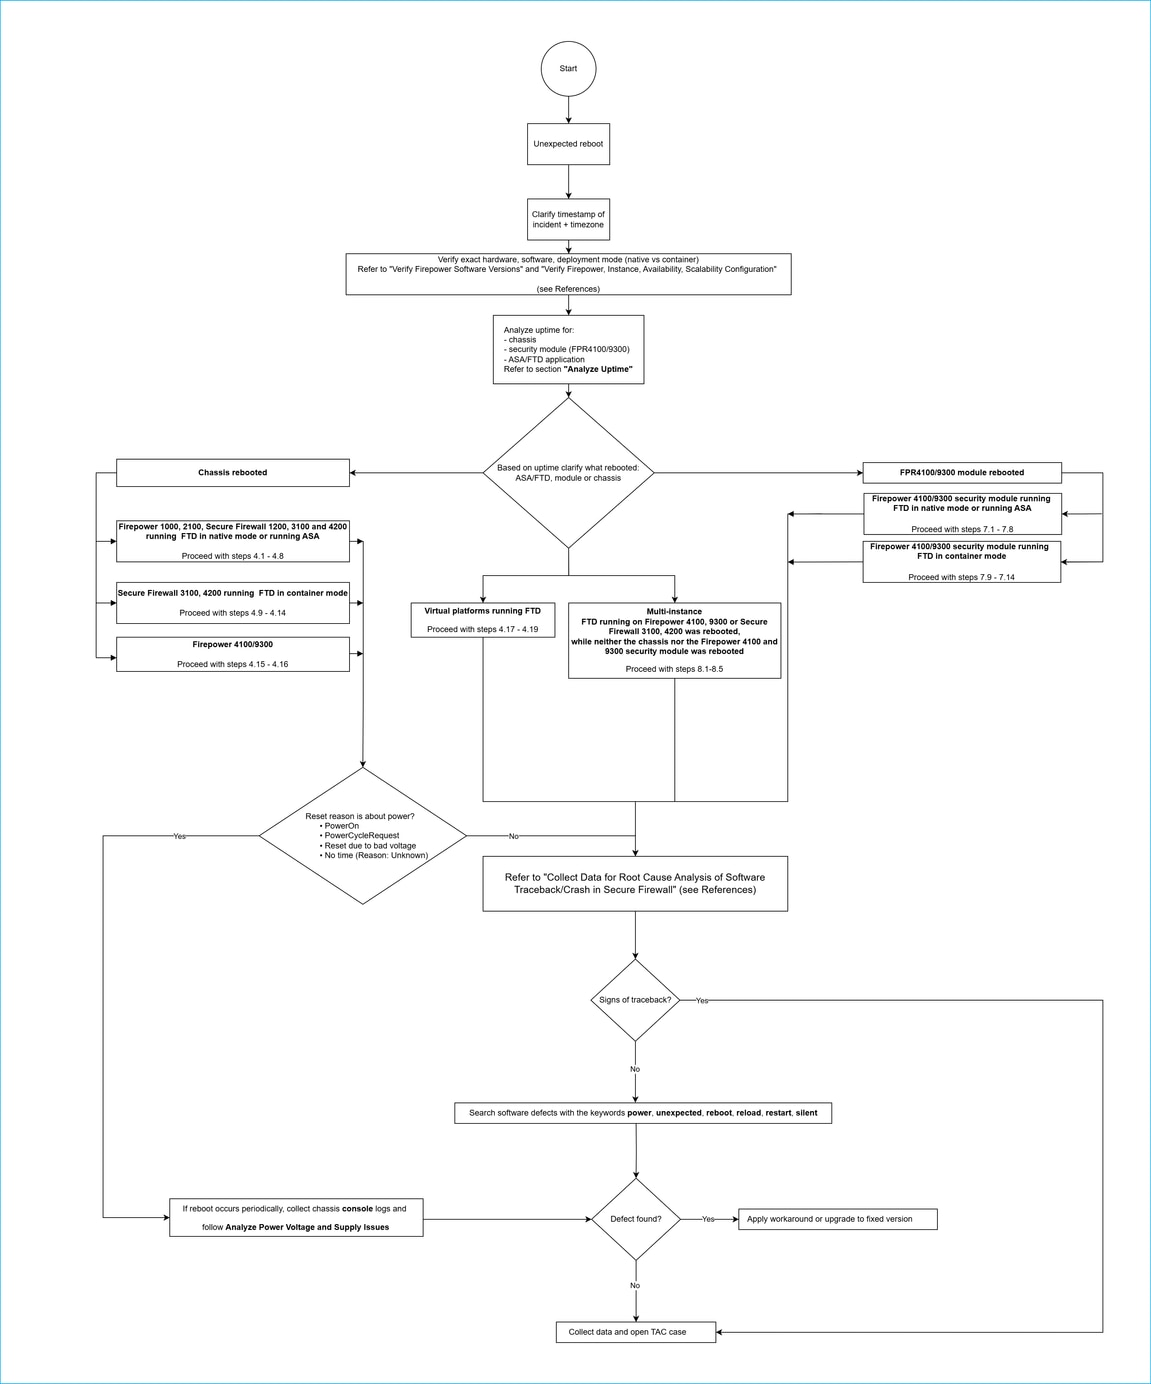
Troubleshooting Steps
- Take note of the event timestamp as precisely as possible, ensuring you consider the time zone.
- Verify the exact hardware, secure the firewall software type (ASA or FTD), software version, and deployment mode (native or multi-instance mode). Refer to Verify Firepower Software Versions, Verify Firepower, Instance, Availability, Scalability Configuration for detailed verification steps.
- Refer to the Analyze the Uptime section to correlate the uptime of the ASA/FTD application, security module (Firepower 4100/9300 only), and the chassis. The goal is to clarify the reboot scope, the application, security module, or chassis.
- If the chassis was rebooted, proceed with these steps:
Firepower 1000, 2100, Secure Firewall 1200, 3100 and 4200 Running FTD in Native Mode or Running ASA
4.1. Check the Analyze FTD messages Files section (FTD only).
4.2. Check the Analyze ssp-pm.log Files section.
4.3. Check the Analyze ssp-shutdown.log Files section.
4.4. Check the Analyze ASA/FTD Console logs section.
4.5. Proceed with the steps in Collect Data for Root Cause Analysis of Software Traceback/Crash in Secure Firewall to verify symptoms of software traceback and for data collection.
4.6. Check the Analyze Chassis Reset Reasons section.
4.7. Check the Analyze Hardware Errors or Exceptions section.
4.8. Check the Analyze Platform log Files section.
Secure Firewall 3100, 4200 Running FTD in Container Mode
4.9. Check the Analyze ssp-pm.log Files section.
4.10. Check the Analyze ssp-shutdown.log Files section.
4.11. Proceed with the steps in Collect Data for Root Cause Analysis of Software Traceback/Crash in Secure Firewall to verify symptoms of software traceback and for data collection.
4.12. Check the Analyze Chassis Reset Reasons section.
4.13. Check the Analyze Hardware Errors or Exceptions section.
4.14. Check the Analyze Platform log Files section.
Firepower 4100/9300
4.15. Check the Analyze Chassis Reset Reasons section.
4.16. Proceed with the steps in Collect Data for Root Cause Analysis of Software Traceback/Crash in Secure Firewall to verify symptoms of software traceback and for data collection.
Virtual Platforms Running FTD
4.17. Check the Analyze FTD messages Files section.
4.18. Check the Analyze ASA/FTD Console logs section.
4.19. Proceed with the steps in Collect Data for Root Cause Analysis of Software Traceback/Crash in Secure Firewall to verify symptoms of software traceback and for data collection.
- If reset reasons such as these are found in the Analyze Chassis Reset Reasons section, then refer to the Analyze Power Voltage and Supply Issues:
- PowerOn
- PowerCycleRequest
- Reset due to bad voltage
- No time (Reason: Unknown)
- If the chassis reboot is recurring, collect console logs.
- Proceed with these steps for Firepower 4100/9300 if the security module was rebooted:
Firepower 4100/9300 Security Module Running FTD in Native Mode or Running ASA
7.1. Check the Analyze FTD messages Files section (FTD only).
7.2. Check the Analyze ssp-pm.log Files section.
7.3. Check the Analyze ssp-shutdown.log Files section.
7.4. Check the Analyze ASA/FTD Console logs section.
7.5. Proceed with the steps in Collect Data for Root Cause Analysis of Software Traceback/Crash in Secure Firewall to verify symptoms of software traceback and for data collection.
7.6. Check the Analyze Hardware Errors or Exceptions section.
7.7. Check the Analyze SEL/OBFL files section.
7.8. Check the Analyze Platform log Files section.
Firepower 4100/9300 Security Module Running FTD in Container Mode
7.9. Check the Analyze ssp-pm.log Files section.
7.10. Check the Analyze ssp-shutdown.log Files section.
7.11. Proceed with the steps in Collect Data for Root Cause Analysis of Software Traceback/Crash in Secure Firewall to verify symptoms of software traceback and for data collection.
7.12. Check the Analyze Hardware Errors or Exceptions section.
7.13. Check the Analyze SEL/OBFL Files section.
7.14. Check the Analyze Platform log Files section.
- Proceed with these steps if a multi-instance FTD running on Firepower 4100, 9300, or Secure Firewall 3100, 4200 was rebooted, but neither the chassis nor the Firepower 4100 and 9300 security module was rebooted:
8.1. Check the Analyze FTD messages Files section.
8.2. Check the Analyze ssp-pm.log Files section.
8.3. Check the Analyze ssp-shutdown.log Files section.
8.4. Check the Analyze ASA/FTD Console logs section.
8.5. Proceed with the steps in Collect Data for Root Cause Analysis of Software Traceback/Crash in Secure Firewall to verify symptoms of software traceback and for data collection.
9. If there are signs of reboots due to software traceback, open a TAC case and provide the collected data.
10. Search software defects with the keywords unexpected, reboot, power, reload, restart, silent:
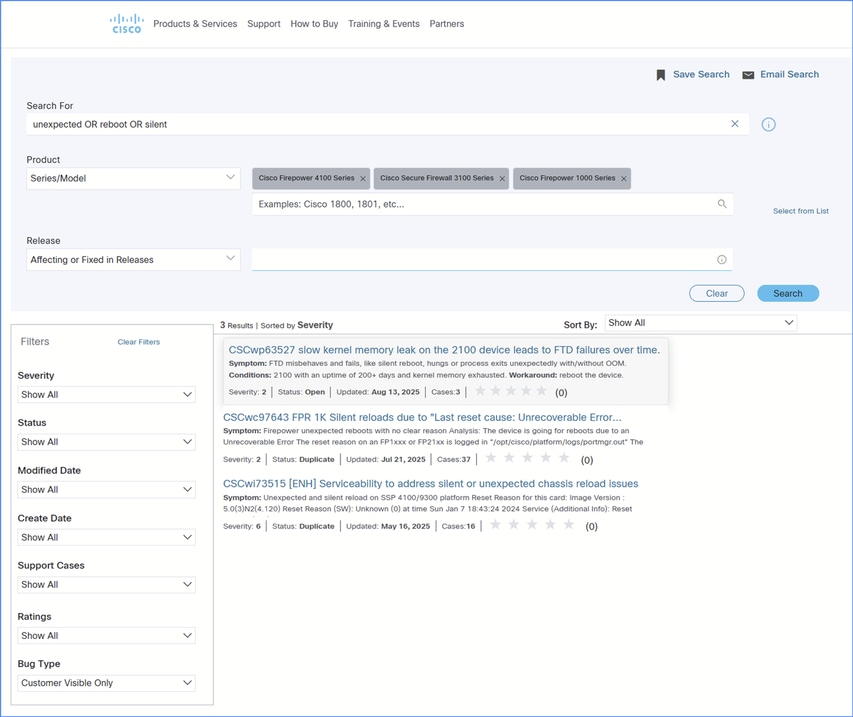
If a matching defect is found:
- Ensure ] the symptoms and conditions match those described in the defect.
- Apply a workaround, if any.
- Upgrade to the fixed version, if any.
11. Go through the Data Collection section and open a TAC case.
Analyze Uptime
The goal of this section is to check the uptime of the ASA/FTD application, the security module (Firepower 4100/9300 only), and the chassis.
- Check the firewall engine uptime running the show version command on ASA, and the show version system command on FTD:
> show version system
---------------[ firewall-FTD ]---------------
Model                     : Cisco Firepower 4112 Threat Defense (76) Version 7.6.1 (Build 291)
UUID                      : e9460e12-674c-11f0-97e5-d5ad3617d287
LSP version               : lsp-rel-20241211-1948
VDB version               : 408
---------------------------------------------------

Cisco Adaptive Security Appliance Software Version 9.22(1)21
SSP Operating System Version 2.16(0.3007)

Compiled on Thu 29-May-25 01:38 GMT by fpbesprd
System image file is "disk0:/fxos-lfbff-k8.2.16.0.136.SPA"

Config file at boot was "startup-config"

firewall-FTD up 5 days 0 hours
In the FTD troubleshoot file, check the file command-outputs/'usr-local-sf-bin-sfcli.pl show_tech_support asa_lina_cli_util.output’:
/command-outputs$ less 'usr-local-sf-bin-sfcli.pl show_tech_support asa_lina_cli_util.output'
…
firewall-FTD up 5 days 0 hours
…
For ASA, check the uptime in the show-tech file.
- For FTDs running in native mode on virtual platforms, Firepower 1000, 2100, Secure Firewall 1200, 3100, and 4200; check the operating system uptime (days, hours, and minutes) in expert mode. In this case, the chassis uptime is roughly the same as the operating system uptime:
> expert
admin@firepower:/ngfw/Volume/home/admin$ uptime
 06:30:40 up 6 days,  8:01,  1 user,  load average: 5.14, 5.45, 5.48
In the FTD troubleshoot file, check the file dir-archives/var-log/top.log:
dir-archives/var-log$ less top.log
===================================================================================================

Tue Jul 22 04:02:11 UTC 2025

top - 04:02:11 up 6 days, 13:57,  4 users,  load average: 2.23, 2.42, 2.59
Tasks: 167 total,   2 running, 165 sleeping,   0 stopped,   0 zombie
%Cpu(s): 26.6 us,  7.8 sy,  1.6 ni, 64.1 id,  0.0 wa,  0.0 hi,  0.0 si,  0.0 st
MiB Mem :   7629.8 total,   2438.4 free,   4559.6 used,    631.8 buff/cache
MiB Swap:   5369.2 total,   3713.7 free,   1655.5 used.   2849.9 avail Mem
-
For FTD in multi-instance mode on Secure Firewall 3100 or 4200, and ASA running on Firepower 1000, 2100, Secure Firewall 1200, 3100, and 4200, there is no command available to check the chassis uptime.
You can check the blade uptime:
> connect fxos
…
firewall# scope ssa
firewall /ssa # show slot detail expand

Slot:
    Slot ID: 1
    …
        Blade Uptime: up 16 hours, 2 min
In the chassis troubleshoot file, check the uptime in opt/cisco/platform/logs/sysmgr/sam_logs/topout.log file:
opt/cisco/platform/logs/sysmgr/sam_logs/topout.log $ less topout.log
[Jul 23 13:15:22]
top - 13:15:22 up 16:02,  1 user,  load average: 12.24, 11.85, 11.75
- In the case of Firepower 4100/9300, check the chassis and security module uptime in the FXOS CLI.
Chassis uptime:
firewall /ssa # connect fxos
firewall(fxos)# show system uptime
System start time:          Tue Jul 22 21:57:44 2025
System uptime:              6 days, 9 hours, 49 minutes, 50 seconds
Kernel uptime:              6 days, 9 hours, 45 minutes, 58 seconds
Active supervisor uptime:   6 days, 9 hours, 49 minutes, 50 seconds
Security module uptime:
firewall# scope ssa
firewall /ssa # show slot detail expand
Slot:
    Slot ID: 1
    …
        Blade Uptime: up 5 days, 37 min
In the chassis troubleshoot file, run the outputs of the show system uptime command in file *_BC1_all/FPRM_A_TechSupport/sw_techsupportinfo,and the show slot expand detail expand command in file *_BC1_all/FPRM_A_TechSupport/sam_techsupportinfo where * is the part of the troubleshoot file name, for example, 20250311123356_ FW_BC1_all.
Analyze FTD Messages Files
This section covers the analysis of the FTD messages file that contains logs related to shutdown, reboot, and potential triggers.
FTD Running on all Platforms
The file contains logs related to shutdown, reboot, and their potential triggers on FTD running on:
- Virtual platforms, Firepower 1000, 2100, and Secure Firewall 1200, 3100, 4200 chassis.
- Firepower 4100 and 9300 security modules.
The file is accessible in:
- FTD CLISH in expert mode: /ngfw/var/log/messages
- FTD troubleshoot file: dir-archives/var-log/messages
To find the trigger of shutdowns or reboots, check messages containing Defense in the messages file within the FTD troubleshoot files. Ensure you check all messages files including messages.1, messages.2, and so on. These messages clearly indicate a graceful shutdown:
- Stopping Cisco Secure Firewall…or Stopping Cisco Firepower…
- …Threat Defense is shutting down
root@CSF1220-2:/ngfw/var/log# grep -a Defense /ngfw/var/log/messages
messages:Jul 22 21:07:10 firepower-1220 SF-IMS[36894]: [36894] S11audit-startup-shutdown:start [INFO] Cisco Secure Firewall 1220CX Threat Defense has started
messages:Jul 22 21:12:37 firepower-1220 SF-IMS[62594]: [62594] sensor:CLI Start [INFO] Starting Cisco Secure Firewall 1220CX Threat Defense
messages:Jul 22 21:13:03 firepower-1220 SF-IMS[65410]: [65410] S99sensor:CLI Start [INFO] Starting Cisco Secure Firewall 1220CX Threat Defense
messages:Jul 23 12:56:43 CSF1220-2 SF-IMS[61878]: [61878] K01sensor:CLI Stop [INFO] Stopping Cisco Secure Firewall 1220CX Threat Defense
messages:Jul 23 12:57:03 CSF1220-2 SF-IMS[62749]: [62749] K69audit-startup-shutdown:stop [INFO] Cisco Secure Firewall 1220CX Threat Defense is shutting down
messages:Jul 23 13:00:21 CSF1220-2 SF-IMS[10866]: [10866] S11audit-startup-shutdown:start [INFO] Cisco Secure Firewall 1220CX Threat Defense has started
messages:Jul 23 13:00:36 CSF1220-2 SF-IMS[13443]: [13443] S99sensor:CLI Start [INFO] Starting Cisco Secure Firewall 1220CX Threat Defense
root@1140-2:/ngfw/var/log# grep -a Defense /ngfw/var/log/messages

messages:Jul 22 09:20:42 FPR1140-2 SF-IMS[6012]: [6012] S11audit-startup-shutdown:start [INFO] Cisco Firepower 1140 Threat Defense has started
messages:Jul 22 09:21:35 FPR1140-2 SF-IMS[9050]: [9050] S99sensor:CLI Start [INFO] Starting Cisco Firepower 1140 Threat Defense
messages:Jul 22 11:32:37 FPR1140-2 SF-IMS[15129]: [15129] K01sensor:CLI Stop [INFO] Stopping Cisco Firepower 1140 Threat Defense
messages:Jul 22 11:32:55 FPR1140-2 SF-IMS[15940]: [15940] K69audit-startup-shutdown:stop [INFO] Cisco Firepower 1140 Threat Defense is shutting down
messages:Jul 22 11:36:38 FPR1140-2 SF-IMS[5980]: [5980] S11audit-startup-shutdown:start [INFO] Cisco Firepower 1140 Threat Defense has started
messages:Jul 22 11:36:53 FPR1140-2 SF-IMS[7594]: [7594] S99sensor:CLI Start [INFO] Starting Cisco Firepower 1140 Threat Defense
Analyze Security Module or Chassis Messages Files
This section covers the analysis of the security module or chassis messages file that contains logs related to the OS kernel.
The file contains logs related to shutdown, reboot, and their potential triggers on FTD running on:
- Firepower 1000, 2100 and Secure Firewall 1200, 3100, 4200 chassis.
- Firepower 4100 and 9300 security modules.
The file is accessible in:
- Hardware-based FTD running in native mode: /opt/cisco/platform/log/messages.
- Troubleshoot the file of hardware-based FTD running in native mode: dir-archives/opt-cisco-platform-logs/messages.
- Firepower 1000, 2100 and Secure Firewall 1200, 3100, 4200 chassis troubleshoot file: /opt/cisco/platform/log/messages.
- Firepower 4100/9300 security module show-tech file: /opt/cisco/platform/log/messages.
These are the key points on the logs in this file:
- Ensure you check all message files including messages.1, messages.2, and so on.
- When the OS kernel boots, the kernel logs are written to this file. On hardware platforms and security modules, logs are initially written in the UTC time zone until the custom time zone is applied during the boot time.
For this reason, different logs in the same file can have different timestamps with different time zones.
Consider this example from a Firepower 4100 security module with the UTC+2 time zone:
2025-08-18T14:54:16+02:00 Firepower-module1/2 root: FXOS shutdown log started: pid = 52994 cmdline = /bin/sh/sbin/fxos_log_shutdown ####
2025-08-18T14:54:16+02:00 Firepower-module1/2 root: FXOS shutdown log completed: pid = 52994
2025-08-18T14:54:17+02:00 Firepower-module1/2 syslog-ng[1230]: syslog-ng shutting down; version='3.36.1' <--- syslog-ng shutting down indicates graceful shutdown
2025-08-18T12:57:11+00:00 intel-x86-64/1 syslog-ng[1237]: syslog-ng starting up; version='3.36.1' <--- syslog-ng start timestamp with UTC timezone
2025-08-18T12:57:11+00:00 intel-x86-64/1 kernel: [    0.000000] Linux version 5.10.200-yocto-standard (oe-user@oe-host) (x86_64-wrs-linux-gcc (GCC) 10.3.0, GNU ld (GNU Binutils) 2.36.1.20210703) #1 SMP Fri Feb 7 01:00:00 UTC 2025
2025-08-18T12:57:11+00:00 intel-x86-64/1 kernel: [    0.000000] Command line: rw console=ttyS0,38400 loglevel=2 auto kstack=128 reboot=force panic=1 ide_generic.probe_mask=0x1 ide1=noprobe pci=nocrs pci=realloc processor.max_cstate=1 iommu=pt nousb platform=sspxru boot_img=disk0:/fxos-lfbff-k8.2.16.0.136.SPA ciscodmasz=1048576 cisconrsvsz=1572864 hugepagesz=1g hugepages=12 pti=off  rom_ver=1.3.1.44 ssp_mode=0
…
2025-08-18T12:58:34+00:00 intel-x86-64/1 csp-console: Adi not started yet, trying to bring up
2025-08-18T12:58:34+00:00 intel-x86-64/1 ssp_tz[12159]: INFO: Lina is started
2025-08-18T12:58:34+00:00 intel-x86-64/1 SMA: INFO ExecProcessorMain [140588852127296]: finished processing of sma_slot1.deletePlatformLicense, removed it from queue
2025-08-18T12:58:34+00:00 intel-x86-64/1 ssp_tz[12167]: INFO: notify TZ to ASA LINA <---- Time zone change was propagated to the firewall
2025-08-18T14:58:35+02:00 intel-x86-64/1 ssp_tz[12192]: INFO: successfully notified TZ to ASA LINA, wait <---- Logs with the UTC+2 timestamp
2025-08-18T14:58:36+02:00 intel-x86-64/1 csp-console: Adi not started yet, trying to bring up
2025-08-18T14:58:39+02:00 intel-x86-64/1 csp-console[1237]: Last message 'Adi not started yet,' repeated 1 times, suppressed by syslog-ng on intel-x86-64
Analyze ssp-pm.log Files
This section covers the analysis of the /opt/cisco/platform/logs/ssp-pm.log files that contain logs related to ASA/FTD application shutdown or reboot.
The file contains shutdown or reboot logs for ASA/FTD applications running on:
- Firepower 1000, 2100 and Secure Firewall 1200, 3100, 4200 chassis.
- Firepower 4100 and 9300 security modules (not the chassis).
The file is only accessible in:
- FTD native mode (not multi-instance) CLISH in expert mode: opt/cisco/platform/logs/ssp-pm.log.
- FTD native mode troubleshoot file: dir-archives/opt-cisco-platform-logs/ssp-pm.log.
- Chassis troubleshoot file on Firepower 1000, 2100 and Secure Firewall 1200, 3100, 4200: /opt/cisco/platform/logs/ssp-pm.log.
To identify graceful shutdowns or reboots, look for lines like SHUTDOWN WARNING matching the reboot/shutdown timestamp. Ensure you check all ssp-pm.log files including ssp-pm.log.1, ssp-pm.log.2, and so on. These messages clearly indicate a graceful shutdown:
Fri Jul 25 10:28:51 UTC 2025 -(PM_UTILS)- SHUTDOWN WARNING: Beginning System Shutdown request for CSP Apps
Fri Jul 25 10:28:51 UTC 2025 -(PM_UTILS)- SHUTDOWN WARNING:-GetShutdownMaxForceQuitTimer: acquiring max force_quit_timeout from all heimdall confs
Fri Jul 25 10:28:51 UTC 2025 -(PM_UTILS)- SHUTDOWN WARNING: Upgrade process ready for reboot
Fri Jul 25 10:28:51 UTC 2025 -(PM_UTILS)- SHUTDOWN WARNING:-GetShutdownMaxForceQuitTimer: No force_quit_timeout found among conf files. Sendsigs_Sleep = 1
Fri Jul 25 10:28:51 UTC 2025 -(PM_UTILS)- SHUTDOWN WARNING: Continue System Shutdown request for CSP Apps
Fri Jul 25 10:28:51 UTC 2025 -(PM_UTILS)- SHUTDOWN WARNING:-SysShutdown_HeimdallSvcDownAllCspApps: corresponding heimdall conf file folder:
cisco-asa.9.22.2.9__asa_001_JMX2324G1DJ947ECO1.conf
Fri Jul 25 10:28:51 UTC 2025 -(PM_UTILS)- SHUTDOWN WARNING:-SysShutdown_HeimdallSvcDownAllCspApps: corresponding cspCfgXML file folder:
...cspCfg_cisco-asa.9.22.2.9__asa_001_JMX2324G1DJ947ECO1.xml.allocated_cpu_core
…
Fri Jul 25 10:28:51 UTC 2025 -(PM_UTILS)- SHUTDOWN WARNING:-SysShutdown_HeimdallSvcDownAllCspApps: stopping all CSPs according to existing heimdall/etc/confs
Fri Jul 25 10:28:51 UTC 2025 -(PM_UTILS)- SHUTDOWN WARNING:-SysShutdown_HeimdallSvcDownAllCspApps: Stopping App for CONF:cisco-asa.9.22.2.9__asa_001_JMX2324G1DJ947ECO1.conf
Analyze ssp-shutdown.log Files
This section covers the analysis of the /opt/cisco/platform/logs/ssp-shutdown.log files, which contain logs generated when the chassis/security module shuts down or reboots.
The file contains shutdown or reboot logs for:
- Firepower 1000, 2100 and Secure Firewall 1200, 3100, 4200 chassis.
- Firepower 4100 and 9300 security modules (not the chassis).
The file is accessible only in:
- FTD native mode (not multi-instance) CLISH in expert mode: opt/cisco/platform/logs/ssp-shutdown.log.
- FTD native mode troubleshoot file: dir-archives/opt-cisco-platform-logs/ssp-shutdown.log.
- chassis troubleshoot file of Firepower 1000, 2100 and Secure Firewall 1200, 3100, 4200: /opt/cisco/platform/logs/ssp-shutdown.log.
- Firepower 4100/9300 security module troubleshoot file: opt/cisco/platform/logs/ssp-shutdown.log.
Refer to the Troubleshoot Firepower File Generation Procedures on how to generate the FTD, chassis, and security module troubleshoot files.
To find the trigger of graceful shutdowns or reboots, walkthrough these steps:
- Check the lines like FXOS shutdown started matching the reboot/shutdown timestamp. Ensure to check all ssp-shutdown.log files including ssp-shutdown.log.1, ssp-shutdown.log.2, and so on.
#### Wed Jul 23 12:56:42 UTC 2025: FXOS shutdown started: pid = 61677 cmdline = /bin/sh/sbin/fxos_log_shutdown
- Look for lines within the process tree that contain fxos_log_shutdown or shutdown or reboot.sh.
Example 1: The request for a reboot came from a peer with UUID 068f09e6-3825-11ee-a72c-e78d34d303cc and IP address 192.0.2.100, which is the FMC:
root     61074  4593  2 12:56 ?        00:00:00          |   \_ /usr/bin/perl /ngfw/usr/local/sf/bin/exec_perl.pl 068f09e6-3825-11ee-a72c-e78d34d303cc 192.0.2.100 068f09e6-3825-11ee-a72c-e78d34d303cc SF::System::
Privileged::RebootSystem
root     61097 61074  0 12:56 ?        00:00:00          |       \_ /bin/sh /ngfw/usr/local/sf/bin/reboot.sh
root     61670 61097  0 12:56 ?        00:00:00          |           \_ /bin/sh /sbin/shutdown -r now
root     61671 61670  0 12:56 ?        00:00:00          |               \_ /bin/sh /sbin/exec_fxos_log_shutdown.sh
root     61676 61671  0 12:56 ?        00:00:00          |                   \_ /usr/bin/timeout 15 /sbin/fxos_log_shutdown
root     61677 61676  0 12:56 ?        00:00:00          |                       \_ /bin/sh /sbin/fxos_log_shutdown
root     61685 61677  0 12:56 ?        00:00:00          |                           \_ /bin/ps -ef –forest

> show managers
Type                      : Manager
Host                      : 192.0.2.100
Display name              : 192.0.2.100
Version                   : 7.6.1 (Build 291)
Identifier                : 068f09e6-3825-11ee-a72c-e78d34d303cc
Registration              : Completed
Management type           : Configuration and analytics
Example 2: Reboot due to software upgrade:
root      2432     1  0 03:59 ?        00:00:00 /bin/bash /isan/bin/kp_reboot.sh Reboot requested for Software Upgrade
root      2694  2432  0 03:59 ?        00:00:00  \_ /bin/sh /isan/bin/sam_reboot.sh Reboot requested for Software Upgrade
root      3774  2694  0 04:00 ?        00:00:00      \_ /usr/bin/sudo /sbin/shutdown -r now Reboot requested for Software Upgrade
root      3777  3774  0 04:00 ?        00:00:00          \_ /bin/sh /sbin/shutdown -r now Reboot requested for Software Upgrade
root      3778  3777  0 04:00 ?        00:00:00              \_ /bin/sh /sbin/exec_fxos_log_shutdown.sh
root      3783  3778  0 04:00 ?        00:00:00                  \_ /usr/bin/timeout 15 /sbin/fxos_log_shutdown
root      3784  3783  0 04:00 ?        00:00:00                      \_ /bin/sh /sbin/fxos_log_shutdown
root      3790  3784  0 04:00 ?        00:00:00                          \_ /bin/ps -ef –forest
Example 3: A reboot was requested by the admin user by running the CLISH reboot command:
root     22189     1  0 Jul23 ?        00:00:01 sshd: /usr/sbin/sshd [listener] 0 of 10-100 startups
root     20963 22189  0 06:55 ?        00:00:00  \_ sshd: admin [priv]
admin    20970 20963  0 06:55 ?        00:00:00  |   \_ sshd: admin@pts/0
admin    20975 20970  0 06:55 pts/0    00:00:00  |       \_ /isan/bin/ucssh --ucs-mgmt -p admin -c connect ftd -z /home/admin
admin    21077 20975  0 06:55 pts/0    00:00:00  |           \_ /ngfw/usr/bin/clish
admin    36022 21077  0 07:23 pts/0    00:00:00  |               \_ /ngfw/usr/bin/clish
admin    36023 21077  0 07:23 pts/0    00:00:00  |               \_ /bin/sh /tmp/klish.fifo.21077.1Hwyq1
admin    36024 36023  8 07:23 pts/0    00:00:01  |                   \_ /usr/bin/perl /usr/local/sf/bin/sfcli.pl reboot system
root     36083 36024  0 07:23 pts/0    00:00:00  |                       \_ /usr/bin/sudo /ngfw/usr/local/sf/bin/reboot.sh
root     36088 36083  0 07:23 pts/0    00:00:00  |                           \_ /bin/sh /usr/local/sf/bin/reboot.sh
root     36433 36088  0 07:23 pts/0    00:00:00  |                               \_ /bin/sh /sbin/shutdown -r now
root     36434 36433  0 07:23 pts/0    00:00:00  |                                   \_ /bin/sh /sbin/exec_fxos_log_shutdown.sh
root     36439 36434  0 07:23 pts/0    00:00:00  |                                       \_ /usr/bin/timeout 15 /sbin/fxos_log_shutdown
root     36440 36439  0 07:23 pts/0    00:00:00  |                                           \_ /bin/sh /sbin/fxos_log_shutdown
root     36448 36440  0 07:23 pts/0    00:00:00  |                                               \_ /bin/ps -ef --forest
Example 4: A shutdown was triggered by clicking the power button. PBTN represents a physical power button press. Pressing the power button on a machine triggers this event. The script uses this event to initiate a shutdown process, typically because a user intends to turn off the firewall safely:
root      1310     1  0 00:14 ?        00:00:00 /usr/sbin/acpid -c /etc/acpi/events
root     50700  1310  0 00:32 ?        00:00:00  \_ /bin/sh /etc/acpi/acpi_handler.sh button/power PBTN 00000080 00000000
root     50701 50700  0 00:32 ?        00:00:00      \_ /bin/sh /sbin/shutdown -h now
root     50702 50701  0 00:32 ?        00:00:00          \_ /bin/sh /sbin/exec_fxos_log_shutdown.sh
root     50707 50702  0 00:32 ?        00:00:00              \_ /usr/bin/timeout 15 /sbin/fxos_log_shutdown
root     50708 50707  0 00:32 ?        00:00:00                  \_ /bin/sh /sbin/fxos_log_shutdown
root     50715 50708  0 00:32 ?        00:00:00                      \_ /bin/ps -ef –forest
Example 5: A reboot was requested by the internal npu_accel_mgr process:
root     12649  5280  0 13:59 ?        00:01:06  \_ npu_accel_mgr
root     19030 12649  0 18:22 ?        00:00:00  |   \_ /bin/sh /sbin/shutdown -r now
root     19031 19030  0 18:22 ?        00:00:00  |       \_ /bin/sh /sbin/exec_fxos_log_shutdown.sh
root     19036 19031  0 18:22 ?        00:00:00  |           \_ /usr/bin/ timeout 15 /sbin/fxos_log_shutdown
root     19037 19036  0 18:22 ?        00:00:00  |               \_ /bin/sh /sbin/fxos_log_shutdown
root     19043 19037  0 18:22 ?        00:00:00  |                   \_ /bin/ps -ef –forest
Example 6: A shutdown was requested by the internal poshd process:
root       643     1  0 13:00 ?        00:00:00 /usr/bin/poshd
root     13207   643  0 13:43 ?        00:00:00  \_ /bin/sh /sbin/shutdown -h -P now
root     13208 13207  0 13:43 ?        00:00:00      \_ /bin/sh /sbin/exec_fxos_log_shutdown.sh
root     13213 13208  0 13:43 ?        00:00:00          \_ /usr/bin/timeout 15 /sbin/fxos_log_shutdown
root     13214 13213  0 13:43 ?        00:00:00              \_ /bin/sh /sbin/fxos_log_shutdown
root     13221 13214  0 13:43 ?        00:00:00                  \_ /bin/ps -ef –forest
poshd is responsible for the graceful shutdown of the device in case of a power issue (either through power button or an external power factor).
Example 7: A reboot was triggered by the state changes of the firewall engine Lina, such as:
- By running the reload command in the ASA CLI or the FTD diagnostic CLI
- The Lina engine traceback (except the versions with the “Data plane quick reload” feature introduced in ASA 9.20(x) and FTD 7.4.1.)
- Incomplete/partial synchronization from active to standby unit
root     56833 56198  0 00:48 ?        00:00:00  |   \_ /ngfw/usr/local/sf/bin/consoled /ngfw/var/run/lina.pid -coredump_filter=0x67 /ngfw/usr/local/asa/bin/lina_monitor -l
root     57003 56833  0 00:48 ?        00:00:00  |       \_ /bin/sh /sbin/shutdown -r now
root     59448 57003  0 00:48 ?        00:00:00  |           \_ /bin/sh /sbin/exec_fxos_log_shutdown.sh
root     59453 59448  0 00:48 ?        00:00:00  |               \_ /usr/bin/timeout 15 /sbin/fxos_log_shutdown
root     59454 59453  0 00:48 ?        00:00:00  |                   \_ /bin/sh /sbin/fxos_log_shutdown
root     59461 59454  0 00:48 ?        00:00:00  |                       \_ /bin/ps -ef –forest
Analyze Chassis Reset Reasons
This section covers the analysis of the chassis reset reasons. On Firepower 4100/9300 chassis, the reset reason is accessible only in:
- FXOS CLI:
# connect fxos
(fxos)# show system reset-reason
- In the output of the show system reset-reason command in chassis troubleshoot files *_BC1_all/FPRM_A_TechSupport/sw_techsupportinfo, where * is the part of the troubleshoot file name, for example, 20250311123356_ FW_BC1_all
On Firepower 1000, 2100, Secure Firewall 1200, 3100, 4200, the reset reason is accessible only in:
- FTD native mode (not multi-instance) CLISH in expert mode: opt/cisco/platform/logs/portmgr.out.
- FTD native mode troubleshoot file: dir-archives/opt-cisco-platform-logs/portmgr.out.
- chassis troubleshoot file on Firepower 1000, 2100 and Secure Firewall 1200, 3100, 4200: /opt/cisco/platform/logs/portmgr.out.
Refer to the Troubleshoot Firepower File Generation Procedures on how to generate the FTD, chassis, and security module files.
To find the reset reason for hardware platforms other than Firepower 4100/9300, walkthrough these steps:
- In /opt/cisco/platform/logs/portmgr.out, check for lines such as, Last reset cause that match the reboot/shutdown timestamp. Ensure you check all portmgr.out files including portmgr.out.1, portmgr.out.2, and so on.
- Refer to this table for the explanation of common reset reasons:
| Reset Reason |
Explanation |
| PowerOn |
The last reset was caused by a power-on event, (AC power cycle). |
| LocalSoft |
The last reset was caused by a local software reset (software reset to CPU). |
| FanFail |
Fan-tray absence or fan failure detection causes the system to power cycle. |
| RP-Reset |
This bit indicates a power cycle was requested by the software. |
| BootRomUpgrade |
The last reset was caused by an image upgrade flash reset. |
| BootRomUpgradeFail |
Upgrade process failed. |
| Watchdog/PCH |
The last reset was caused by a watchdog timer timeout in the FPGA. |
| Manual |
The last reset was caused by a manual push-button reset. |
| SwitchOff |
The last reset was caused by a manual power switch toggle-off. |
| Unrecoverable Error |
Caused by CPU catastrophic error signal. |
| ResetRequest |
The last reset was caused by the CPU asserting the reset signal. This can also be caused by a kernel panic. This reason is also shown when an FTD reboot is manually triggered from the CLISH, Lina, or FMC. |
| PowerCycleRequest |
The last reset/power cycle was caused by the CPU asserting any sleep signals. |
To find the reset reason for Firepower 4100/9300, walkthrough these steps:
- On FXOS CLI, run the show system reset-reason command in the FXOS command shell.
FPR4115-2 # connect fxos
…
FPR4115-2(fxos)# show system reset-reason
----- reset reason for Supervisor-module 1 (from Supervisor in slot 1) ---
1) At 612806449 usecs after Tue Jul 22 23:50:33 2025
    Reason: Reset Requested by CLI command reload
    Service:
    Version: 5.0(3)N2(4.141)

2) No time
    Reason: Unknown
    Service:
    Version: 5.0(3)N2(4.141)

3) No time
    Reason: Unknown
    Service:
    Version: 5.0(3)N2(4.141)

4) At 723697 usecs after Thu Oct  3 17:56:08 2024
    Reason: Reset Requested by CLI command reload
    Service:
    Version: 5.0(3)N2(4.120)
The output of this command is also available in the chassis troubleshoot file *_BC1_all/FPRM_A_TechSupport/sw_techsupportinfo, where * is part of the troubleshoot file name. For example, 20250311123356_ FW_BC1_all
# pwd
20250521112103_FPR9300_BC1_all/FPRM_A_TechSupport
# less sam_techsupportinfo
Most common reasons:
| Reset requested by CLI command reload. |
| The last reset was caused by watchdog timeout. |
| Reset requested due to fatal system error. |
| Reset requested due to fatal module error. |
| Power down due to a temperature sensor policy trigger. |
| Reset due to bad voltage. |
| Reset requested due to fatal system error. |
| Reset caused by multiple non-correctable ASIC memory errors. |
| Reset due to kernel panic. |
| Reset triggered due to HA policy of switchover. |
| Kernel reboot request. |
| Reset because of an unknown reason. |
2. The Unknown reason with no time at Step 1 usually indicates abrupt power loss or power supply unit (PSU) issues. The recommendation is to check incidents for external power loss or power distribution (PDU) problems.
3. Additionally, run the output of the show logging onboard internal reset-reason | no-more command. The output of this command is also available in the chassis troubleshoot file *_BC1_all/FPRM_A_TechSupport/sw_kernel_trace_log, where * is the part of the troubleshoot file name. For example, 20250311123356_ FW_BC1_all:
FPR4115-2 # connect fxos
…
KSEC-FPR4115-2(fxos)# show logging onboard internal reset-reason | no-more
----------------------------
OBFL Data for
    Module:  1
----------------------------
Reset Reason for this card:
        Image Version : 5.0(3)N2(4.141)
        Reset Reason (SW): Unknown (0) at time Fri Jul  4 23:57:21 2025
          Service (Additional Info):
        Reset Reason (HW): FPGA  reset code: 0x0001
          FPGA Power-ON Reset at time Fri Jul  4 23:57:21 2025
Analyze Hardware Errors or Exceptions
This section covers the analysis of files that contain hardware errors or exceptions.
Firepower 1000, 2100, Secure Firewall 1200, 3100, 4200, Firepower 4100/9300 Security Modules
The relevant files are:
- /opt/cisco/platform/logs/mce.log (Machine Check Exception logs)
- /ngfw/var/log/dmesg.log (FTD only)
- /opt/cisco/config/var/logs/dmesg.log
- /opt/cisco/platform/logs/messages
These files can contain hardware errors or exceptions logs for:
- Firepower 1000, 2100 and Secure Firewall 1200, 3100, 4200 chassis
- Firepower 4100 and 9300 security modules (not the chassis)
The files are only accessible in:
- FTD native mode (not multi-instance) CLISH in expert mode:
- /opt/cisco/platform/logs/mce.log
- /ngfw/var/log/dmesg.log (FTD only)
- /opt/cisco/config/var/logs/dmesg.log
- /opt/cisco/platform/logs/messages
- FTD native mode troubleshoot file:
- dir-archives/var-common-platform_ts/opt/cisco/platform/logs/mce.log
- dir-archives/var-common-platform_ts/opt/cisco/platform/logs/messages
- dir-archives/var-common-platform_ts/opt/cisco/config/var/logs/dmesg.log
- dir-archives/var-log/dmesg.log
- Chassis troubleshoot file on Firepower 1000, 2100 and Secure Firewall 1200, 3100, 4200:
- /opt/cisco/platform/logs/mce.log
- /opt/cisco/config/var/logs/dmesg.log
- /opt/cisco/platform/logs/messages
- Security module show-tech file on Firepower 4100/9300:
- /opt/cisco/platform/logs/mce.log
- /opt/cisco/config/var/logs/dmesg.log
- /opt/cisco/platform/logs/messages
Examples of hardware-related errors:
opt/cisco/config/var/logs/ $ less dmesg.log
[Sun Apr 27 05:17:10 2025] mce: [Hardware Error]: Machine check events logged
[Sun Apr 27 05:17:10 2025] mce: [Hardware Error]: Machine check events logged

/opt/cisco/platform/logs $ less messages
Jul  9 17:39:38 fw2 kernel: [  628.949572] [Hardware Error]: Corrected error, no action required.
Jul  9 17:39:38 fw2 kernel: [  629.023798] [Hardware Error]: CPU:2 (19:1:1) MC18_STATUS[Over|CE|MiscV|AddrV|-|-|SyndV|CECC|-|-|-]: 0xdc2040000000011b
Jul  9 17:39:38 fw2 kernel: [  629.152245] [Hardware Error]: Error Addr: 0x0000000068d06d40
Jul  9 17:39:38 fw2 kernel: [  629.152248] [Hardware Error]: PPIN: 0x02b0bc114ba60075
Jul  9 17:39:38 fw2 kernel: [  629.281830] [Hardware Error]: IPID: 0x0000009600550f00, Syndrome: 0x000400040a801200
Jul  9 17:39:38 fw2 kernel: [  629.374797] [Hardware Error]: Unified Memory Controller Ext. Error Code: 0, DRAM ECC error.
Jul  9 17:39:38 fw2 kernel: [  629.475078] [Hardware Error]: cache level: L3/GEN, tx: GEN, mem-tx: RD
Jul  9 17:44:40 fw2 kernel: [  930.967028] [Hardware Error]: Corrected error, no action required.
Jul  9 17:44:40 fw2 kernel: [  931.041247] [Hardware Error]: CPU:2 (19:1:1) MC18_STATUS[Over|CE|MiscV|AddrV|-|-|SyndV|CECC|-|-|-]: 0xdc2040000000011b
Jul  9 17:44:40 fw2 kernel: [  931.169689] [Hardware Error]: Error Addr: 0x000000007191d0c0
Jul  9 17:44:40 fw2 kernel: [  931.237616] [Hardware Error]: PPIN: 0x02b0bc114ba60075
Jul  9 17:44:40 fw2 kernel: [  931.299275] [Hardware Error]: IPID: 0x0000009600550f00, Syndrome: 0x000040000a801100


/opt/cisco/platform/logs $ less mce.log
Hardware event. This is not a software error.
MCE 0
CPU 0 BANK 7 TSC 7b29f624ae62e
MISC 140129286 ADDR 3402b9a00
TIME 1745747035 Sun Apr 27 09:43:55 2025
MCG status:
MCi status:
Corrected error
MCi_MISC register valid
MCi_ADDR register valid
MCA: MEMORY CONTROLLER RD_CHANNEL0_ERR
Transaction: Memory read error
STATUS 8c00004000010090 MCGSTATUS 0
MCGCAP 1000c16 APICID 0 SOCKETID 0
PPIN afeebaf20487b95
MICROCODE 700000d
CPUID Vendor Intel Family 6 Model 86 Step 3
mcelog: failed to prefill DIMM database from DMI data
Catastrophic Errors (CATERR) on Firepower 4100/9300 Security Modules
A CATERR is an exception asserted by the processor. A CATERR can indicate a CPU crash or low-level problems that render the blade inaccessible. The chassis supervisor reboots the security module that experienced CATERR. The CATERR logs are located inside the Firepower 4100/9300 troubleshoot file in CIMC<X>_TechSupport/obfl/ and CIMC<X>_TechSupport/var/log/sel, where <X> stands for module number.
An example from a sample chassis troubleshoot file *_BC1_all/CIMC<X>_TechSupport.tar.gz/CIMC<X>_TechSupport.tar/obfl/obfl-log,where * is the part of the troubleshoot file name. For example, 20250311123356_ FW_BC1_all and <X > is the security module ID:
2022 Mar 25 22:33:13 CET:4.1(30b):selparser:1950: selparser.c:727: # BF 06 00 00 01 02 00 00 19 35 3E 62 20 00 04 07 81 00 00 00 04 01 FF FF # 6bf | 03/25/2022 22:33:13 CET | CIMC | Processor CATERR_N #0x81 | Predictive Failure asserted | Asserted
The current Data Management Engine (DME) logs in *_BC1_all/FPRM_A_TechSupport.tar.gz\FPRM_A_TechSupport.tar\var\sysmgr\sam_logs\svc_sam_dme.log* or the logs before reboot in *_BC1_all/FPRM_A_TechSupport.tar.gz/FPRM_A_TechSupport.tar/opt/sam_logs.tgz/sam_logs.tar/sam_logs/svc_sam_dme.log* contains the lines with power cycle blade X due to CATERR, where X is the blade ID.
In the case of CATERR, a crash dump can be generated. The crash dump is in *_BC1_all/CIMC<X>_TechSupport.tar.gz/CIMC<X>_TechSupport.tar/techsupport_pidxxxx/nv/etc/log/eng-repo/caterrlog.first.
Example content:
CRASH DUMP START TIME = Mon Dec 19 00:42:40 2022
               SERVER: presidio
               GetCpuID: CPUID = 0x00050654
               PresidioCatErrHandler: CPU TYPE : Skylake
               handleCaterr_Purley: ---
               PECI BUS : LOCKED
               CPU Socket 1 : Populated
               CPU Socket 2 : Populated
               Stage1Dump: ---
               MC0: IFU - Instruction Fetch Unit and Instruction Cache
               CPU1 (0x30): ThreadID 0 : IA32_MC0_CTL (0x400) : 0x0000000000000fff
               CPU1 (0x30): ThreadID 0 : IA32_MC0_STATUS (0x401) : 0x0000000000000000
               CPU1 (0x30): ThreadID 0 : IA32_MC0_ADDR (0x402) : 0x0000000000000000
Analyze Other Platform log Files
This section covers the analysis of files that contain platform logs. Depending on the hardware, some of these files can contain logs related to a reboot triggered by specific components.
Firepower 1000, 2100, Secure Firewall 1200, 3100, 4200, Firepower 4100/9300 Security Modules
The files contain chassis logs for:
- Firepower 1000, 2100 and Secure Firewall 1200, 3100, 4200 chassis
- Firepower 4100 and 9300 security modules (not the chassis)
The files are only accessible in:
- FTD native mode (not multi-instance) CLISH in expert mode in /opt/cisco/platform/logs/
- FTD native mode troubleshoot file dir-archives/var-common-platform_ts/opt/cisco/platform/logs/
- Chassis troubleshoot file on Firepower 1000, 2100 and Secure Firewall 1200, 3100, 4200 in /opt/cisco/platform/logs/
- Security module show-tech file on Firepower 4100/9300 in /opt/cisco/platform/logs/
To find potential logs related to a reboot, search for lines that contain keywords such as reboot, restart, power, shut, reload.

Note: This is a best effort approach as the result of the search can return a large number of matching lines (the user must analyze the matching lines.)
Example 1:
admin@firewall:/opt/cisco/platform/logs$ grep -Ei "power|reboot|reload|restart|shut" *
...
npu_accel_fatal_err_stats.log:nic_top_inb_q_restart_drop_cnt = 0
npu_accel_fatal_err_stats.log:nic_top_norm_q_restart_drop_cnt = 0
npu_accel_fatal_err_stats.log:nic_top_inb_q_restart_drop_cnt = 0
npu_accel_mgr.log:2025 Oct 03 14:29:16 NPU ACCEL MGR: FATAL - NPU Accelerator FAILED - REBOOTING the device !!
npu_accel_mgr.log:2025 Oct 09 18:13:09 NPU ACCEL MGR: FATAL - NPU Accelerator FAILED - REBOOTING the device !!
npu_accel_mgr.log:2025 Oct 17 17:11:23 NPU ACCEL MGR: FATAL - NPU Accelerator FAILED - REBOOTING the device !!
npu_accel_mgr.log:2025 Oct 17 17:31:55 NPU ACCEL MGR: FATAL - NPU Accelerator FAILED - REBOOTING the device !!
npu_accel_mgr.log:2025 Oct 17 19:29:29 NPU ACCEL MGR: FATAL - NPU Accelerator FAILED - REBOOTING the device !!
ntp.log:27 Sep 02:21:16 ntpd[1580]: 0.0.0.0 c016 06 restart
ntp.log:27 Sep 02:23:27 ntpd[10193]: 0.0.0.0 c016 06 restart
...
In this case, the reboot was triggered due to the failure of the Network Processing Unit (NPU) Accelerator of the Secure Firewall 4200.
Analyze SEL/OBFL Files
This section covers the analysis of files with the security event logs (SEL), and the onboard failure logs (OBFL) on the Firepower 4100/9300 security modules. These files contain module hardware events and power status changes and are located inside the Firepower 4100/9300 troubleshoot file, in CIMC<X>_TechSupport/obfl/ and CIMC<X>_TechSupport/var/log/sel, where <X> stands for module number. Look for lines with case-insensitive stop, shutdown, power off, reset, critical.
Example 1:
2023 Sep 21 13:53:13:4.1(30b):cipmi:1088: [[xxxCVxxx]]:oem_command.c:457:IPMI Request Message --> Chan:15, Netfn:0x04, Cmd:0x02, Data: 0x41 0x03 0x20 0x46 0x6f 0xa1 0x61 0x74, CC:0x00
2023 Sep 21 13:53:13:4.1(30b):selparser:1203: [[xxxCVxxx]]:selparser.c:727: # A9 04 00 00 01 02 00 00 49 DA 0B 65 41 F0 04 20 46 00 00 00 6F A1 61 74 # 4a9 | 09/21/2023 13:53:13 AWST | System Mgmt Software | OS stop/shutdown #0x46 | Run-time critical stop |  | Asserted
2023 Sep 21 13:53:14:4.1(30b):cipmi:1088: peci.c:278:Error: Failed to read local PCI config after 3 retries! Completion Code error [PECI Dev=0x30,Resp=0x00,CC=0x80] Request Details: [pci_bus=0x02,pci_dev=0x0a,pci_fxn=0x03,pci_reg=0x104,length=0x04]
2023 Sep 21 13:53:15:4.1(30b):kernel:-:<5>[platform_reset_cb_handler]:75:Platform Reset ISR -> ResetState: 1
2023 Sep 21 13:53:15:4.1(30b):cipmi:1088: ocmds_intel_me.c:251:Intel ME Operating State:[M0 without UMA](5)
2023 Sep 21 13:53:15:4.1(30b):cipmi:1088: ocmds_intel_me.c:261:Intel ME is initializing.
Example 2: OS level shutdown:
2025 Jul 30 23:31:02 UTC:4.1(30b):cipmi:1052: [[xxxCVxxx]]:oem_command.c:457:IPMI Request Message --> Chan:15, Netfn:0x04, Cmd:0x02, Data: 0x41 0x03 0x20 0x46 0x6f 0xa1 0x61 0x74, CC:0x00
2025 Jul 30 23:31:02 UTC:4.1(30b):selparser:1169: [[xxxCVxxx]]:selparser.c:727: # 48 03 00 00 01 02 00 00 36 AB 8A 68 41 F0 04 20 46 00 00 00 6F A1 61 74 # 348 | 07/30/2025 23:31:02 UTC | System Mgmt Software | OS stop/shutdown #0x46 | Run-time critical stop |  | Asserted
2025 Jul 30 23:31:04 UTC:4.1(30b):kernel:-:<5>[platform_reset_cb_handler]:75:Platform Reset ISR -> ResetState: 1
2025 Jul 30 23:31:05 UTC:4.1(30b):kernel:-:<4>[peci_ioctl]:293:non-responsive controller, resetting peci.  process = qpi_logger.
2025 Jul 30 23:31:05 UTC:4.1(30b):cipmi:1052: ocmds_intel_me.c:251:Intel ME Operating State:[M0 without UMA](5)
2025 Jul 30 23:31:05 UTC:4.1(30b):cipmi:1052: ocmds_intel_me.c:261:Intel ME is initializing.
2025 Jul 30 23:31:05 UTC:4.1(30b):information_logger:589: uptime.c:1219:Host Transition Ocurred. Event Count: 146. New state is "Power Off".
Example 3: The Baseboard Management Controller reset due to watchdog:
2025 Jun 14 07:44:50 CDT:4.1(30b):kernel:-:<3>[watchdog_init]:487:BMC Watchdog resetted BMC.
2025 Jun 14 07:44:50 CDT:4.1(30b):kernel:-:<3>[watchdog_init]:489:BMC Watchdog System Bus Debug Status Registers: 0x0 and0x0
2025 Jun 14 07:44:50 CDT:4.1(30b):kernel:-:<3>[watchdog_init]:523:BMC Watchdog resetted BMC due to OOM.
Analyze ASA/FTD Console Logs
This section covers the analysis of the ASAConsole.log files that contain logs from the Lina engine and can be checked for signs of software traceback or reboots. The file contains shutdown or reboot logs for ASA/FTD running on virtual platforms, Firepower 1000, 2100, and Secure Firewall 1200, 3100, 4200, and Firepower 4100 and 9300 security modules (not the chassis).
The file is only accessible in:
- FTD CLISH in expert mode: /ngfw/var/log/ASAConsole.log
- FTD troubleshoot file: dir-archives/opt-cisco-platform-logs/ASAConsole.log.
- Security module troubleshoot file on Firepower 4100/9300: /opt/platform/logs/ASAConsole.log
- Firepower 1000, 2100 and Secure Firewall 1200, 3100, 4200 chassis show tech file: /opt/platform/logs/ASAConsole.log
Symptoms of traceback and core file generation:
root@KSEC-CSF1210-6:/ngfw/var/log# less ASAconsole.log
2025-08-09 01:06:11 /bin/grep: (standard input): Resource temporarily unavailable
2025-08-09 01:06:11 /bin/grep: (standard input): Resource temporarily unavailable
2025-08-09 01:06:11 /bin/grep: (standard input): Resource temporarily unavailable
2025-08-09 01:06:35 !! !! First Crash in tid: 14834 signo: 11
2025-08-09 01:06:35
2025-08-09 01:06:35 Writing live core file to flash. Please do not reload.
2025-08-09 01:06:35
2025-08-09 01:06:35 Coredump starting....
2025-08-09 01:06:35 Corehelper: /opt/cisco/csp/cores/core.lina.11.14550.1754701595
2025-08-09 01:06:35 Waiting for Corehelper to finish....
2025-08-09 01:06:35 Livecore: generating coredump of 14550
2025-08-09 01:06:35 [New LWP 14795]
2025-08-09 01:06:35 [New LWP 14796]
2025-08-09 01:06:35 [New LWP 14834]
2025-08-09 01:06:35 [New LWP 14835]
2025-08-09 01:06:35 [New LWP 14836]
2025-08-09 01:06:35 [New LWP 14869]
2025-08-09 01:06:35 [New LWP 14934]
2025-08-09 01:06:35 [New LWP 14939]
2025-08-09 01:06:35 [New LWP 14940]
2025-08-09 01:06:35 [New LWP 14941]
2025-08-09 01:06:35 [New LWP 14942]
2025-08-09 01:06:35 [New LWP 14943]
2025-08-09 01:06:35 [New LWP 14945]
2025-08-09 01:06:35 [New LWP 14947]
2025-08-09 01:06:35 [New LWP 14948]
Symptoms of a Lina engine boot (notice the gap in the log timestamps):
root@KSEC-CSF1210-6:/ngfw/var/log# less ASAconsole.log
2024-11-13 22:43:09 INFO: SW-DRBG health test passed.
2024-11-13 22:43:09 M_MMAP_THRESHOLD 65536, M_MMAP_MAX 82155
2024-11-13 22:43:10 /bin/grep: (standard input): Resource temporarily unavailable
2024-11-13 22:43:10 /bin/grep: (standard input): Resource temporarily unavailable
2024-11-13 22:43:10 /bin/grep: (standard input): Resource temporarily unavailable
2024-11-13 22:43:10 /bin/grep: (standard input): Resource temporarily unavailable
2024-11-13 22:43:10 User enable_1 logged in to firepower
2024-11-13 22:43:10 Logins over the last 1 days: 1.
2024-11-13 22:43:10 Failed logins since the last login: 0.
2024-11-13 22:43:10 Type help or '?' for a list of available commands.
2024-11-13 22:43:10 ^Mfirepower>
2025-04-04 09:11:46 System Cores 8 Nodes 1 Max Cores 24
2025-04-04 09:11:46 Number of Cores 3
2025-04-04 09:11:46 IO Memory Nodes: 1
2025-04-04 09:11:46 IO Memory Per Node: 1073741824 bytes num_pages = 262144 page_size = 4096
2025-04-04 09:11:46
2025-04-04 09:11:46 Global Reserve Memory Per Node: 2147483648 bytes Nodes=1
2025-04-04 09:11:46
2025-04-04 09:11:46 LCMB: got DMA 1073741824 bytes on numa-id=0, phys=0x00000001c0000000, virt=0x0000400040000000
2025-04-04 09:11:46 LCMB: HEAP-CACHE POOL got 2147483648 bytes on numa-id=0, virt=0x0000400080000000
2025-04-04 09:11:46
2025-04-04 09:11:46 total_reserved_mem = 1073741824
2025-04-04 09:11:46
2025-04-04 09:11:46 total_heapcache_mem = 2147483648
2025-04-04 09:11:46 total mem 5384115842 system 16318316544 kernel 21847377 image 85732792
2025-04-04 09:11:46 new 5384115842 old 1159474616 reserve 3221225472 priv new 2184737747 priv old 0
2025-04-04 09:11:46 Processor memory:   5384115842
2025-04-04 09:11:46 POST started...
2025-04-04 09:11:46 POST finished, result is 0 (hint: 1 means it failed)
2025-04-04 09:11:46
2025-04-04 09:11:46 Cisco Adaptive Security Appliance Software Version 9.22(1)1
Analyze Power Voltage and Power Supply Issues
Proceed with this section if as part of the Analyze chassis reset reasons section reset reasons like these are found:
- PowerOn
- PowerCycleRequest
- Reset due to bad voltage
- Unknown reason:
No time
    Reason: Unknown
    Service:
    Version:
These reasons can indicate potential problems with one or more of these:
- Shortages in power supply
- Issues with the power supply units (PSU)
- Issues with the power cables
- Issues with the power distribution units (PDU) in the rack
- Issues with the power supply
Proceed with these steps:
- To narrow down the problem scope, answer these questions:
- Was the power loss a one-time issue or recurring?
- Does the firewall have redundant PSUs?
- Are the PSUs connected to different power sources and/or PDUs?
- Are there any other devices connected to the same power source and/or PSU?
- Did other devices connected to the same power source and/or PSU also experience power loss?
- If based on the questions from the first step, only the firewall is affected, then ensure that:
- The power cables are tightly connected to the power source and the chassis.
- Power cables are not damaged and try to replace the power cables to exclude potential issues with the cables.
- If the chassis continues to reboot unexpectedly, collect the output of these commands in FXOS a few times:
scope chassis 1
show psu detail expand
scope psu 1
show stats history psu-stats detail expand
show stats psu-stats detail expand
exit
scope psu 2
show stats history psu-stats detail expand
show stats psu-stats detail expand
- Collect the chassis troubleshoot file.
References
- Verify Firepower Software Versions
- Verify Firepower, Instance, Availability, Scalability Configuration
- Collect Data for Root Cause Analysis of Software Traceback/Crash in Secure Firewall
- Troubleshoot Firepower File Generation Procedures
Revision History
| Revision | Publish Date | Comments |
|---|---|---|
6.0 |
07-Jul-2026
|
Updated spelling, spacing, grammar, adding lines to separate sections and make it legible, updated alt text, and fixed CCW alerts. |
5.0 |
25-Nov-2025
|
Removed an internal box again. |
4.0 |
25-Nov-2025
|
Removed an internal box. |
3.0 |
12-Nov-2025
|
Added additional steps for troubleshooting unexpected reboot. |
2.0 |
24-May-2024
|
Updated introduction section to meet Cisco style guide length requirements. Unbolded unncessary words. |
1.0 |
31-Jan-2022
|
Initial Release |
 Feedback
Contact Cisco
- Open a Support Case

- (Requires a Cisco Service Contract)