Troubleshoot IPsec Anti-Replay Check Failures
Available Languages
Contents
Introduction
This document describes an issue related to Internet Protocol Security (IPsec) anti-replay check failures and provides possible solutions.
Background Information
An Overview of Replay Attacks
A replay attack is a form of network attack in which valid data transmission is maliciously or fraudulently recorded and later repeated. It is an attempt to subvert security by someone who records legitimate communications and repeats them in order to impersonate a valid user and disrupt or cause a negative impact on legitimate connections.
IPsec Replay Check Protection
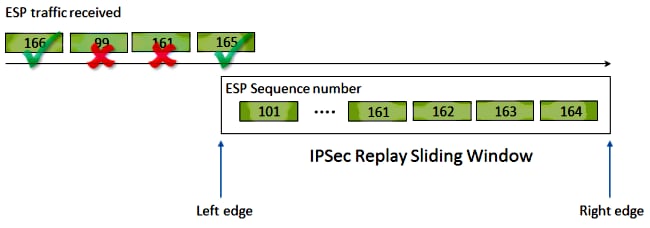
A sequence number that monotonically increases is assigned to each encrypted packet by IPsec to provide anti-replay protection against an attacker. The receiving IPsec endpoint keeps track of which packets it has already processed when it uses these numbers and a sliding window of acceptable sequence numbers. The default anti-replay window size in the Cisco IOS® implementation is 64 packets, as shown in this image:
When an IPsec tunnel endpoint has anti-replay protection enabled, the incoming IPsec traffic is processed as follows:
- If the sequence number falls within the window and has not previously been received, the packet has its integrity checked. If the packet passes the integrity verification check, it is accepted and the router marks that this sequence number has been received. For example, in the preceding diagram a packet with Encapsulating Security Payload (ESP) sequence number of 162 is within the replay window.
- If the sequence number falls within the window, but has been previously received, the packet is dropped. This duplicated packet is discarded and the drop is recorded in the replay drop counter.
- If the sequence number is greater than the highest sequence number in the window, the packet has its integrity checked. If the packet passes the integrity verification check, the sliding window is then moved to the right. For example, if a valid packet with a sequence number of 189 is received, then the new right edge of the window is set to 189, and the left edge is 125 (189 - 64 [window size]).
- If the sequence number is lower than the left edge, the packet is dropped and recorded within the replay counter. This is considered an out-of-order packet.
In the cases where a replay check failure occurs and the packet is dropped, the router generates a syslog message similar to this:
%IPSEC-3-REPLAY_ERROR: IPSec SA receives anti-replay error, DP Handle n, src_addr x.x.x.x, dest_addr y.y.y.y, SPI 0xzzzzzzzz
Problems That Can Cause IPsec Replay Drops
As previously described, the purpose of replay checks is to protect against malicious repetitions of legitimate packets. Some of the common conditions that can result in failed replay check include:
- The error can result from packets that are reordered in the network path between the tunnel endpoints during delivery. This can likely occur if there are multiple network paths between the peers.
- The error can be caused by unequal packet processing paths inside the Cisco IOS. For example, fragmented IPsec packets that require IP reassembly before decryption can be delayed enough, that they fall outside of the replay window by the time they are processed.
- The error can be caused by the Quality of Service (QoS) enabled on the sending IPsec endpoint or within the network path. With the Cisco IOS implementation, IPsec encryption occurs before QoS in the egress direction. Certain QoS features, such as Low Latency Queueing (LLQ), could cause IPsec packet delivery to become out-of-order and dropped by the receiving endpoint due to a replay check failure.
- A network configuration/operational issue can duplicate packets as they transit the network.
- An attacker (man-in-the-middle) could potentially delay, drop, and duplicate the ESP traffic.
Troubleshoot IPsec Replay Drops
The key to troubleshoot IPsec replay drops is to identify which packets are dropped due to replay, and use packet captures to determine if these packets are indeed replayed packets or packets that have arrived on the receiving router outside of the replay window. In order to correctly match the dropped packets to what is captured in the sniffer trace, the first step is to identify the peer and the IPsec flow to which the dropped packets belong and the ESP sequence number of the packet.
Use Cisco IOS XE Datapath Packet Tracing Feature
On router platforms that run Cisco IOS® XE software, information about the peer as well as the IPsec Security Parameter Index (SPI) are printed in the syslog message when a replay drop occurs to help identify the peer and the specific tunnel the dropped packet belong to. However, the ESP sequence number is not printed in this output. The ESP sequence number is used in order to uniquely identify an IPsec packet within a given IPsec flow. Without the sequence number, it becomes difficult to identify exactly which packet gets dropped in a packet capture.
The Cisco IOS® XE datapath packet-trace feature can be used in this situation when the replay drop is observed, with this syslog message:
%IOSXE-3-PLATFORM: F0: cpp_cp: QFP:0.0 Thread:060 TS:00000001132883828011
%IPSEC-3-REPLAY_ERROR: IPSec SA receives anti-replay error, DP Handle 3, src_addr 10.2.0.200, dest_addr 10.1.0.100, SPI 0x4c1d1e90
In order to help identify the ESP sequence number for the packet dropped, complete these steps with the packet tracing feature:
Step 1. Set up the platform conditional debug filter in order to match traffic from the peer device:
debug platform condition ipv4 10.2.0.200/32 ingress
debug platform condition start
Step 2. Enable packet tracing with the copy option in order to copy the packet header information:
debug platform packet-trace packet 64
debug platform packet-trace copy packet input l3 size 100
Step 3. When replay errors are detected, use the packet trace buffer in order to identify the packet dropped due to replay, and the ESP sequence number can be found in the packet copied:
Router#show platform packet-trace summary
Pkt   Input            Output           State  Reason
0     Gi4/0/0          Tu1              CONS   Packet Consumed
1     Gi4/0/0          Tu1              CONS   Packet Consumed
2     Gi4/0/0          Tu1              CONS   Packet Consumed
3     Gi4/0/0          Tu1              CONS   Packet Consumed
4     Gi4/0/0          Tu1              CONS   Packet Consumed
5     Gi4/0/0          Tu1              CONS   Packet Consumed
6     Gi4/0/0          Tu1              DROP   053 (IpsecInput)
7     Gi4/0/0          Tu1              DROP   053 (IpsecInput)
8     Gi4/0/0          Tu1              CONS   Packet Consumed
9     Gi4/0/0          Tu1              CONS   Packet Consumed
10    Gi4/0/0          Tu1              CONS   Packet Consumed
11    Gi4/0/0          Tu1              CONS   Packet Consumed
12    Gi4/0/0          Tu1              CONS   Packet Consumed
13    Gi4/0/0          Tu1              CONS   Packet Consumed
The previous output shows that packet numbers 6 and 7 are dropped, so they can be examined in detail now:
Router#show platform packet-trace packet 6

Packet: 6           CBUG ID: 6
Summary
  Input     : GigabitEthernet4/0/0
  Output    : Tunnel1
  State     : DROP 053 (IpsecInput)
  Timestamp : 3233497953773
Path Trace
  Feature: IPV4
    Source      : 10.2.0.200
    Destination : 10.1.0.100
    Protocol    : 50 (ESP)
  Feature: IPSec
    Action    : DECRYPT
    SA Handle : 3
    SPI       : 0x4c1d1e90
    Peer Addr : 10.2.0.200
    Local Addr: 10.1.0.100
  Feature: IPSec
    Action    : DROP
    Sub-code  : 019 - CD_IN_ANTI_REPLAY_FAIL
Packet Copy In
  45000428 00110000 fc329575 0a0200c8 0a010064 4c1d1e90 00000006 790aa252
  e9951cd9 57024433 d97c7cb8 58e0c869 2101f1ef 148c2a12 f309171d 1b7a4771
  d8868af7 7bae9967 7d880197 46c6a079 d0143e43 c9024c61 0045280a d57b2f5e
  23f06bc3 ab6b6b81 c1b17936 98939509 7aec966e 4dd848d2 60517162 9308ba5d
The ESP sequence number has an offset of 24 bytes from the start of the IP header (or 4 bytes of the IP packet payload data), as emphasized in bold in the previous output. In this particular example, the ESP sequence number for the dropped packet is 0x6.
Collect Packet Captures
In addition to the identification of the packet information for the packet dropped due to replay check failure, a packet capture for the IPsec flow in question needs to be collected concurrently. This helps in the examination of the ESP sequence number pattern within the same IPsec flow to help determine the reason for the replay drop. For details on how to use the Embedded Packet Capture (EPC) on Cisco IOS XE routers, see Embedded Packet Capture for Cisco IOS and Cisco IOS XE Configuration Example.
Use Wireshark Sequence Number Analysis
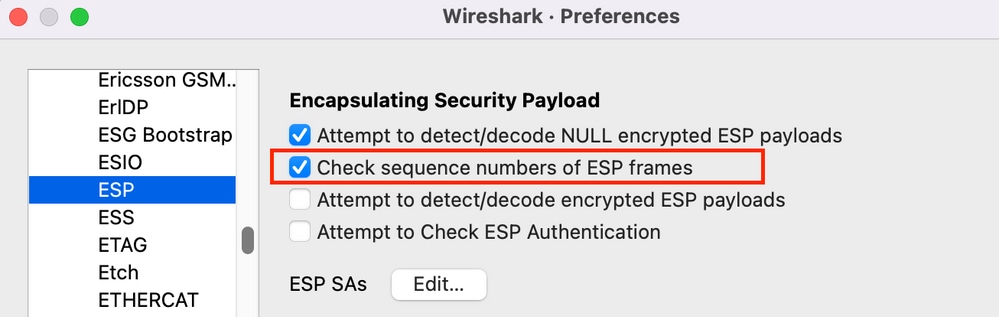
Once the packet capture for the encrypted (ESP) packets on the WAN interface has been collected, Wireshark can be used to perform ESP sequence number analysis for any sequence number anomalies. First, ensure Sequence Number Check is enabled under Preferences > Protocols > ESP as shown in the image:
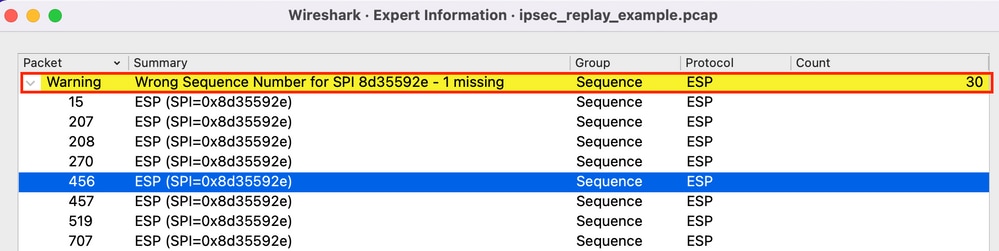
Next, check for any ESP Sequence Number issues under Analyze > Expert information as follows:
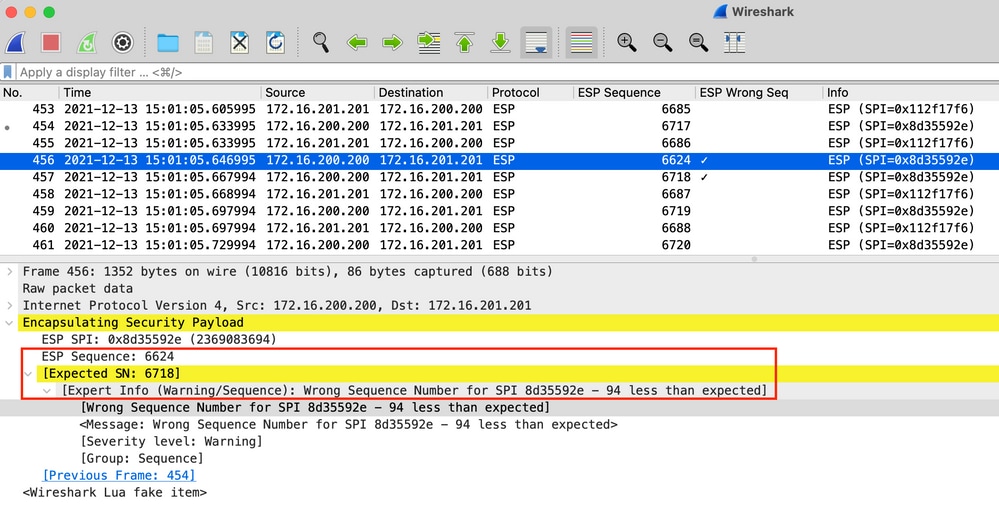
Click any of the packets with the wrong Sequence Number to get additional details as follows:
Solution
After the peer is identified and packet capture is collected for the replay drops, three possible scenarios could explain the replay failures:
- It is a valid packet that has been delayed:
Packet captures help confirm if the packet is actually valid, and if the problem is insignificant (due to network latency or transmission path issues) or requires a more in-depth troubleshoot. For example, the capture shows a packet with a sequence number of X that arrives out of order, and the replay window size is currently set to 64. If a valid packet with sequence number (X + 64) arrives before packet X, the window is shifted to the right and then packet X is dropped due to a replay failure.
In such scenarios, it is possible to increase the size of the replay window or disable the replay check to ensure that such delays are considered acceptable and the legitimate packets are not discarded. By default, the replay window size is fairly small (window size of 64). If you increase the size, it does not greatly increase the risk of an attack. For information on how to configure an IPsec Anti-Replay Window, refer to the How to Configure IPsec Anti-Replay Window: Expanding and Disabling document. - It is due to QoS configuration on the sending endpoint:
If packet reordering after IPsec is caused by QoS configuration on the IPsec sending device, a potential mitigation is to use Multiple Sequence Number Space per IPsec SA available on Cisco IOS XE platforms.
- It is a duplicate packet that was previously received:
If this is the case, then two or more packets with the same ESP sequence number within the same IPsec flow can be observed in the packet capture. In this case, the packet drop is expected as IPsec replay protection works as intended to prevent replay attacks in the network, and the syslog is just informational. If this condition persists, then it must be investigated as a potential security threat.
Additional Information
Troubleshoot Replay Errors on Legacy Routers with Cisco IOS Classic
The IPsec replay drops on the legacy ISR G2 series routers that use the Cisco IOS are different from routers that use the Cisco IOS XE, as shown here:
%CRYPTO-4-PKT_REPLAY_ERR: decrypt: replay check failed connection id=529, sequence number=13
The message output does not provide either the peer IP address or SPI information. In order to troubleshoot on this platform, use the "conn-id" in the error message. Identify the "conn-id" in the error message, and look for it in the show crypto ipsec sa output, since replay is a per-SA check (as opposed to a per-peer). The syslog message also provides the ESP sequence number, which can help uniquely identify the dropped packet in the packet capture.
This is illustrated here:
%CRYPTO-4-PKT_REPLAY_ERR: decrypt: replay check failed connection id=529, sequence number=13

Router#show crypto ipsec sa | in peer|conn id
   current_peer 10.2.0.200 port 500
        conn id: 529, flow_id: SW:529, sibling_flags 80000046, crypto map: Tunnel0-head-0
        conn id: 530, flow_id: SW:530, sibling_flags 80000046, crypto map: Tunnel0-head-0
Router#

Router#show crypto ipsec sa peer 10.2.0.200 detail

   interface: Tunnel0
    Crypto map tag: Tunnel0-head-0, local addr 10.1.0.100

   protected vrf: (none)
   local  ident (addr/mask/prot/port): (0.0.0.0/0.0.0.0/0/0)
   remote ident (addr/mask/prot/port): (0.0.0.0/0.0.0.0/0/0)
   current_peer 10.2.0.200 port 500
     PERMIT, flags={origin_is_acl,}
    #pkts encaps: 27, #pkts encrypt: 27, #pkts digest: 27
    #pkts decaps: 27, #pkts decrypt: 27, #pkts verify: 27
    #pkts compressed: 0, #pkts decompressed: 0
    #pkts not compressed: 0, #pkts compr. failed: 0
    #pkts not decompressed: 0, #pkts decompress failed: 0
    #pkts no sa (send) 0, #pkts invalid sa (rcv) 0
    #pkts encaps failed (send) 0, #pkts decaps failed (rcv) 0
    #pkts invalid prot (recv) 0, #pkts verify failed: 0
    #pkts invalid identity (recv) 0, #pkts invalid len (rcv) 0
    #pkts replay rollover (send): 0, #pkts replay rollover (rcv) 0
    ##pkts replay failed (rcv): 21
    #pkts internal err (send): 0, #pkts internal err (recv) 0

     local crypto endpt.: 10.1.0.100, remote crypto endpt.: 10.2.0.200
     path mtu 2000, ip mtu 2000, ip mtu idb Serial2/0
     current outbound spi: 0x8B087377(2332586871)
     PFS (Y/N): N, DH group: none

     inbound esp sas:
      spi: 0xE7EDE943(3891128643)
        transform: esp-gcm ,
        in use settings ={Tunnel, }
        conn id: 529, flow_id: SW:529, sibling_flags 80000046, crypto map:
        Tunnel0-head-0
        sa timing: remaining key lifetime (k/sec): (4509600/3223)
        IV size: 8 bytes
        replay detection support: Y
        Status: ACTIVE

<SNIP>
As can be seen from this output, the replay drop is from the 10.2.0.200 peer address with an inbound ESP SA SPI of 0xE7EDE943. It can also be noted from the log message itself that the ESP sequence number for the dropped packet is13. The combination of peer address, SPI number, and the ESP sequence number can be used in order to uniquely identify the packet dropped in the packet capture.
Work with Earlier Cisco IOS XE Software
On routers that run the earlier Cisco IOS XE releases, the "REPLAY_ERROR" reported in the syslog cannot print the actual IPsec flow with the peer information where the replayed packet is dropped, as shown here:
%IOSXE-3-PLATFORM: F0: cpp_cp: QFP:00 Thread: 095 TS:00000000240306197890
%IPSEC-3-REPLAY_ERROR: IPSec SA receives anti-replay error, DP Handle 3
In order to identify the correct IPsec peer and flow information, use the Data Plane (DP) Handle printed in the syslog message as the input parameter SA Handle in this command, in order to retrieve the IPsec flow information on the Quantum Flow Processor (QFP):
Router#show platform hardware qfp active feature ipsec sa 3
QFP ipsec sa Information

         QFP sa  id: 3
          pal sa id: 2
         QFP spd id: 1
          QFP sp id: 2
            QFP spi: 0x4c1d1e90(1276976784)
         crypto ctx: 0x000000002e03bfff
              flags: 0xc000800
                   : src:IKE  valid:Yes  soft-life-expired:No  hard-life-expired:No
                   : replay-check:Yes  proto:0  mode:0  direction:0
                   : qos_preclassify:No  qos_group:No
                   : frag_type:BEFORE_ENCRYPT  df_bit_type:COPY
                   : sar_enable:No  getvpn_mode:SNDRCV_SA
                   : doing_translation:No  assigned_outside_rport:No
                   : inline_tagging_enabled:No
          qos_group: 0x0
                mtu: 0x0=0
          sar_delta: 0
         sar_window: 0x0
         sibling_sa: 0x0
             sp_ptr: 0x8c392000
            sbs_ptr: 0x8bfbf810
     local endpoint: 10.1.0.100
    remote endpoint: 10.2.0.200
   cgid.cid.fid.rid: 0.0.0.0
               ivrf: 0
               fvrf: 0
    trans udp sport: 0
    trans udp dport: 0
    first intf name: Tunnel1
  <SNIP>
An Embedded Event Manager (EEM) script can also be used to automate the data collection:
event manager applet Replay-Error
 event syslog pattern "%IPSEC-3-REPLAY_ERROR: IPSec SA receives anti-replay error"
 action 1.0 regexp "([0-9]+)$" "$_syslog_msg" dph
 action 2.0 cli command "enable"
 action 3.0 cli command "show platform hardware qfp active feature ipsec sa $dph |
 append bootflash:replay-error.txt"
In this example, the output collected is redirected to the bootflash. In order to see this output, use the command more bootflash:replay-error.txt.
Related Information
- Voice and Video Enabled IPSec VPN (V3PN) Solution Reference Network Design
- How to Configure IPsec Anti-Replay Window: Expanding and Disabling.
- Technical Support & Documentation - Cisco Systems
Revision History
| Revision | Publish Date | Comments |
|---|---|---|
7.0 |
14-Sep-2026
|
Recertification |
6.0 |
21-Nov-2025
|
Machine translation, branding, formatting, and fixed some links. |
5.0 |
04-Sep-2024
|
Updated SEO, Machine Translation, References, and Formatting. |
2.0 |
13-Feb-2022
|
Aditional Information |
1.0 |
15-Dec-2013
|
Initial Release |

 Feedback
Contact Cisco
- Open a Support Case

- (Requires a Cisco Service Contract)