Introduction
This document describes how to track a network flow using packet coloring techniques.
Prerequisites
Requirements
- Basic knowledge of ACI
- Endpoint Groups and contract
- Wireshark basic knowledge
Components Used
This document is not restricted to specific hardware and software versions.
Devices used:
- Cisco ACI running version 5.3(2)
- Span destination
- Gen2 switches
The information in this document was created from the devices in a specific lab environment. All of the devices used in this document started with a cleared (default) configuration. If your network is live, ensure that you understand the potential impact of any command.
Background Information
How to create filters in Wireshark.
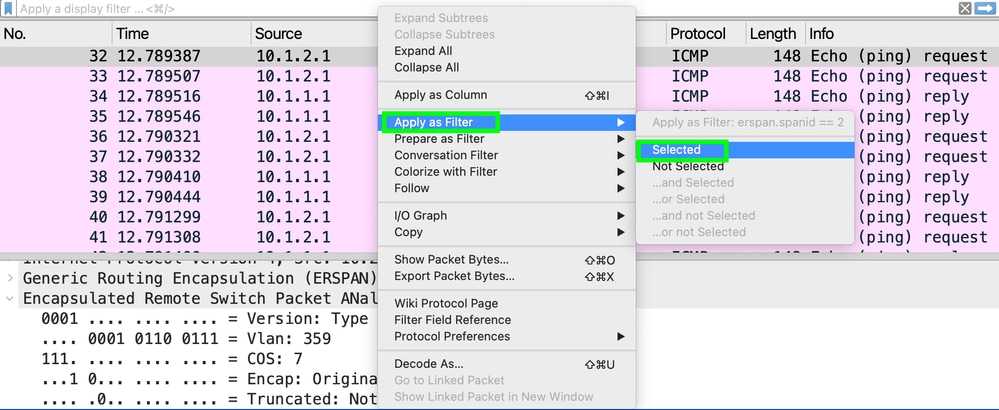
Open the capture. Using a frame inside the Encapsulated Remote Switch Packet, select the SpanID line and right-click.
Select Apply as Filter > Selected as the picture shows:
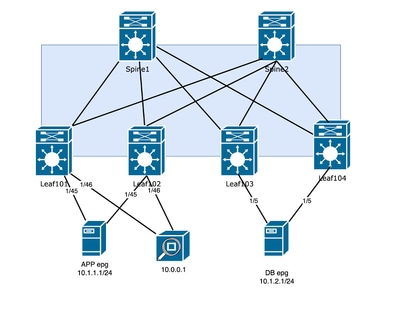
Topology
Option 1. ERSPAN Setup with Flow-id
If a destination server is capable of handling all the traffic, the ERSPAN header includes an option to define a Flow ID. This Flow ID can be configured to identify incoming traffic to the fabric, while a different Flow ID can be set up for outgoing traffic.
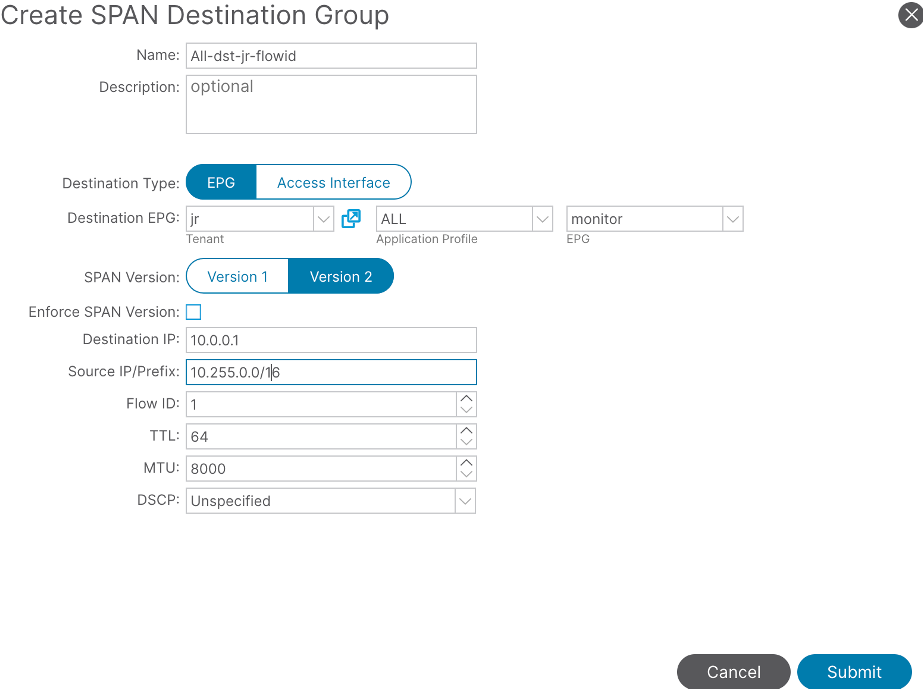
Step 1. ESPAN Destination Setup
One destination group is going to have the flow-id of 1
Under Fabric > Access Policies > Policies > Troubleshooting > SPAN > SPAN Destination Groups
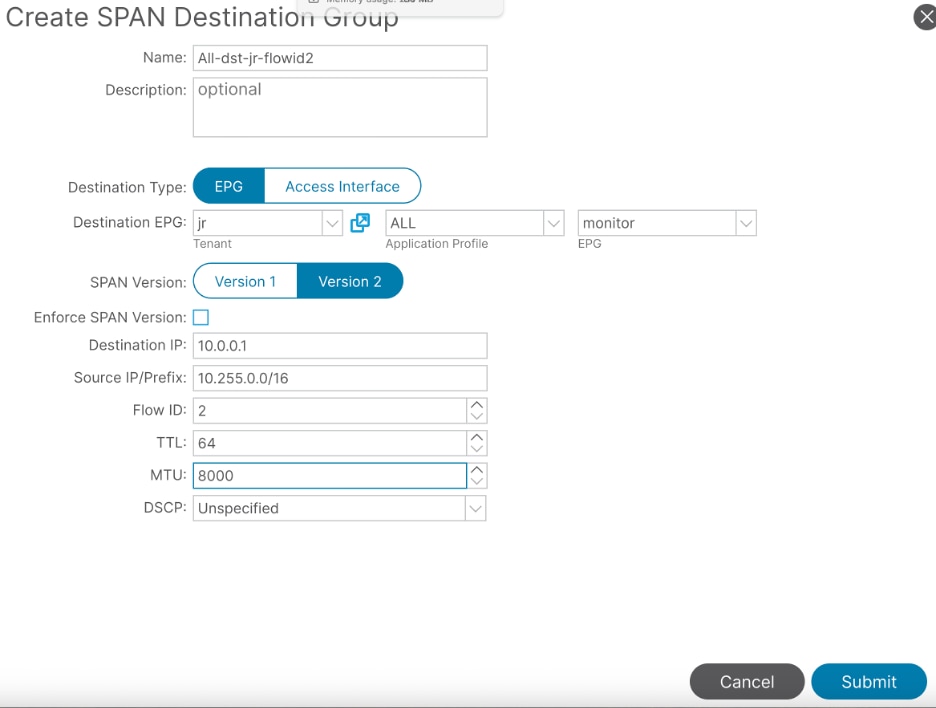
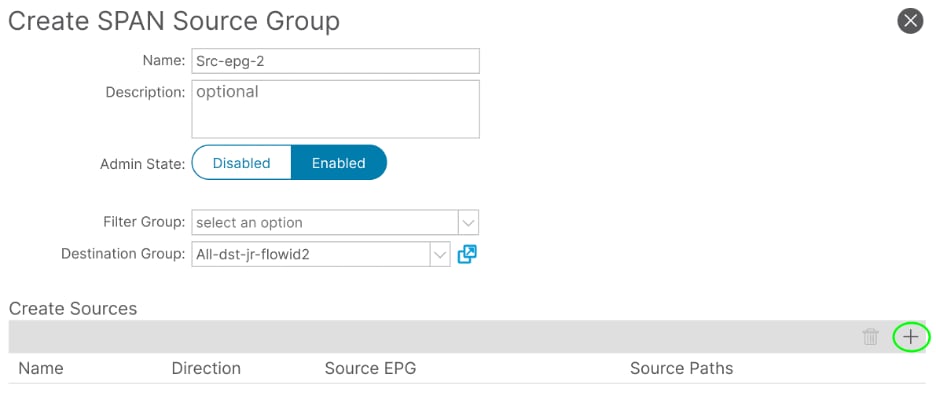
On the second destination group, configure flow-id of 2:
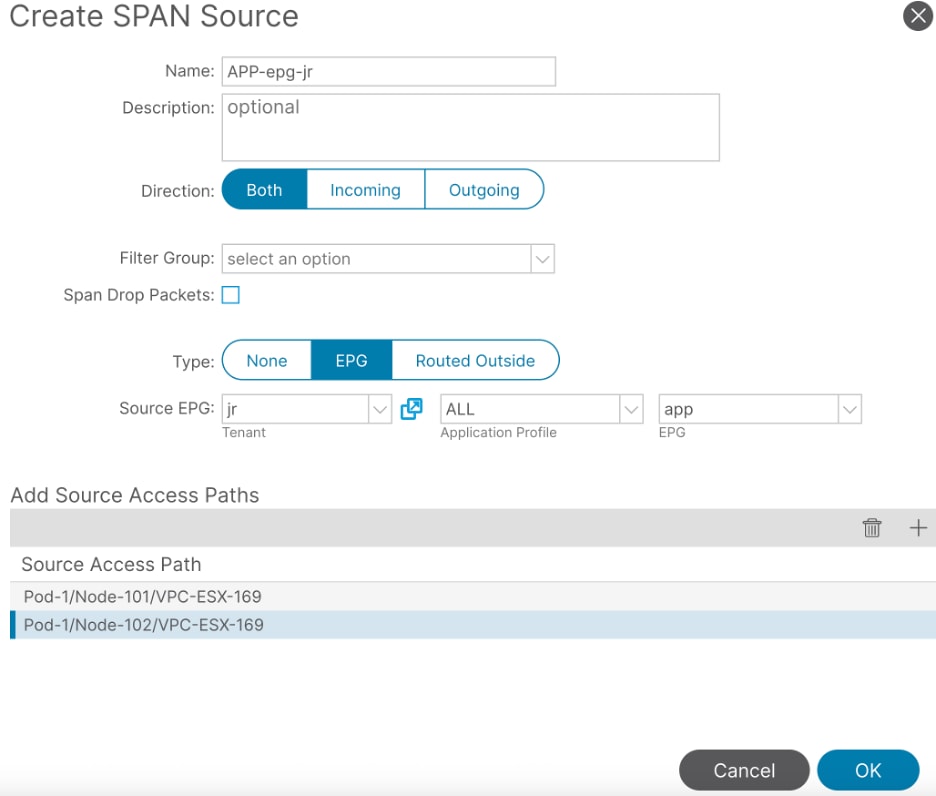
Step 2a. Create Span Source for the Traffic Directly Connected to the SRC
Under Fabric > Access Policies > Policies > Troubleshooting > SPAN > SPAN Source Groups
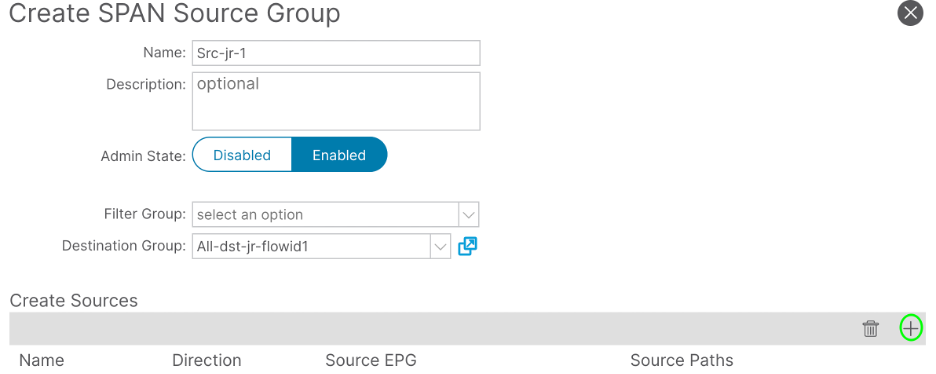
Filter the traffic more by adding the Path and the EPG. The lab example is Tenant jr Application Profile ALL and EPG app.
Step 2b. Create Span Source for the Traffic Directly Connected to the DST
Under Fabric > Access Policies > Policies > Troubleshooting > SPAN > SPAN Source Groups
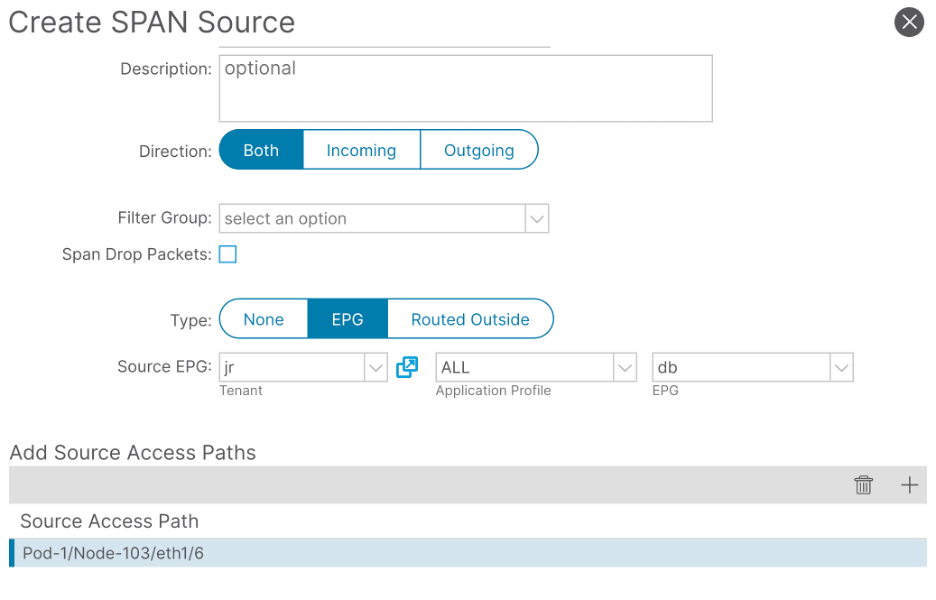
Filter the traffic more by adding not only the Path but also the EPG DB:
Step 3. Quick Wireshark Analysis
In this example, you are verifying that the number of ICMP request packets matches the number of ICMP response packets, ensuring that there are no packet drops within the ACI fabric.
Open the capture on wireshark to create the filter using the SPAN ID /Flow-ID configured along with SRC and DST IP:
(erspan.spanid == <id selected on ERSPAN DST group> and <protocol>) && (ip.src== <ip src> and ip.dst == <ip dst>)
Filter Used for the Lab tested flow:
(erspan.spanid == 1 and icmp) && (ip.src== 10.1.2.1 and ip.dst == 10.1.1.1)
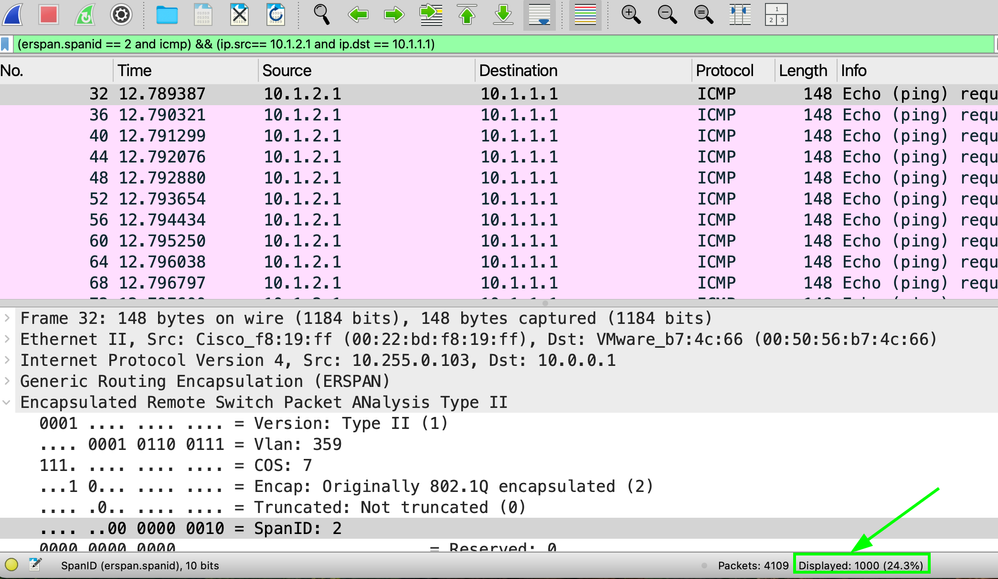
Verify the Displayed packet is the same amount as sent:

The next SPAN ID must have the same amount; if it does not, the packet was dropped inside the fabric.
Filter:
(erspan.spanid == 2 and icmp) && (ip.src== 10.1.2.1 and ip.dst == 10.1.1.1)
Option 2. Platform Counters
This method takes advantage that Nexus is tracking the performance of individual interfaces with different Packet sizes, but the method does require that at least a queue has a low amount of traffic, if not zero.
Clear Platform Counters
Go into the individual switch and clear the individual interface that connects to the devices.
Switch#vsh_lc -c “clear platform internal counters port <port id>”
LEAF3# vsh_lc -c “clear platform internal counters port 6”
LEAF1# vsh_lc -c “clear platform internal counters port 45”
LEAF2# vsh_lc -c “clear platform internal counters port 45”
Identify a Packet Size with Low or Zero Packets
Find a packet size that has possibly no counters in all Leafs for both RX and TX:
vsh_lc -c ‘show platform internal counters port <id>’ | grep X_PKT
In the next example, packet size greater than 512 and lower than 1024:
LEAF101# vsh_lc -c "show platform internal counters port 45 " | grep X_PKT
                 RX_PKTOK          1187
                 RX_PKTTOTAL       1187
                 RX_PKT_LT64          0
                 RX_PKT_64            0
                 RX_PKT_65         1179
                 RX_PKT_128           8
                 RX_PKT_256           0
                 RX_PKT_512           0 <<
                 RX_PKT_1024          0
                 RX_PKT_1519          0
                 RX_PKT_2048          0
                 RX_PKT_4096          7
                 RX_PKT_8192          43
                 RX_PKT_GT9216        0
                 TX_PKTOK          3865
                 TX_PKTTOTAL       3865
                 TX_PKT_LT64          0
                 TX_PKT_64            0
                 TX_PKT_65         3842
                 TX_PKT_128          17
                 TX_PKT_256           6
                 TX_PKT_512           0 <<
                 TX_PKT_1024          10
                 TX_PKT_1519          3
                 TX_PKT_2048          662
                 TX_PKT_4096          0
                 TX_PKT_8192          0
                 TX_PKT_GT9216        0
The step needs to be performed in the link where the packets are being forwarded to it.
Track Traffic Flow
From server 10.1.2.1, 1000 packets are sent with a packet size of 520.
Verify on Leaf 103 interface 1/6, where traffic is initiated on RX:
MXS2-LF103# vsh_lc -c "show platform internal counters port 6 " | grep X_PKT_512
                 RX_PKT_512        1000
                 TX_PKT_512         647
1000 packet RX, but only 647 were sent as a reply.
The next step is to check the other servers' outgoing interfaces:
For Leaf102:
MXS2-LF102# vsh_lc -c "show platform internal counters port 45 " | grep X_PKT_512
                 RX_PKT_512           0
                 TX_PKT_512        1000
The fabric did not drop the Request.
For Leaf 101, RX packets 647 and is the same amount of packets TX by ACI.
MXS2-LF101#  vsh_lc -c "show platform internal counters port 45 " | grep X_PKT_512
                 RX_PKT_512        647
                 TX_PKT_512          0
Related Information
Troubleshoot ACI Intra-Fabric Forwarding - Intermittent Drops
 Feedback