Introduction
This document describes how to report on different type of RONA (reroute on no answer) issues seen by WxCC (Webex Contact Center) agents and how to effectively report them to Cisco Support.
Prerequisites
Requirements
Cisco recommends that you have knowledge of these topics:
- Webex Contact Center
- Analyzer Reports
Components Used
This document is not restricted to specific software and hardware versions.
The information in this document was created from the devices in a specific lab environment. All of the devices used in this document started with a cleared (default) configuration. If your network is live, ensure that you understand the potential impact of any command.
Background Information
There are few types of RONA issues which can be seen with Webex Contact Center Agents. With existing reports, it is slightly <<difficult>> to pinpoint the cause of RONA with existing reports. This document tries to provide few sample reports that can help you track the RONA instances that are normal and the ones that are not. This article is an extension of another article that you can find here:
Troubleshoot and Understand RONA Issues in Webex Contact Center
Problem: How to enhance RONA reporting data for Webex Contact Center Solution with custom reporting?
Reroute on No Answer (RONA) occurs when a call is delivered to an available agent but it is not answered due to any reasons such as endpoint failures, agent unavailability, or application issues.
Currently, Webex Contact Center lacks an out-of-the-box Analyzer report that comprehensively tracks and categorizes all RONA occurrences, making it challenging to diagnose root causes and implement corrective actions efficiently.
Challenges (not limited to):
Limited Granularity – Existing reports do not provide detailed segmentation of RONA occurrences, making it difficult to identify specific failure points.
Absence of Real-Time Monitoring – Delays in identifying high RONA rates prevent proactive issue resolution.
No Cross-Metric Correlation – RONA data is not analyzed alongside other performance indicators such as network performance, agent behaviors or application logs.
Solution
There are four custom reports that can be imported abd executed to track the RONA issues
1. Immediate RONA: This report aims to track the number of RONAs originated due to a call delivery failure before even call starts ringing at the agent endpoint.
2. RONA between 3 secconds to 18 seconds: This report aims to track the number of RONAs before the default RONA timer expiry. Underlying reasons could vary. Eg:. Softphone (Webex App) issues or endpoint timeout's and so on.
3. RONA after default timer (18 sec) expiry: This report aims to track the number of RONAs after the default RONA timer has expired. Underlying reason examples: Agent did not answer, notification alerting and so on.
4. Consolidated Report (includes 1,2,3 built in module): This reports aims to serve as a dashboard for information purposes due to the fact it does not allow report output to csv or xls format.
How to import reports:
Please download and import report json in to the desired folder of your choice on Analyzer Reporting platform.
Note: After the json files are imported, filter values are lost. You need to re-add filters accordingly.
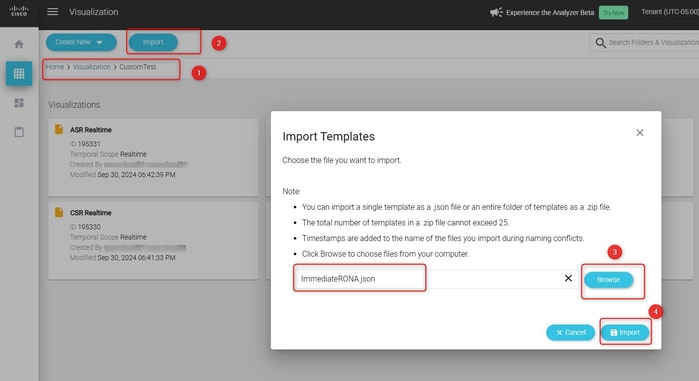
Import instructions:
Step 1. Navigate to the folder of your choice
Step 2. Click on Import button
Step 3. Click on browser and navigate to the json files
Step 4. Click on Import
Step 5. Once the report is imported, follow sections for specific reports to add their respective filters
You can see the process in this image:
There is also a short video for the process to follow:
Vidcast Link - How to import a report and set filters
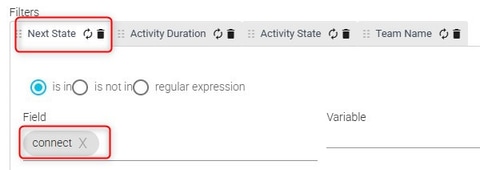
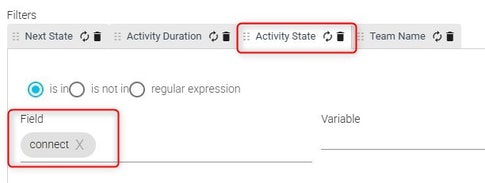
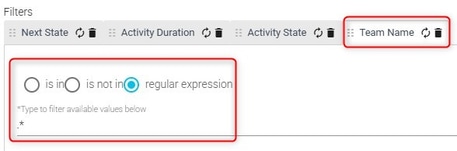
First Report: Immediate RONA
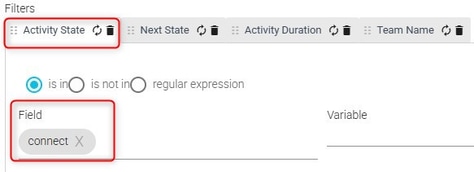
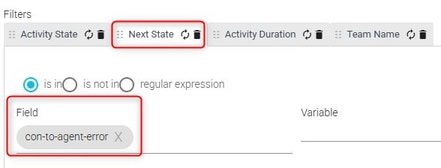
Add the filters to the report
Sample report
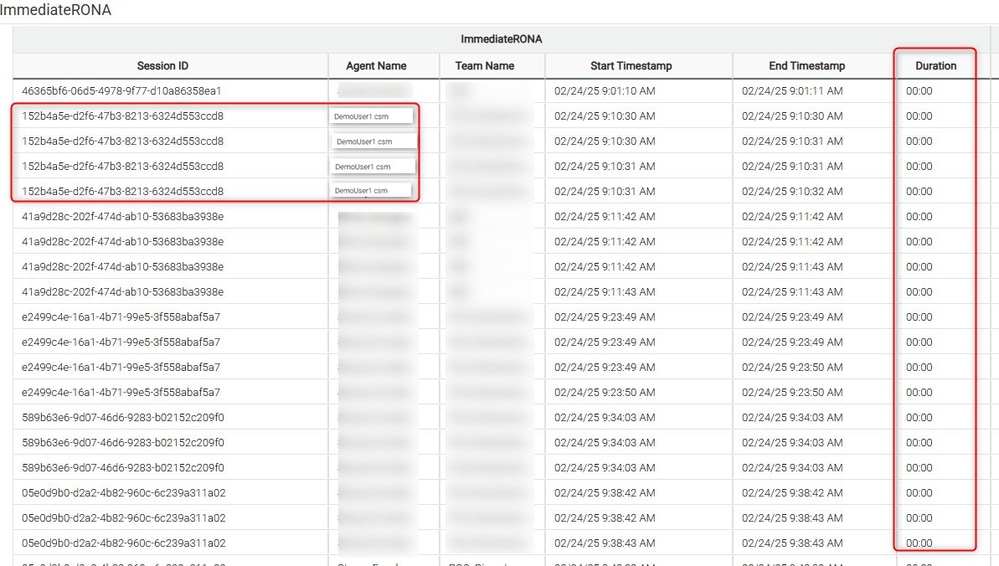
How to interpret the Immediate RONA report
- Export the events to csv or excel
- Filter applied here “Value of Activity State” & “Value of Next Activity state” = “connect”
- To calculate Total (Immediate RONA) formula is = Total count of session id's / 4
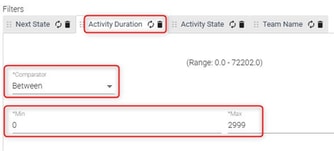
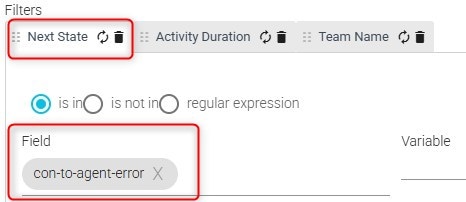
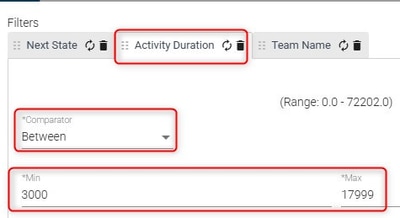
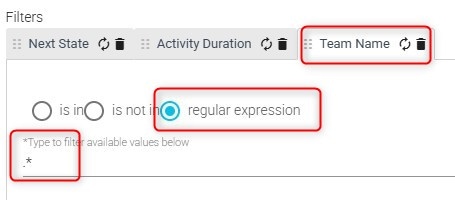
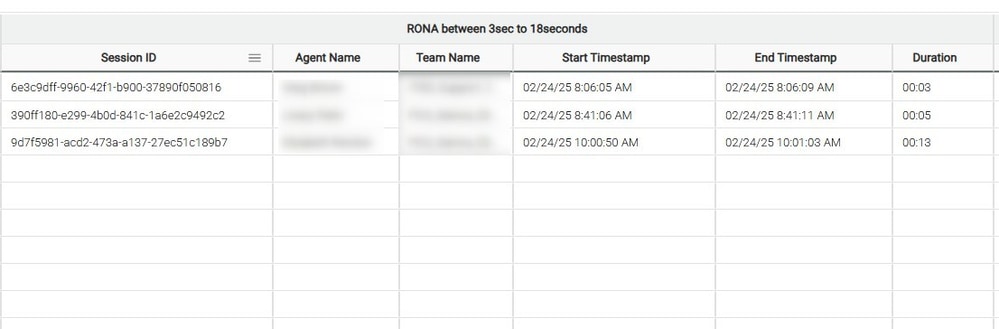
Second report: RONA between 3 secconds to 18 seconds
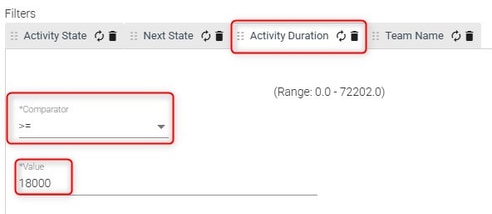
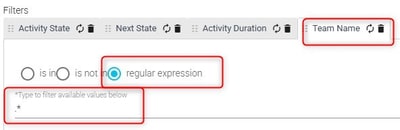
Add the filters to the report
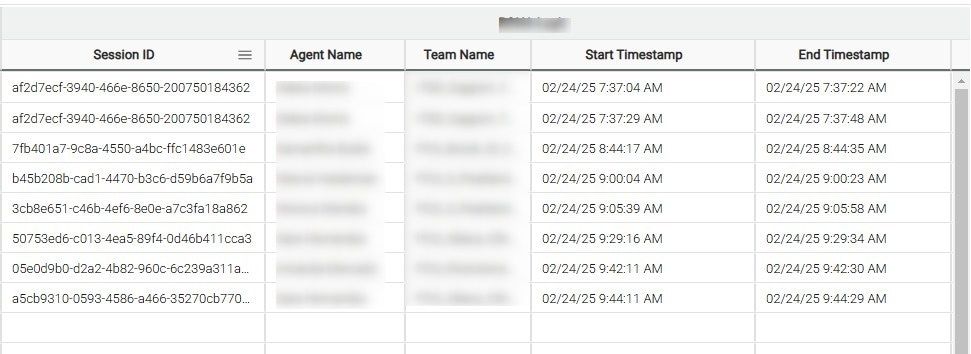
Sample report
Third report: RONA after default timer (18 sec) expiry
Sample report
Fourth report: Consolidated RONA report (Previous 3 reports are built-in as a module)
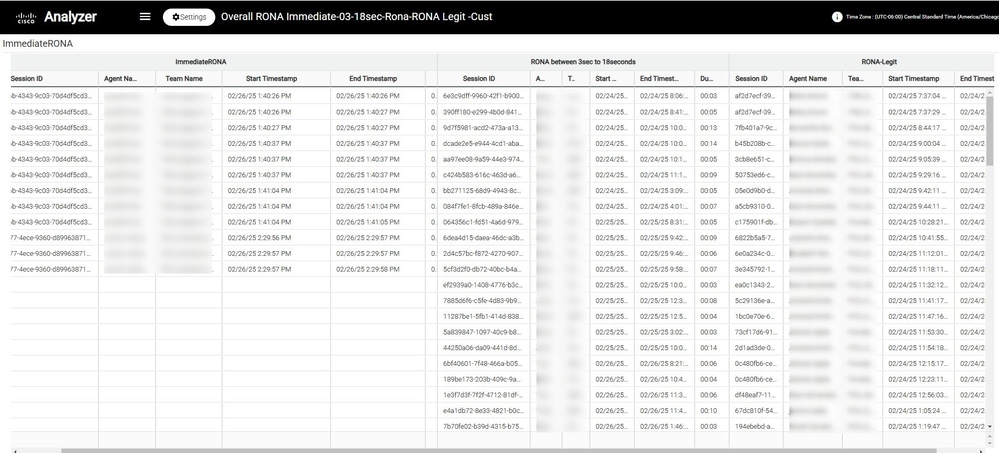
Offers a consolidated overview of the three RONA reports
Sample report
Report templates
Immediate RONA
Immediate RONA Report
Consolidated RONA
Consolidated RONA Report
RONA after default timer (18 seconds) expiry
RONA After Default Timer Report
RONA between 3 to 18 seconds
RONA Between 3 to 18 seconds Report
Related Information
 Feedback