Introduction
This document describes how to use the perf tool on NSO hosts to investigate performance issues.
Prerequisites
Requirements
Cisco recommends that you have knowledge of these topics:
- Basic Linux/Unix command line usage
- NSO (Network Services Orchestrator) system architecture and operation
- CPU profiling and analysis concepts
- Familiarity with performance troubleshooting workflows
Components Used
The information in this document is based on these software and hardware versions:
- NSO system or local installation on a supported Unix/Linux host
- Linux distributions such as Ubuntu, Debian, Fedora, or RedHat derivatives
- perf tool (Linux performance analysis tool)
The information in this document was created from devices in a specific lab environment. All of the devices used in this document started with a cleared (default) configuration. If your network is live, ensure that you understand the potential impact of any command.
Background Information
Perf is a powerful performance analysis tool in Linux, used primarily for CPU profiling. It provides insights into what the CPU is currently working on by capturing and analyzing the load of lower-level functions. This helps identify which functions or processes are occupying the CPU and is essential for pinpointing performance bottlenecks.
Perf can also generate flame graphs, which are special charts that visually represent which parts of a program use the most CPU time. Flame graphs make it easier to spot areas in code that must need optimization.
Importantly, perf is also included in the main data collection checklist for Out of Memory (OOM) cases as recommended by the NSO Business Unit (BU). For more detailed guidance on OOM troubleshooting please contact Cisco TAC.
Troubleshoot Perf Usage for NSO Performance Issues
This section provides a comprehensive workflow for installing, using, and analyzing data from the perf tool on NSO hosts to troubleshoot performance problems.
Install Perf
Step 1: Install perf on your Linux distribution. Use the appropriate command for your OS:
For Ubuntu:
apt-get update && apt-get -y install linux-tools-generic
For Debian:
apt-get update && apt-get -y install linux-perf
For Fedora/RedHat derivatives:
dnf install -y perf
For more information about known caveats while installing perf, please contact Cisco TAC team.
Sampling the Data
Step 1: Identify the main NSO process.
Use the below given command to locate the NSO process (ncs.smp):
ps -ef | grep ncs\.smp
Example output:
root    120829       1  16 13:23 ? 00:11:08 /opt/ncs/current/lib/ncs/erts/bin/ncs.smp -K true -P 277140 -- -root /opt/ncs/current/lib/ncs -progname ncs -- -home / -- -cd /var/opt/ncs -pa /opt/ncs/current/lib/ncs/patches -boot ncs -ncs true -delayed-detach -noshell -noinput -yaws embedded true -kernel gethost_poolsize 16 -stacktrace_depth 24 -shutdown_time 30000 -ssl_dist_optfile /var/opt/ncs/state/ssl_dist_optfile -delayed-heart -conffile /etc/ncs/ncs.conf -max_fds 65535 -- -detached-fd 4
root    121424   120604  0 14:30 pts/0 00:00:00 grep --color=auto ncs.smp
Step 2: Alternatively, you must use the PID of the main Java process tied to NSO, especially if focusing on Java operations. Run:
ps -ef | grep NcsJVMLauncher
Example output:
root    120903   120833  6 13:32 ? 00:03:40 java -classpath :/opt/ncs/current/java/jar/* -Dhost=127.0.0.1 -Dport=4569 -Djvm.restart.enabled=false -Djvm.restart.errCount=3 -Djvm.restart.duration=60 -Djava.security.egd=file:/dev/./urandom -Dfile.encoding=UTF-8 -Dorg.apache.logging.log4j.simplelog.StatusLogger.level=OFF com.tailf.ncs.NcsJVMLauncher
root    121435   120604  0 14:33 pts/0 00:00:00 grep --color=auto NcsJVMLauncher
Step 3: Execute the problematic test case or use-case to validate the performance scenario.
Step 4: On a different terminal window, run perf against the relevant process IDs (PIDs). Use the below given command format, replacing XX,YY,ZZ with the PIDs obtained above:
perf record -F 100 -g -p XX,YY,ZZ
For example, to profile system-wide and gather call graphs at 99Hz for specific PIDs:
perf record -a -g -F 99 -p 120829,120903
Example output:
Warning:
PID/TID switch overriding SYSTEM
Option Descriptions:
- -a: All-CPUs; system-wide collection from all CPUs (default if no target is specified).
- -g: Capture call graphs (stack traces). Identifies where functions are being called.
- -F: Frequency of sampling in Hz. Higher frequencies increase precision but add overhead.
- -p: Specifies the process ID(s).
Step 5: When you are done collecting samples, stop perf with Ctrl+C:
^C
[ perf record: Woken up 1 times to write data ]
[ perf record: Captured and wrote 0.646 MB perf.data (4365 samples) ]
You now see a perf.data file in the current directory.
Step 6: Generate a summary report with this command:
perf report -n --stdio > perf_report.txt
Option Descriptions:
- -n: Show symbols without grouping (flat view).
- --stdio: Force output to standard output (the terminal).
At this point, you must save both files (perf.data and perf_report.txt) and share them with your support contact before moving on to further analysis.
If the capture was successful, perf_report.txt shows a tree-like structure representing a hierarchical call graph. Percentages help you identify hotspots where most CPU time is being spent.
Example excerpt:
# Children      Self       Samples  Command          Shared Object         Symbol
# ........  ........  ............  ...............  ....................  ...................................................................
#    30.61%     0.00%             0  C2 CompilerThre  libc.so.6             [.] start_thread
#            ---start_thread
#               thread_native_entry(Thread*)
#               Thread::call_run()
#               JavaThread::thread_main_inner()
#               CompileBroker::compiler_thread_loop()
#                          --30.58%--CompileBroker::invoke_compiler_on_method(CompileTask*)
#                                     --30.47%--C2Compiler::compile_method(ciEnv*, ciMethod*, int, bool, DirectiveSet*)
#                                     Compile::Compile(ciEnv*, ciMethod*, int, bool, bool, bool, bool, bool, DirectiveSet*)
#                                               |--17.57%--Compile::Code_Gen()
#                                               |          |--12.46%--PhaseChaitin::Register_Allocate()
#                                               |          |          |--2.79%--PhaseChaitin::build_ifg_physical(ResourceArea*)
#                                               |          |          |           --1.05%--PhaseChaitin::interfere_with_live(unsigned int, IndexSet*) [clone .part.0]
#                                               |          |--1.49%--PhaseChaitin::Split(unsigned int, ResourceArea*)
#                                               |          |--1.26%--PhaseChaitin::post_allocate_copy_removal()
Interpretation:
- Process/Thread: The C2 CompilerThre thread is being analyzed.
- Total CPU Usage: This thread is responsible for 30.61% of CPU time.
- Function Flow: The thread starts with
start_thread and delegates work across several layers. The bulk of CPU time (30.47%) is spent in C2Compiler::compile_method, indicating a potential hotspot.
Generating a Flame Graph
Step 1: Generate a performance sample from all CPUs and processes over a defined interval (e.g., 60 seconds):
perf record -a -g -F 99 sleep 60
Example output:
[ perf record: Woken up 32 times to write data ]
[ perf record: Captured and wrote 10.417 MB perf.data (67204 samples) ]
Step 2: Copy or transfer this perf.data file to a host from which you can download the flamegraph template repository.
Step 3: Convert the perf.data file to a text format:
perf script > data.perf
Step 4: Clone the FlameGraph GitHub repository and place data.perf into this directory:
cp data.perf $PWD/FlameGraph/.
Step 5: Collapse the stack traces for flamegraph processing:
cat data.perf | ./stackcollapse-perf.pl > data.perf-folded
Step 6: Generate the flame graph SVG file:
./flamegraph.pl data.perf-folded > data.svg
Note: If you encounter the "can not locate open.pm in @INC" error on CentOS or RHEL, install the required Perl module:
yum install perl-open.noarch
Step 7: Open the data.svg file in your preferred web browser to visualize the flame graph.
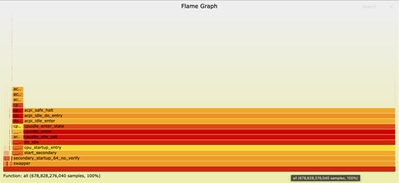
Browse the Flame Graph
Once the flame graph file is open in your browser, you can interact with it by clicking any box to zoom into that function and its call stack. The length of each box represents the amount of CPU time spent in that function and its call stack. This visualization makes it easy to identify hotspots and areas for optimization.
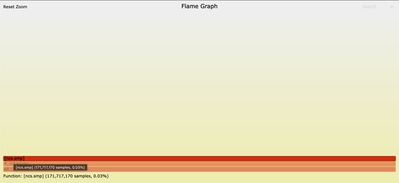
Zoomed in ncs.smp:
Related Information
 Feedback