100 Key Performance (Indicating) Metrics Dictionary from a 5G Cell Site White Paper
Available Languages
Bias-Free Language
The documentation set for this product strives to use bias-free language. For the purposes of this documentation set, bias-free is defined as language that does not imply discrimination based on age, disability, gender, racial identity, ethnic identity, sexual orientation, socioeconomic status, and intersectionality. Exceptions may be present in the documentation due to language that is hardcoded in the user interfaces of the product software, language used based on RFP documentation, or language that is used by a referenced third-party product. Learn more about how Cisco is using Inclusive Language.
1. Key performance indicating metrics of a 5G cell site router
This white paper is a dictionary of 100 key performance (indicating) metrics tested and working on a cell site router deployed in a 5G Radio Access Network (RAN). You can pick the ones that are relevant to you based on:
● Deployment scale
● Flavor of 5G services
● SLAs of your enterprise customers
● Transport features deployed
● History of prevalent network problems
For this white paper, we have chosen the Cisco® Network Convergence System 540 Router (NCS 540) or the N540X-16Z4G8Q2C-D as the device type for our KPI analysis.
1.1. What is a transport KPI metric?
A transport KPI metric is an indicator of the performance health of the system. It provides the smallest unit of quantifiable measurement of performance over time. It must be tracked as a contributing (periodic) factor for KPIs.
1.2. What is a transport KPI?
A transport KPI of the transport network is a performance measurement parameter agreed upon (before measurement) to reflect the success of performance based on measurable organizational goals. As mentioned in Section 1.1, the KPI is derived from the metric (or KPI metric) or several metrics with predefined thresholds.
1.3. How do we pick what transport KPI metrics to deploy?
The scope of deployment of these KPI metrics lies with the functions that the cell site is performing. We need to correlate 5G RAN KPIs and 5G business KPIs with transport KPIs and analyze the impact of these on each other. Throughout the rest of the document, for simplicity, we are going to use KPI or key performance indicator instead of KPI metric.
2.1. Generic KPIs
Software version: This is neither a performance KPI nor a fault management KPI. It is an “accounting” KPI used by the deployment team to track the software releases (and the count) in the network.
The Command-Line Interface (CLI) command to display the Cisco IOS® XR version of the router is shown below:
| <<router>>#show version Cisco IOS XR Software, Version 7.8.2 LNT Copyright (c) 2013-2023 by Cisco Systems, Inc.
Build Information: Built By : ingunawa Built On : Wed Mar 15 16:45:19 UTC 2023 Build Host : iox-lnx-069 Workspace : /auto/srcarchive13/prod/7.8.2/ncs540l/ws Version : 7.8.2 Label : 7.8.2-PL1_1
cisco NCS540L (C3708 @ 1.70GHz) cisco N540X-16Z8Q2C-D (C3708 @ 1.70GHz) processor with 8GB of memory <<router>> uptime is 12 weeks, 23 hours, 28 minutes Cisco NCS 540 System with 16x10G+8x25G+2x100G DC Chassis |
The corresponding YANG model, sensor path, and leaf that stores the software version are shown below:
| <<router>>#yang-describe operational show version YANG Paths: Cisco-IOS-XR-install-augmented-oper:install/version/brief |
The JSON data that is present in this model on the specific container leaf “brief” is shown below:
| <<router>>#show yang operational install-augmented-oper:install version brief JSON { "Cisco-IOS-XR-install-augmented-oper:install": { "version": { "brief": { "package": [ { "name": "xr-mandatory", "version": "7.8.2v1.0.0-1", "built-by": "ingunawa", "built-on": "Wed Mar 15 16:45:19 UTC 2023", "workspace": "/auto/srcarchive13/prod/7.8.2/ncs540l/ws", "build-host": "iox-lnx-069" } ], "label": "7.8.2-PL1_1", "copyright-info": "Copyright (c) 2013-2023 by Cisco Systems, Inc.", "hardware-info": "NCS540L", "uptime": "12 weeks, 23 hours, 37 minutes", "processor": "C3708 @ 1.70GHz", "chassis-pid": "N540X-16Z8Q2C-D", "chassis-description": "Cisco NCS 540 System with 16x10G+8x25G+2x100G DC Chassis", "xr-host-name": "router", "total-ram": "8" } } } } |
If you want to go one level further and investigate the containers, the data structure of the leaf in that container, and most importantly, the possible values of that leaf, you can either PYANG the data model (on a Linux subsystem) or read this data on GitHub for Vendor Cisco.
For this KPI/leaf, there are no possible values mentioned in the YANG model. The type of this leaf is a string.
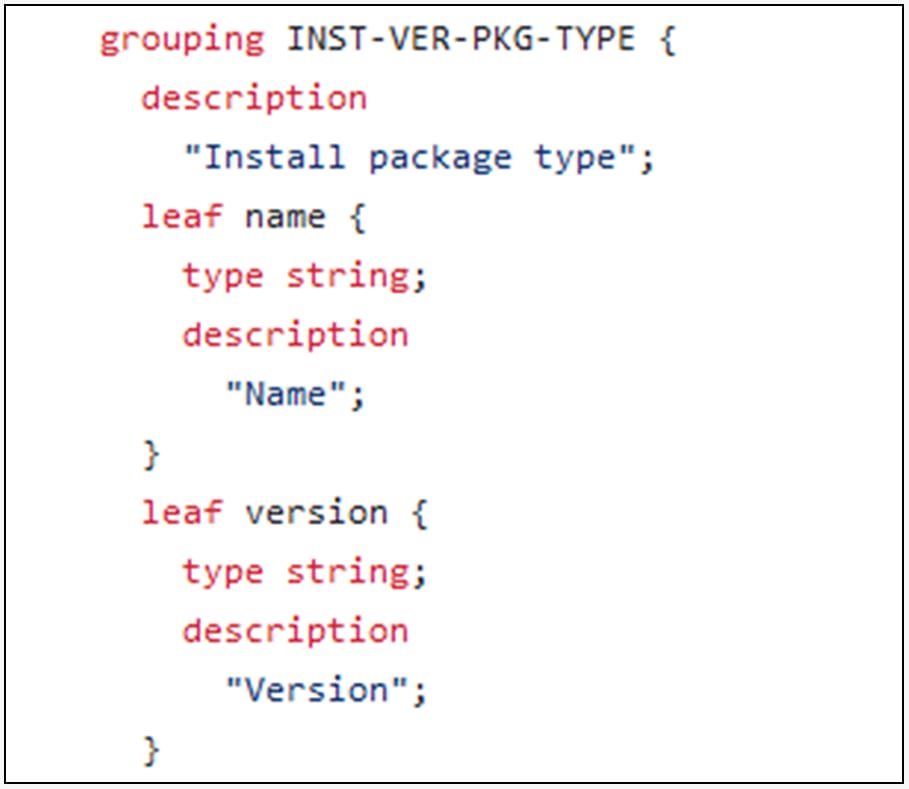
Leaf version from GitHub
Router uptime is a performance management KPI used to build the availability health of a network element.
The CLI command to display the uptime of the router is shown below:
| <<router>>#show version Cisco IOS XR Software, Version 7.8.2 LNT Copyright (c) 2013-2023 by Cisco Systems, Inc.
Build Information: Built By : ingunawa Built On : Wed Mar 15 16:45:19 UTC 2023 Build Host : iox-lnx-069 Workspace : /auto/srcarchive13/prod/7.8.2/ncs540l/ws Version : 7.8.2 Label : 7.8.2-PL1_1
cisco NCS540L (C3708 @ 1.70GHz) cisco N540X-16Z8Q2C-D (C3708 @ 1.70GHz) processor with 8GB of memory <<router>> uptime is 12 weeks, 23 hours, 28 minutes Cisco NCS 540 System with 16x10G+8x25G+2x100G DC Chassis |
The corresponding YANG model, sensor path, and leaf that stores the value of the router uptime KPI is shown below:
| <<router>>#yang-describe operational show version YANG Paths: Cisco-IOS-XR-install-augmented-oper:install/version/brief |
The JSON data that is present in this model on the specific container leaf “brief” is shown below
| <<router>>#show yang operational install-augmented-oper:install version brief JSON { "Cisco-IOS-XR-install-augmented-oper:install": { "version": { "brief": { "package": [ { "name": "xr-mandatory", "version": "7.8.2v1.0.0-1", "built-by": "ingunawa", "built-on": "Wed Mar 15 16:45:19 UTC 2023", "workspace": "/auto/srcarchive13/prod/7.8.2/ncs540l/ws", "build-host": "iox-lnx-069" } ], "label": "7.8.2-PL1_1", "copyright-info": "Copyright (c) 2013-2023 by Cisco Systems, Inc.", "hardware-info": "NCS540L", "uptime": "12 weeks, 23 hours, 37 minutes", "processor": "C3708 @ 1.70GHz", "chassis-pid": "N540X-16Z8Q2C-D", "chassis-description": "Cisco NCS 540 System with 16x10G+8x25G+2x100G DC Chassis", "xr-host-name": "router", "total-ram": "8" } } } } |
If you want to go one level further and investigate the containers, the leaf, and the data structure of the leaf, you can either PYANG the data model (on a Linux subsystem) or read this data on GitHub for Vendor Cisco.
For this KPI/leaf, there are no possible values mentioned in the YANG model. The type of this leaf is “string”.
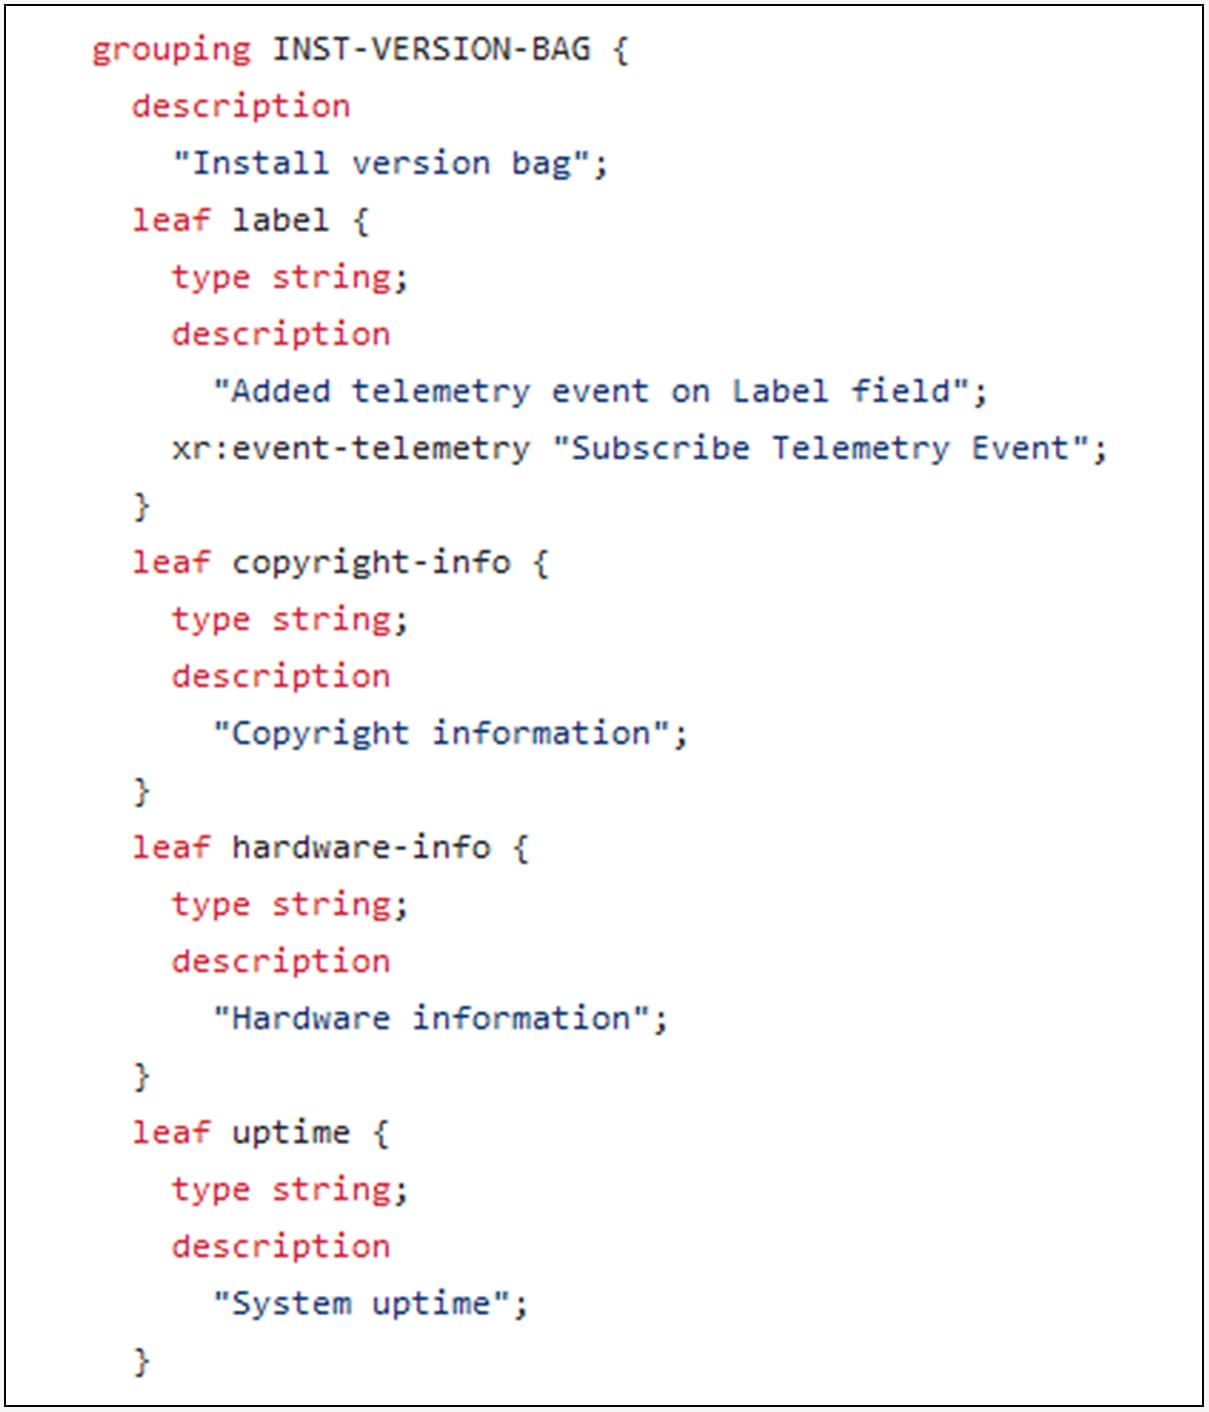
Leaf uptime from GitHub
Now, it is probably not ideal to use “string” as your data type to build availability. There is another data model available to monitor this KPI. The data model is at this link, and the KPI is in “second.”
| leaf uptime { type uint32; units "second"; description "Amount of time in seconds since this system was last initialized"; |
Reboot history reason: This is a fault management KPI often used to analyze the reason code behind multiple “silent” reloads of a cell site outer.
The CLI command to display the reboot history of the router is shown below:
| <<router>>#sh reboot history Location: 0/RP0/CPU0 ----------------------------------------------------------------------- No DATE TIME (UTC) Cause Code Cause String ----------------------------------------------------------------------- 1 Nov 09 2023 18:13:43 0x00000024 REBOOT_CAUSE_UPGRADE 2 May 18 2023 21:29:53 0x00000025 REBOOT_CAUSE_ADMIN 3 May 18 2023 21:14:35 0x00000025 REBOOT_CAUSE_ADMIN 4 May 17 2023 21:07:55 0x00000025 REBOOT_CAUSE_ADMIN 5 May 17 2023 19:28:40 0x00000025 REBOOT_CAUSE_ADMIN 6 Mar 17 2023 17:27:37 0x00000025 REBOOT_CAUSE_ADMIN 7 Dec 22 2022 16:40:43 0x00000025 REBOOT_CAUSE_ADMIN 8 Apr 12 2022 01:24:19 0x00000025 REBOOT_CAUSE_ADMIN 9 Apr 12 2022 01:10:04 0x00000025 REBOOT_CAUSE_ADMIN ----------------------------------------------------------------------- |
The corresponding YANG model, sensor path, and leaf that stores the value of the reboot history reason KPI is shown below:
| <<router>>#yang-describe operational show reboot history YANG Paths: Cisco-IOS-XR-linux-os-reboot-history-oper:reboot-history/node |
The JSON data that is present in this model on a specific container leaf is as below:
| <<router>>#show yang operational linux-os-reboot-history-oper:reboot-history node JSON { "Cisco-IOS-XR-linux-os-reboot-history-oper:reboot-history": [ { "node": [ { "node-name": "0/RP0/CPU0", "reboot-history": [ { "no": 9, "time": "Apr 12 2022 01:10:04", "cause-code": 37, "reason": "User initiated card reload" }, { "no": 8, "time": "Apr 12 2022 01:24:19", "cause-code": 37, "reason": "User initiated card reload" }, { "no": 7, "time": "Dec 22 2022 16:40:43", "cause-code": 37, "reason": "User initiated card reload" }, { "no": 6, "time": "Mar 17 2023 17:27:37", "cause-code": 37, "reason": "User initiated card reload" }, { "no": 5, "time": "May 17 2023 19:28:40", "cause-code": 37, "reason": "User initiated card reload" }, { "no": 4, "time": "May 17 2023 21:07:55", "cause-code": 37, "reason": "User initiated card reload" }, { "no": 3, "time": "May 18 2023 21:14:35", "cause-code": 37, "reason": "User initiated card reload" }, { "no": 2, "time": "May 18 2023 21:29:53", "cause-code": 37, "reason": "User initiated card reload" }, { "no": 1, "time": "Nov 09 2023 18:13:43", "cause-code": 36, "reason": "Install requested chassis reload" } ] } ] } ] } } |
If you want to go one level further and investigate the containers, the leaf, and the data structure of the leaf, you can either PYANG the data model (on a Linux subsystem) or read this data on GitHub for Vendor Cisco.
For this KPI/leaf, there are no possible values mentioned in the YANG model. The type of this leaf is “string”. You can use two bonus KPIs, “no” and “time,” to analyze the number of reboots and the time in which those reboots happened.
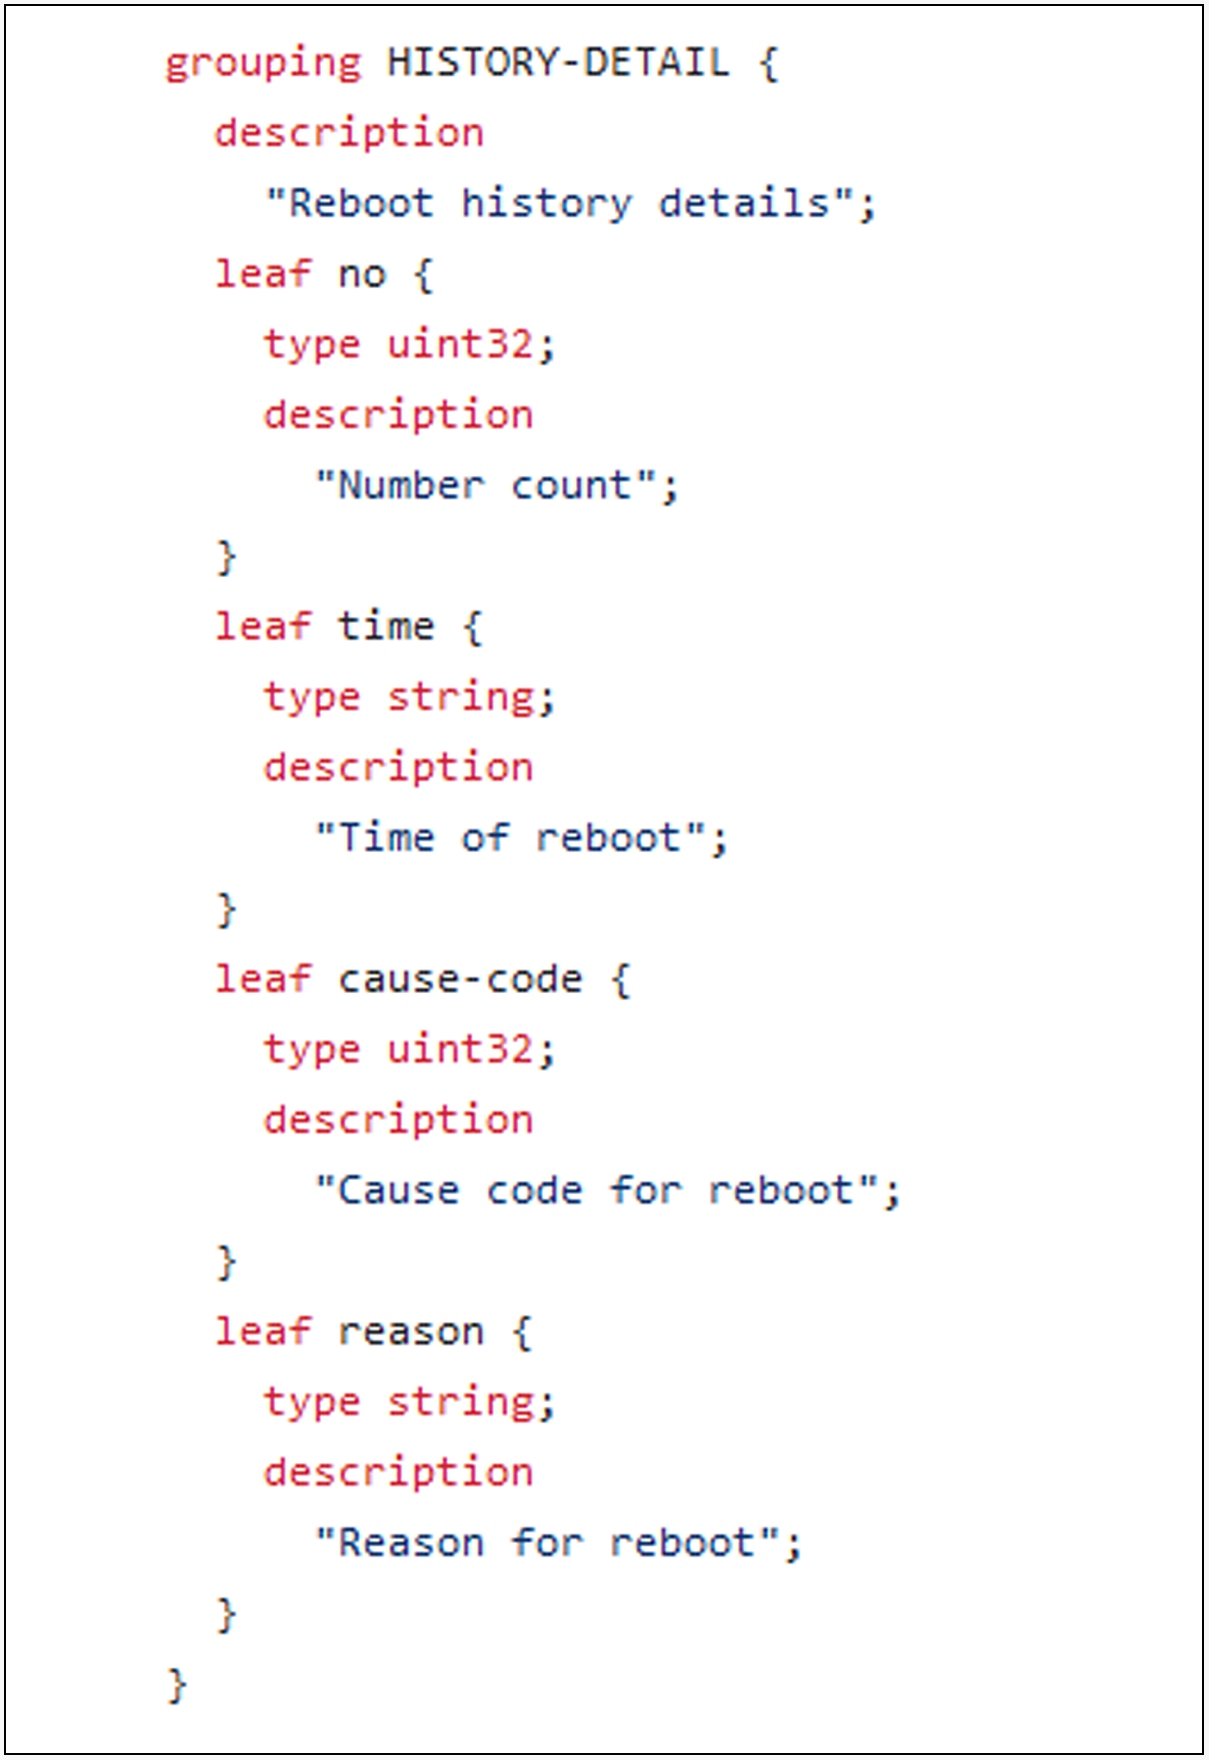
Leaf reason from GitHub
Active system alarms: This is a fault management KPI (with the sub-KPIs location, description, severity, status, set-time, and clear-time) often used to analysis the reason code behind active alarms (hardware faults) and their severity for the purpose of prioritizing the alarm.
The CLI command to display the active system alarms on the router is shown below:
| <<router>>#show alarms brief system active
------------------------------------------------------------------------------------ Active Alarms ------------------------------------------------------------------------------------ Location Severity Group Set Time Description
------------------------------------------------------------------------------------ 0/RP0/CPU0 Minor Software 01/21/2024 12:32:34 UTC Optics0/0/0/4 - hw_optics: RX POWER LANE-0 HIGH WARNING
0/RP0/CPU0 Minor Software 01/25/2024 22:08:07 UTC Optics0/0/0/9 - hw_optics: RX POWER LANE-0 HIGH WARNING |
The corresponding YANG model, sensor path and leaf that stores the value of the active system alarms KPI is shown below:
| <<router>>#yang-describe operational show alarms brief system active YANG Paths: Cisco-IOS-XR-alarmgr-server-oper:alarms/brief/brief-system/active |
The JSON data that is present in this model on a specific container leaf is shown below:
| <<router>>#show yang operational alarmgr-server-oper:alarms brief brief-system active JSON { "Cisco-IOS-XR-alarmgr-server-oper:alarms": { "brief": { "brief-system": { "active": { "alarm-info": [ { "location": "0/RP0/CPU0", "severity": "minor", "group": "software", "set-time": "01/21/2024 12:32:34 UTC", "set-timestamp": "1705840354", "clear-time": "-", "clear-timestamp": "0", "description": " Optics0/0/0/4 - hw_optics: RX POWER LANE-0 HIGH WARNING" }, { "location": "0/RP0/CPU0", "severity": "minor", "group": "software", "set-time": "01/25/2024 22:08:07 UTC", "set-timestamp": "1706220487", "clear-time": "-", "clear-timestamp": "0", "description": " Optics0/0/0/9 - hw_optics: RX POWER LANE-0 HIGH WARNING" } ] } } } } } |
If you want to go one level further and investigate the containers, the leaf, and the data structure of the leaf, you can either PYANG the data model (on a Linux subsystem) or read this data on GitHub for Vendor Cisco.
For this KPI/leaf, there are no possible values mentioned in the YANG model. The type of this leaf is “string”. You can look at the description, location, and aid sub-KPIs to identify and inspect the alarm.
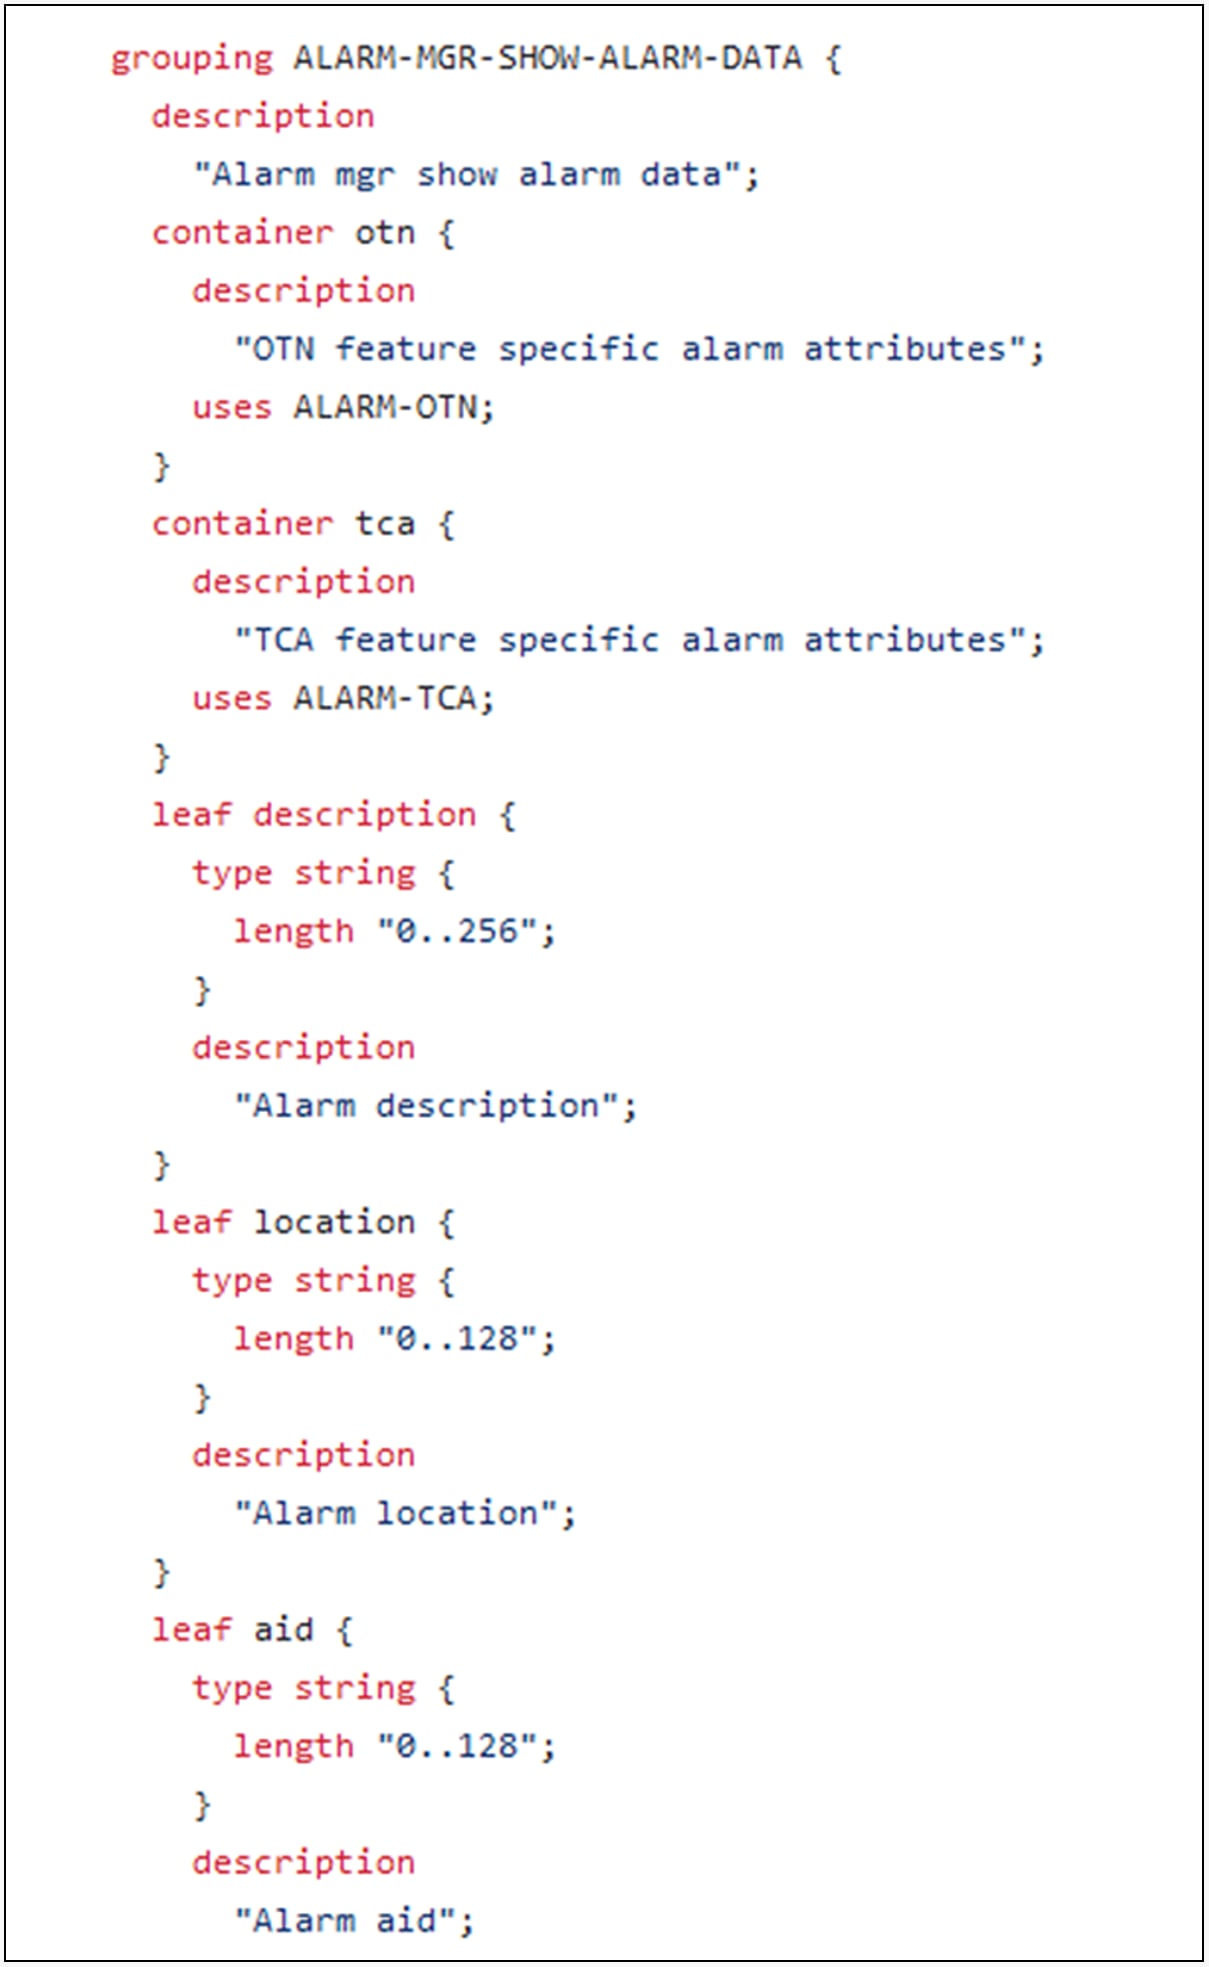
Leaf description and location from GitHub
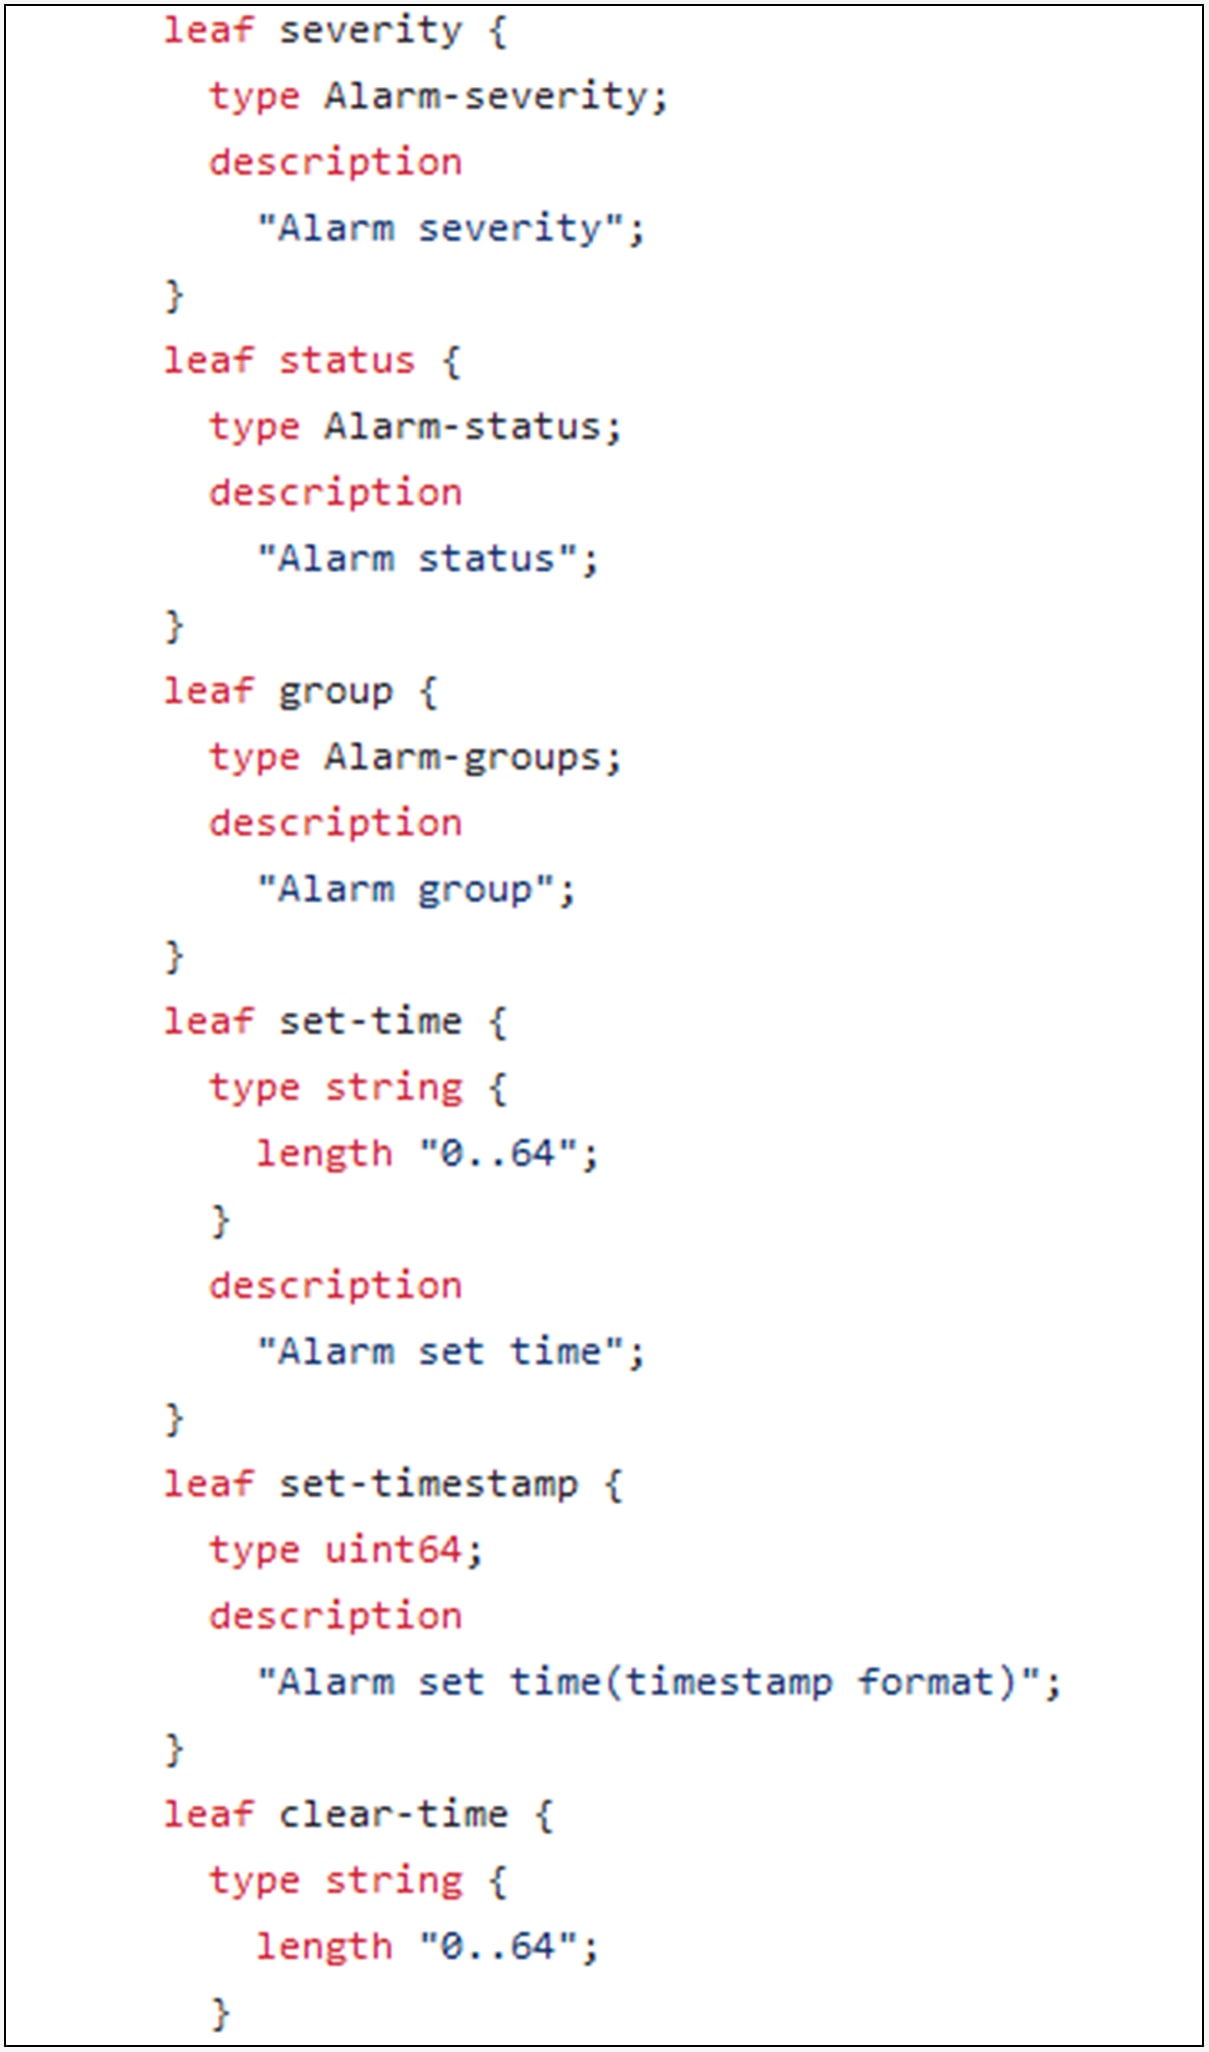
Leaf severity, status, set time, and clear time as shown on GitHub
Inventory list: This is another “accounting” KPI often used to analysis the network inventory for optics/SFPs deployed. No performance or fault management insights come from monitoring this KPI.
The CLI command to display the inventory list of the router is shown below:
| <<router>>#show inventory
NAME: "Rack 0", DESCR: "Cisco NCS 540 System with 16x10G+8x25G+2x100G DC Chassis" PID: N540X-16Z8Q2C-D , VID: V01, SN: FOC2614PD81
NAME: "0/RP0/CPU0", DESCR: "Cisco NCS 540 System with 16x10G+8x25G+2x100G DC Chassis" PID: N540X-16Z8Q2C-D , VID: V01, SN: FOC2612PBG5
NAME: "TenGigE0/0/0/9", DESCR: "Cisco SFP+ 10G LR Pluggable Optics Module" PID: SFP-10G-LR10-I , VID: V01, SN: ACW260814X4
NAME: "TenGigE0/0/0/13", DESCR: "Cisco SFP+ 10G CU3M Pluggable Optics Module" PID: SFP-H10GB-CU3M , VID: V03, SN: TED2618B0VU
NAME: "TenGigE0/0/0/14", DESCR: "Cisco SFP+ 10G CU3M Pluggable Optics Module" PID: SFP-H10GB-CU3M , VID: V03, SN: TED2618B0T6
NAME: "TenGigE0/0/0/15", DESCR: "Cisco SFP+ 10G CU3M Pluggable Optics Module" PID: SFP-H10GB-CU3M , VID: V03, SN: TED2618B33B
NAME: "GigabitEthernet0/0/0/16", DESCR: "Cisco SFP 1G 1000BASE-T Pluggable Optics Module" PID: GLC-TE , VID: V03, SN: ACW26034JE5
NAME: "GigabitEthernet0/0/0/17", DESCR: "Cisco SFP 1G 1000BASE-T Pluggable Optics Module" PID: GLC-TE , VID: V03, SN: ACW26030QHQ
NAME: "TenGigE0/0/0/18", DESCR: "Cisco SFP+ 10G CU3M Pluggable Optics Module" PID: SFP-H10GB-CU3M , VID: V03, SN: TED2618B0XQ
NAME: "TenGigE0/0/0/19", DESCR: "Cisco SFP+ 10G LR Pluggable Optics Module" PID: SFP-10G-LR-S , VID: V01, SN: ACW25240312
NAME: "TwentyFiveGigE0/0/0/24", DESCR: "Cisco SFP28 25G SR-S Pluggable Optics Module" PID: SFP-25G-SR-S , VID: V03, SN: FNS26100A5W
NAME: "TenGigE0/0/0/4", DESCR: "Cisco SFP+ 10G LR Pluggable Optics Module" PID: SFP-10G-LR-S , VID: V01, SN: ACW251715EM
NAME: "TenGigE0/0/0/5", DESCR: "Cisco SFP+ 10G LR Pluggable Optics Module" PID: SFP-10G-LR-S , VID: V01, SN: ACW251715EU
NAME: "TenGigE0/0/0/6", DESCR: "Cisco SFP+ 10G LR Pluggable Optics Module" PID: SFP-10G-LR-S , VID: V01, SN: ACW24442ZKJ
NAME: "TenGigE0/0/0/7", DESCR: "Cisco SFP+ 10G LR Pluggable Optics Module" PID: SFP-10G-LR-S , VID: V01, SN: ACW251715EN
NAME: "TenGigE0/0/0/8", DESCR: "Cisco SFP+ 10G LR Pluggable Optics Module" PID: SFP-10G-LR-S , VID: V01, SN: ACW24442ZKK
NAME: "0/FT0", DESCR: "Cisco NCS 540 Series N540X-16Z4G8Q2C-A/D Fantray" PID: N540-X-BB-FAN , VID: V01, SN: FOC2609P8X6
NAME: "0/PM0", DESCR: "NCS 540 PSU" PID: N540-PSU-FIXED-D , VID: N/A, SN: N/A
NAME: "0/PM1", DESCR: "NCS 540 PSU" PID: N540-PSU-FIXED-D , VID: N/A, SN: N/A |
The corresponding YANG model, sensor path and leaf that store the value of the inventory list KPI is shown below:
| <<router>>#yang-describe operational show inventory <<router>> |
As we didn’t get an output from the above command, we will go down the “old” path of looking at the schema and deriving the leaf and sensor from it.
| <<router>>#schema-describe show inventory Action: get_children Path: RootOper.Inventory.Rack
Action: get Path: RootOper.Inventory.Entities.Entity({'Name': 'fru_basic'}).Attributes.InvBasicBag
|
Now, to find the YANG model and the corresponding leaf and container, we will have to execute an intermediate step of using hints from the above schema to run through the YANG data model database and then run some pyang commands, as shown below:
| sounmukh@<<PYANG-TERMINAL>>$ pyang -f tree Cisco-IOS-XR-invmgr-oper.yang --tree-depth 6 --tree-path inventory/entities/entity/attributes/inv-basic-bag module: Cisco-IOS-XR-invmgr-oper +--ro inventory +--ro entities +--ro entity* [name] +--ro attributes +--ro inv-basic-bag +--ro description? string +--ro vendor-type? string +--ro name? string +--ro hardware-revision? string +--ro firmware-revision? string +--ro software-revision? string +--ro chip-hardware-revision? string +--ro serial-number? string +--ro manufacturer-name? string +--ro model-name? string +--ro asset-id-str? string +--ro asset-identification? int32 +--ro is-field-replaceable-unit? boolean +--ro manufacturer-asset-tags? int32 +--ro composite-class-code? int32 +--ro memory-size? int32 +--ro environmental-monitor-path? string +--ro alias? string +--ro group-flag? boolean +--ro new-deviation-number? int32 +--ro physical-layer-interface-module-type? int32 +--ro unrecognized-fru? boolean +--ro redundancystate? int32 +--ro ceport? boolean +--ro xr-scoped? boolean +--ro unique-id? int32 +--ro allocated-power? int32 +--ro power-capacity? int32 |
The above helped us with the data model and container that we need to look at, and the JSON data that is present in this model on the specific container “inv-basic-bag” is shown below:
| <<router>>#show yang operational invmgr-oper:inventory entities entity attributes inv-basic-bag JSON { "Cisco-IOS-XR-invmgr-oper:inventory": { "entities": { "entity": [ { "name": "Rack 0", "attributes": { "inv-basic-bag": { "description": "Cisco NCS 540 System with 16x10G+8x25G+2x100G DC Chassis", "vendor-type": "1.3.6.1.4.1.9.12.3.1.3.2510", "name": "Rack 0", "hardware-revision": "V01", "software-revision": "7.8.2", "chip-hardware-revision": "2.0", "serial-number": "FOC2614PD81", "model-name": "N540X-16Z8Q2C-D", "asset-id-str": "N/A", "is-field-replaceable-unit": true, "composite-class-code": 65536, "alias": "N/A", "unrecognized-fru": false, "unique-id": 8384513 } } },
/// Output truncated for brevity /// |
CPU utilization: This is a performance monitoring KPI often used to analyze the impact on the CPU of the system based on the performance of individual threads or daemons.
The CLI command to display the CPU utilization of all threads of the router is shown below:
| <<router>>#sh processes cpu thread sorted 5min ---- node0_RP0_CPU0 ----
CPU utilization for one minute: 3%; five minutes: 3%; fifteen minutes: 3%
TID 1Min 5Min 15Min Threads 1 0% 0% 0% init:init 2 0% 0% 0% kthreadd:kthreadd 3 0% 0% 0% ksoftirqd/0:ksoftirqd/0 5 0% 0% 0% kworker/0:0H:kworker/0:0H 7 0% 0% 0% rcu_sched:rcu_sched 8 0% 0% 0% rcu_bh:rcu_bh 9 0% 0% 0% migration/0:migration/0 10 0% 0% 0% lru-add-drain:lru-add-drain 11 0% 0% 0% watchdog/0:watchdog/0 12 0% 0% 0% cpuhp/0:cpuhp/0 13 0% 0% 0% cpuhp/1:cpuhp/1 14 0% 0% 0% watchdog/1:watchdog/1 15 0% 0% 0% migration/1:migration/1 16 0% 0% 0% ksoftirqd/1:ksoftirqd/1 18 0% 0% 0% kworker/1:0H:kworker/1:0H 19 0% 0% 0% cpuhp/2:cpuhp/2 20 0% 0% 0% watchdog/2:watchdog/2 21 0% 0% 0% migration/2:migration/2 22 0% 0% 0% ksoftirqd/2:ksoftirqd/2 24 0% 0% 0% kworker/2:0H:kworker/2:0H 25 0% 0% 0% cpuhp/3:cpuhp/3 26 0% 0% 0% watchdog/3:watchdog/3 27 0% 0% 0% migration/3:migration/3 28 0% 0% 0% ksoftirqd/3:ksoftirqd/3 30 0% 0% 0% kworker/3:0H:kworker/3:0H 31 0% 0% 0% cpuhp/4:cpuhp/4 32 0% 0% 0% watchdog/4:watchdog/4 33 0% 0% 0% migration/4:migration/4 34 0% 0% 0% ksoftirqd/4:ksoftirqd/4 36 0% 0% 0% kworker/4:0H:kworker/4:0H 37 0% 0% 0% cpuhp/5:cpuhp/5 38 0% 0% 0% watchdog/5:watchdog/5 39 0% 0% 0% migration/5:migration/5 40 0% 0% 0% ksoftirqd/5:ksoftirqd/5 42 0% 0% 0% kworker/5:0H:kworker/5:0H 43 0% 0% 0% cpuhp/6:cpuhp/6
/// Output truncated ///
25067 0% 0% 0% exec:exec 25068 0% 0% 0% exec:evm_signal_thre 25210 0% 0% 0% more:more 25214 0% 0% 0% more:lwm_service_thr 25215 0% 0% 0% more:qsm_service_thr 25217 0% 0% 0% more:more 25212 0% 0% 0% show_watchdog:show_watchdog 25216 0% 0% 0% show_watchdog:lwm_service_thr 25218 0% 0% 0% show_watchdog:qsm_service_thr 25219 0% 0% 0% show_watchdog:show_watchdog 28517 0% 0% 0% kworker/2:0:kworker/2:0 28519 0% 0% 0% kworker/1:1:kworker/1:1 |
The corresponding YANG model, sensor path, and Leaf that stores the value of the CPU utilization KPI is shown below:
| <<router>>#yang-describe operational sh processes cpu thread sorted 5min YANG Paths: Cisco-IOS-XR-wdsysmon-fd-oper:system-monitoring/cpu-utilization |
The JSON data that is present in this model on a specific container leaf is shown below:
| <<router>>#show yang operational wdsysmon-fd-oper:system-monitoring cpu-utilization total-cpu-five-minute JSON { "Cisco-IOS-XR-wdsysmon-fd-oper:system-monitoring": { "cpu-utilization": [ { "node-name": "0/RP0/CPU0", "total-cpu-five-minute": 4 } ] } } |
Now, if you want to take this one step further and explore what other CPU utilization KPIs you can monitor, you can study the model in tree form. You can monitor CPU utilization for processes and threads too.
| sounmukh@<<PYANG-DESKTOP>>$ pyang -f tree Cisco-IOS-XR-wdsysmon-fd-oper.yang --tree-depth 5 module: Cisco-IOS-XR-wdsysmon-fd-oper +--ro system-monitoring +--ro cpu-utilization* [node-name] +--ro node-name xr:Node-id +--ro total-cpu-one-minute? uint32 +--ro total-cpu-five-minute? uint32 +--ro total-cpu-fifteen-minute? uint32 +--ro process-cpu* [process-name process-id] +--ro process-name string +--ro process-id uint32 +--ro process-cpu-one-minute? uint32 +--ro process-cpu-five-minute? uint32 +--ro process-cpu-fifteen-minute? uint32 +--ro thread-cpu* [thread-name thread-id] +--ro thread-name string +--ro thread-id uint32 +--ro process-cpu-one-minute? uint32 +--ro process-cpu-five-minute? uint32 +--ro process-cpu-fifteen-minute? uint32 |
Does this work? We can test this out on a process like the Extensible Manageability Services Daemon (EMSD) (relevant to telemetry streaming) to validate the CPU utilization of this process and the underlying threads. The output below shows that the JSON data is present in the required data model.
| <<router>>#show yang operational wdsysmon-fd-oper:system-monitoring cpu-utilization process-cpu JSON | begin emsd "process-name": "emsd", "process-id": 12681, "process-cpu-one-minute": 0, "process-cpu-five-minute": 0, "process-cpu-fifteen-minute": 0, "thread-cpu": [ { "thread-name": "emsd", "thread-id": 671, "process-cpu-one-minute": 0, "process-cpu-five-minute": 0, "process-cpu-fifteen-minute": 0 }, { "thread-name": "emsd", "thread-id": 1593, "process-cpu-one-minute": 0, "process-cpu-five-minute": 0, "process-cpu-fifteen-minute": 0 }, { "thread-name": "emsd", "thread-id": 5345, "process-cpu-one-minute": 0, "process-cpu-five-minute": 0, "process-cpu-fifteen-minute": 0 }, /// Output truncated /// |
System memory: This is a performance monitoring KPI often used to monitor the system memory that is currently being used and how much is available for further use.
The CLI command to display the system memory of the router is shown below:
| <<router>>#show memory summary
node: node0_RP0_CPU0 ------------------------------------------------------------------
Physical Memory: 7429M total (2789M available) Application Memory : 7429M (2789M available) Image: 4M (bootram: 0M) Reserved: 0M, IOMem: 0M, flashfsys: 0M Total shared window: 592M |
The corresponding YANG model, sensor path, and leaf that stores the value of the system memory KPI is shown below:
| <<router>>#yang-describe operational show memory summary YANG Paths: Cisco-IOS-XR-nto-misc-oper:memory-summary/nodes/node/detail |
The JSON data that is present in this model on a specific container leaf is shown below:
| <<router>>#show yang operational nto-misc-oper:memory-summary nodes node detail JSON { "Cisco-IOS-XR-nto-misc-oper:memory-summary": { "nodes": { "node": [ { "node-name": "0/RP0/CPU0", "detail": { "page-size": 4096, "ram-memory": "7790800896", "free-physical-memory": "2873782272", "private-physical-memory": "0", "system-ram-memory": "7790800896", "free-application-memory": "2873782272", "image-memory": "4194304", "boot-ram-size": "0", "reserved-memory": "0", "io-memory": "0", "flash-system": "0",
/// Output truncated /// |
The data type of the KPI free-physical-memory is uint64, as shown below in our GitHub repository:
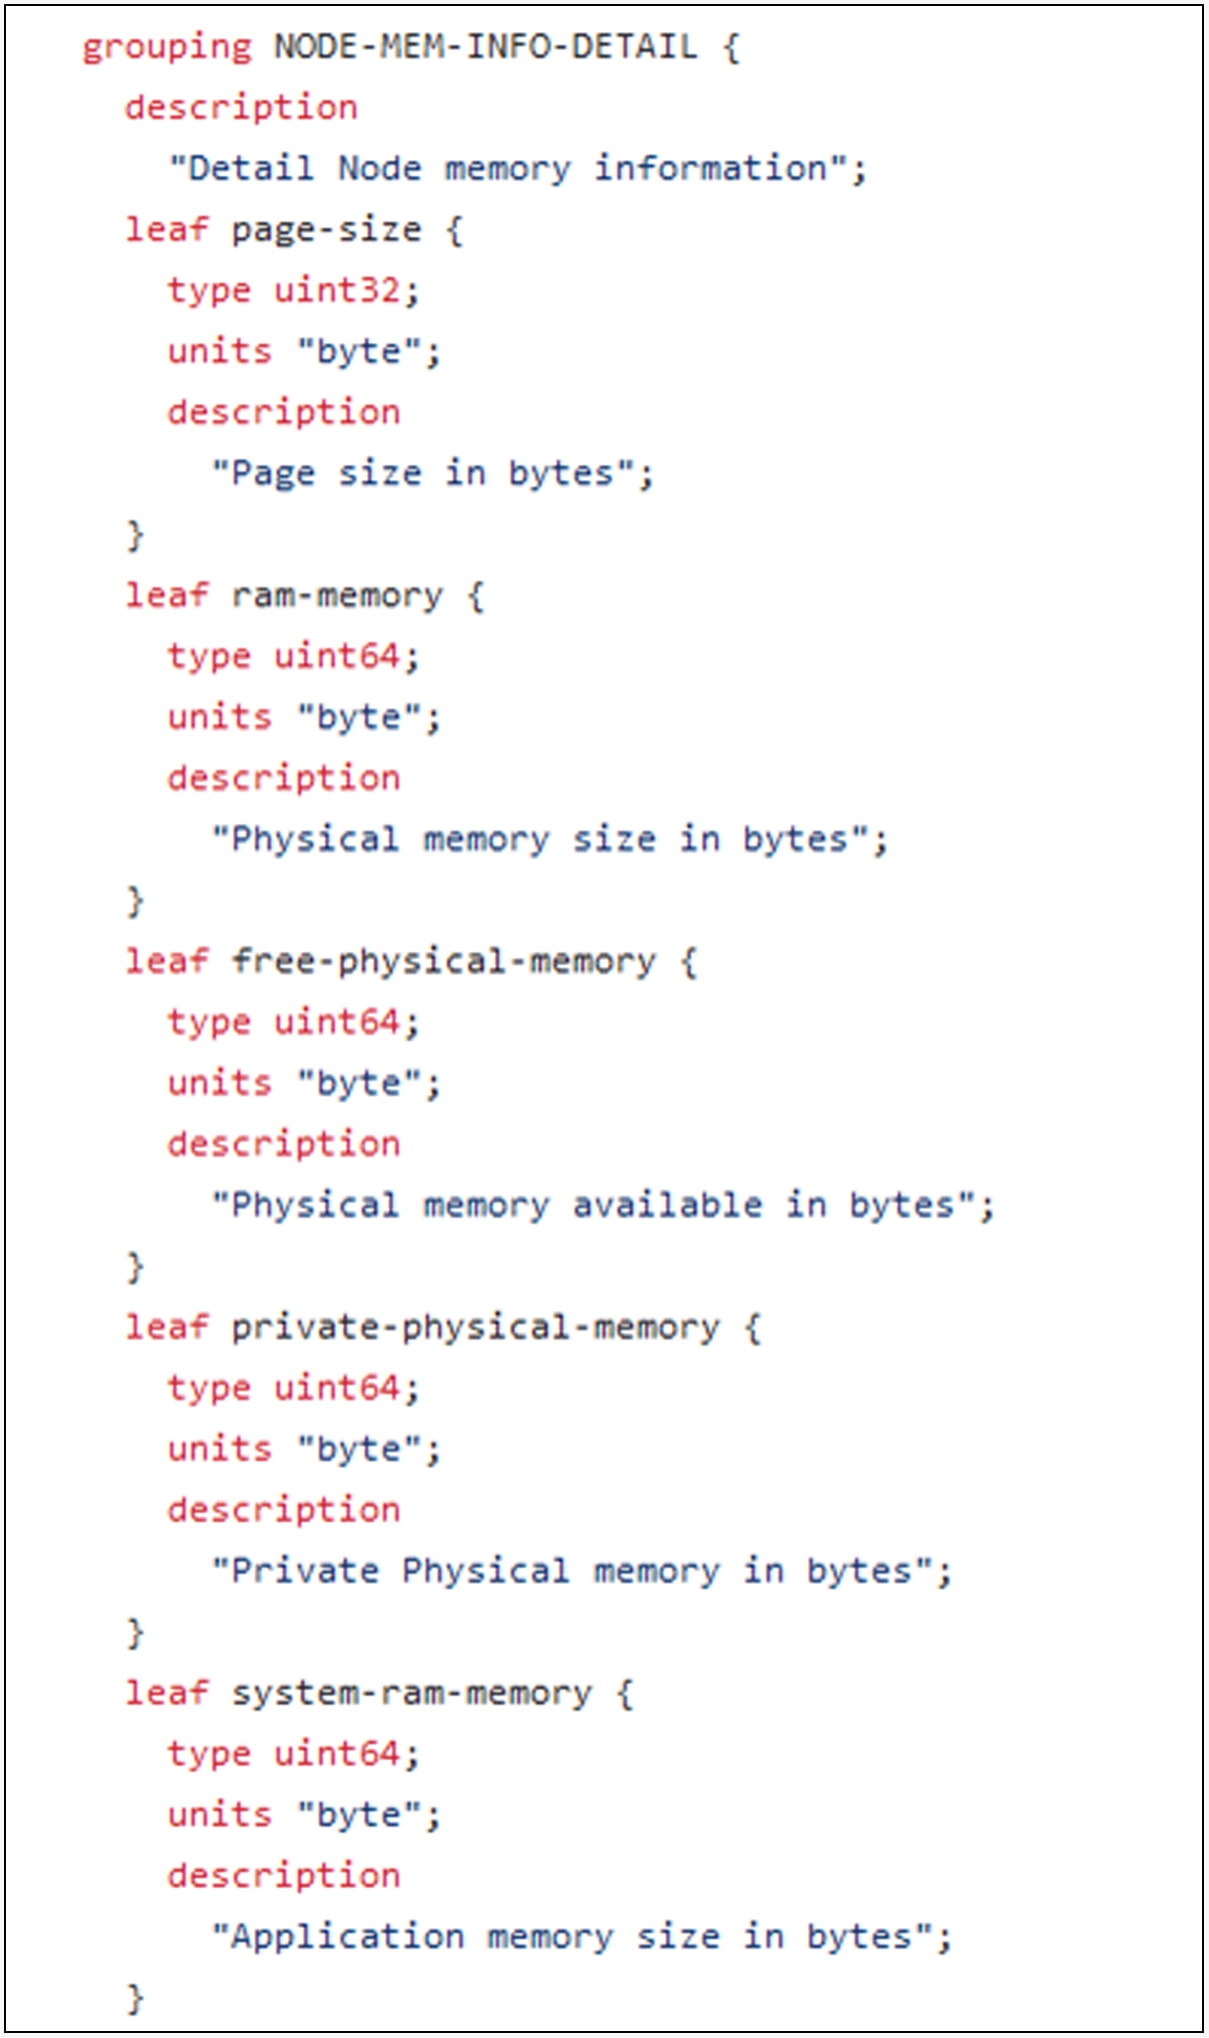
free-physical-memory type
2.2.3. Media storage utilization
Media storage utilization: This is a performance monitoring KPI often used to monitor the media storage and build thresholds on the media for reporting to the operations team.
The CLI command to display the media storage of the router is shown below:
| <<router>>#show media
Media Info for Location: node0_RP0_CPU0 Partition Size Used Percent Avail -------------------------------------------------------------------- rootfs: 15G 5.2G 35% 9.8G data: 10G 5.1G 51% 4.9G disk0: 925M 13M 2% 849M harddisk: 7.0G 3.7G 57% 2.9G log: 1.9G 392M 23% 1.4G |
The telemetry sensor can be derived using the command below against the above CLI command:
| <<router>>#yang-describe operational show media YANG Paths: Cisco-IOS-XR-mediasvr-linux-oper:media-svr/nodes/node/partition |
The JSON data that is present in this model is shown below:
| <<router>>show yang operational mediasvr-linux-oper:media-svr nodes node partition JSON { "Cisco-IOS-XR-mediasvr-linux-oper:media-svr": { "nodes": { "node": [ { "node": "0/RP0/CPU0", "partition": [ { "name": "rootfs:", "name-xr": "rootfs:", "size": "15G", "used": "5.2G", "percent": "35%", "avail": "9.8G" }, { "name": "data:", "name-xr": "data:", "size": "10G", "used": "5.1G", "percent": "51%", "avail": "4.9G" }, { "name": "disk0:", "name-xr": "disk0:", "size": "925M", "used": "13M", "percent": "2%", "avail": "849M" }, { "name": "harddisk:", "name-xr": "harddisk:", "size": "7.0G", "used": "3.7G", "percent": "57%", "avail": "2.9G" }, { "name": "log:", "name-xr": "log:", "size": "1.9G", "used": "392M", "percent": "23%", "avail": "1.4G" } ] } ] } } } |
NPU utilization ‒ LEM: This is a performance monitoring KPI often used to monitor and report resource outages for a specific network processing unit resource known as Large Exact Match (LEM).
The CLI command to display the LEM resource utilization at a cell site router is shown below:
| <<router>>#show controllers npu resources lem location 0/RP0/CPU0 HW Resource Information Name : lem Asic Type : QumranAX
NPU-0 OOR Summary Estimated Max Entries : 262144 Red Threshold : 95 % Yellow Threshold : 80 % OOR State : Green
Current Usage Total In-Use : 1259 (0 %) iproute : 726 (0 %) ip6route : 0 (0 %) mplslabel : 516 (0 %) l2brmac : 23 (0 %) |
The telemetry sensor can be derived using the command below against the above CLI command, but is this really our telemetry sensor?
| <<router>>#yang-describe operational show controllers npu resources lem location 0/RP0/CPU0 YANG Paths: Cisco-IOS-XR-NCS-BDplatforms-npu-resources-oper:hw-resources-datas/hw-resources-data |
The above output is quite interesting, as this is the first time, we will be looking at two data models in our telemetry sensor being used to pull specific data. These are known as augmented data models. If we deploy the above telemetry sensor, it won’t really fetch the data that we are looking for. We will have to augment from another data model for this purpose. The output from our YANG repository will further illustrate what I am talking about:
| sounmukh@<<PYANG-DESKTOP>>/yang/vendor/cisco/xr/782$ pyang -f tree Cisco-IOS-XR-NCS-BDplatforms-npu-resources-oper.yang --tree-depth 3 module: Cisco-IOS-XR-NCS-BDplatforms-npu-resources-oper
augment /a1:ofa/a1:stats/a1:nodes/a1:node: +--ro hw-resources-datas +--ro hw-resources-data* [resource] +--ro resource Resource +--ro resource-id? uint32 +--ro num-npus? uint32 +--ro cmd-invalid? boolean +--ro asic-type? uint32 +--ro asic-name? string +--ro npu-hwr* [] ... |
Now, let us look at this specific data model container hierarchy with the instructions provided in the above output:
| sounmukh@<<PYANG-DESKTOP ls -lrt | grep platforms-ofa -rwxrwxrwx 1 sounmukh sounmukh 1911 Oct 26 09:11 Cisco-IOS-XR-platforms-ofa-oper.yang -rwxrwxrwx 1 sounmukh sounmukh 8451 Oct 26 09:11 Cisco-IOS-XR-platforms-ofa-table-stats-oper-sub1.yang -rwxrwxrwx 1 sounmukh sounmukh 37735 Oct 26 09:11 Cisco-IOS-XR-platforms-ofa-table-stats-oper.yang
sounmukh@<<PYANG-DESKTOP>>yang/vendor/cisco/xr/782$ pyang -f tree Cisco-IOS-XR-platforms-ofa-oper.yang --tree-path ofa/stats/nodes/node --tree-depth 5 module: Cisco-IOS-XR-platforms-ofa-oper +--ro ofa +--ro stats +--ro nodes +--ro node* [node-name] +--ro node-name xr:Node-id |
We will combine both data models and build our telemetry sensor.
| Sensor Path: Cisco-IOS-XR-platforms-ofa-oper:ofa/stats/nodes/node/Cisco-IOS-XR-NCS-BDplatforms-npu-resources-oper:hw-resources-datas Sensor Path State: Resolved |
We will validate that data is being streamed for this sensor:
| <<router>>#run mdt_exec -s Cisco-IOS-XR-platforms-ofa-oper:ofa/stats/nodes/node/Cisco-IOS-XR-NCS-BDplatforms-npu-resources-oper:hw-resources-datas -c 10000 Enter any key to exit... Sub_id 200000001, flag 0, len 0 Sub_id 200000001, flag 4, len 52125 -------- {"node_id_str":"<<router>>","subscription_id_str":"app_TEST_200000001","encoding_path":"Cisco-IOS-XR-platforms-ofa-oper:ofa/stats/nodes/node/Cisco-IOS-XR-NCS-BDplatforms-npu-resources-oper:hw-resources-datas/hw-resources-data","collection_id":"1513068","collection_start_time":"1709144437978","msg_timestamp":"1709144437992","data_json":[{"timestamp":"1709144437988","keys":[{"node-name":"0/RP0/CPU0"},{"resource":"lem"}],"content":{"resource-id":0,"num-npus":1,"cmd-invalid":false,"asic-type":0,"asic-name":"QumranAX","npu-hwr":[{"npu-id":0,"red-oor-threshold-percent":0,"yellow-oor-threshold-percent":0,"num-bank":1,"bank":[{"is-bank-valid":true,"bank-id":0,"bank-name":"","bank-info":"","is-bank-info-valid":false,"counter":{"is-counter-valid":true,"is-max-valid":true,"max-entries":262144,"inuse-entries":1259},"oor-state":{"is-oor-valid":true,"red-oor-threshold":95,"yellow-oor-threshold":80,"oor-change-count":0,"oor-state-change-time1":"N/A","oor-state-change-time2":"N/A","oor-state":"Green"},"num-lt":4,"lt-hwr":[{"lt-id":50,"name":"iproute","hw-entries":726,"sw-
/// Output truncated for brevity /// |
NPU utilization ‒ LPM: This is a performance monitoring KPI often used to monitor and report resource outages for a specific network processing unit resource known as Longest Prefix Match (LPM).
The CLI command to display the LPM resource utilization at a cell site router is shown below:
| <<router>>#show controllers npu resources lpm location 0/RP0/CPU0 HW Resource Information Name : lpm Asic Type : QumranAX
NPU-0 OOR Summary Estimated Max Entries : 212490 Red Threshold : 95 % Yellow Threshold : 80 % OOR State : Green
Current Usage Total In-Use : 529 (0 %) iproute : 233 (0 %) ip6route : 280 (0 %) ipmcroute : 1 (0 %) ip6mcroute : 0 (0 %) ip6mc_comp_grp : 0 (0 %) |
The telemetry sensor, as outlined in Section 2.2.4, will be:
| Sensor Path: Cisco-IOS-XR-platforms-ofa-oper:ofa/stats/nodes/node/Cisco-IOS-XR-NCS-BDplatforms-npu-resources-oper:hw-resources-datas Sensor Path State: Resolved |
NPU utilization ‒ FEC: This is a performance monitoring KPI often used to monitor and report resource outages for a specific network processing unit resource known as Forwarding Equivalence Class (FEC).
The CLI command to display the FEC resource utilization at a cell site router is shown below:
| <<router>>#show controllers npu resources fec location 0/RP0/CPU0 HW Resource Information Name : fec Asic Type : QumranAX
NPU-0 OOR Summary Estimated Max Entries : 61440 Red Threshold : 95 % Yellow Threshold : 80 % OOR State : Green Bank Info : FEC
OFA Table Information (May not match HW usage) ipnhgroup : 723 ip6nhgroup : 49 edpl : 0 limd : 0 punt : 19 iptunneldecap : 0 ipmcroute : 1 ip6mcroute : 0 ipnh : 0 ip6nh : 0 mplsmdtbud : 0 ipvrf : 6 ippbr : 0 redirectvrf : 0 l2protect : 0 l2bridgeport : 25
Current Hardware Usage Name: fec Estimated Max Entries : 61440 Total In-Use : 823 (1 %) OOR State : Green Bank Info : FEC
Name: hier_0 Estimated Max Entries : 61440 Total In-Use : 823 (1 %) OOR State : Green Bank Info : FE
\\\ Output truncated for brevity \\\ |
The telemetry sensor, as outlined in Section 2.2.4, will be:
| Sensor Path: Cisco-IOS-XR-platforms-ofa-oper:ofa/stats/nodes/node/Cisco-IOS-XR-NCS-BDplatforms-npu-resources-oper:hw-resources-datas Sensor Path State: Resolved |
2.2.7. NPU utilization – ECMP_FEC
NPU utilization for ECMP_FEC prefixes: This is a performance monitoring KPI often used to monitor and report resource outages for a specific network processing unit resource known as Equal Cost Multipath ‒ Forwarding Equivalence Class (ECMP_FEC).
The CLI command to display the ECMP_FEC resource utilization at a cell site router is shown below:
| RP/0/RP0/CPU0:SDLAS00107C-CS000-CSR001#show controllers npu resources ecmpfec location 0/RP0/CPU0 Wed Feb 28 18:00:23.342 UTC HW Resource Information Name : ecmp_fec Asic Type : QumranAX
NPU-0 OOR Summary Estimated Max Entries : 4096 Red Threshold : 95 % Yellow Threshold : 80 % OOR State : Green Bank Info : ECMP
OFA Table Information (May not match HW usage) ipnhgroup : 9 ip6nhgroup : 1
Current Hardware Usage Name: ecmp_fec Estimated Max Entries : 4096 Total In-Use : 10 (0 %) OOR State : Green Bank Info : ECMP
Name: hier_0 Estimated Max Entries : 4096 Total In-Use : 10 OOR State : Green Bank Info : ECMP
\\\ Output truncated for brevity \\\ |
The telemetry sensor, as outlined in Section 2.2.4, will be:
| Sensor Path: Cisco-IOS-XR-platforms-ofa-oper:ofa/stats/nodes/node/Cisco-IOS-XR-NCS-BDplatforms-npu-resources-oper:hw-resources-datas Sensor Path State: Resolved |
2.2.8. NPU utilization ‒ Encap
NPU utilization ‒ Encap: This is a performance monitoring KPI often used to monitor and report resource outages for a specific network processing unit resource known as Encapsulation (Encap).
The CLI command to display the Encap resource utilization at a cell site router is shown below:
| RP/0/RP0/CPU0:SDLAS00107C-CS000-CSR001#show controllers npu resources encap location 0/RP0/CPU0 Wed Feb 28 18:01:38.767 UTC HW Resource Information Name : encap Asic Type : QumranAX NPU-0 OOR Summary Red Threshold : 95 % Yellow Threshold : 80 %
OFA Table Information (May not match HW usage) ipvrf : 0 redirectvrf : 0 macllnh : 6 mplsmdtbud : 0 llnh : 14 mplsnh : 502 iptunnelencap : 0 iptunneldecap : 0 limd : 0 ipmcmdtencap : 0 srv6nh : 0 ipmctxintf : 0 l2intf : 0 l2port : 0 mplspweport : 0 l2bridgeolist : 0
Current Hardware Usage Name: encap
Name: bank_0 Estimated Max Entries : 4096 Total In-Use : 18 (0 %) OOR State : Green Bank Info : phase=32 extended=no
Name: bank_1 Estimated Max Entries : 4096 Total In-Use : 41 (1 %) OOR State : Green Bank Info : phase=32 extended=protect
/// Output truncated for brevity ///
Name: bank_19 Estimated Max Entries : 4096 Total In-Use : 0 (0 %) OOR State : Green Bank Info : phase=0 extended=no |
The telemetry sensor, as outlined in Section 2.2.4, will be:
| Sensor Path: Cisco-IOS-XR-platforms-ofa-oper:ofa/stats/nodes/node/Cisco-IOS-XR-NCS-BDplatforms-npu-resources-oper:hw-resources-datas Sensor Path State: Resolved |
The “in-use entries” KPI for the Encap resource doesn’t exist at the “resource” level. The KPIs are distributed over 20 banks. So you will need to build a composite Encap resources in-use KPI by adding the resources used by all of the Encap banks.
Power output: This is a performance monitoring KPI and gives us information on the total power being consumed by all the hardware components of the router. This KPI can be monitored and trended even for energy optimization efforts at a cell site.
The CLI command to display the power output of the router is shown below:
| <<router>>#sh environment power ================================================================================ CHASSIS LEVEL POWER INFO: 0 ================================================================================ Total output power capacity : 300W Total output power required : 230W Total power input : N/A Total power output : 92W
================================================================================ Power Supply Status Module Type ================================================================================ 0/PM0 N540-PSU-FIXED-D OK 0/PM1 N540-PSU-FIXED-D OK |
The corresponding YANG model, sensor path, and leaf that stores the value of the power output KPI is shown below:
| <<router>>#yang-describe operational sh environment power YANG Paths: Cisco-IOS-XR-envmon-oper:power-management/rack/chassis Cisco-IOS-XR-envmon-oper:power-management/rack/producers/producer-nodes/producer-node |
The JSON data that is present in this model on the specific container leaf “total-pwr-output” is shown below:
| RP/0/RP0/CPU0:BOBOS00002B-CS000-CSR001#show yang operational envmon-oper:power-management rack chassis JSON Tue Feb 6 20:01:31.826 UTC { "Cisco-IOS-XR-envmon-oper:power-management": { "rack": [ { "name": "0", "chassis": { "total-pwr-required": 230, "grp-info": [ { "total-pwr-in": "0", "total-pwr-out": "0", "total-output-capacity": "0" }, { "total-pwr-in": "0", "total-pwr-out": "0", "total-output-capacity": "0" }, { "total-pwr-in": "0", "total-pwr-out": "0", "total-output-capacity": "0" } ], "red-mode": 0, "total-pe-ms": 2, "red-num-pe-ms": 0, "psu-non-fruable": 1, "total-out-capacity": 300, "total-pwr-output": 92, "total-pwr-input": 0 } } ] } } |
The data type of the KPI total-pwr-output is uint32, as shown below in our GitHub repository. This file is Cisco-IOS-XR-envmon-oper-sub1.yang, located at this link:
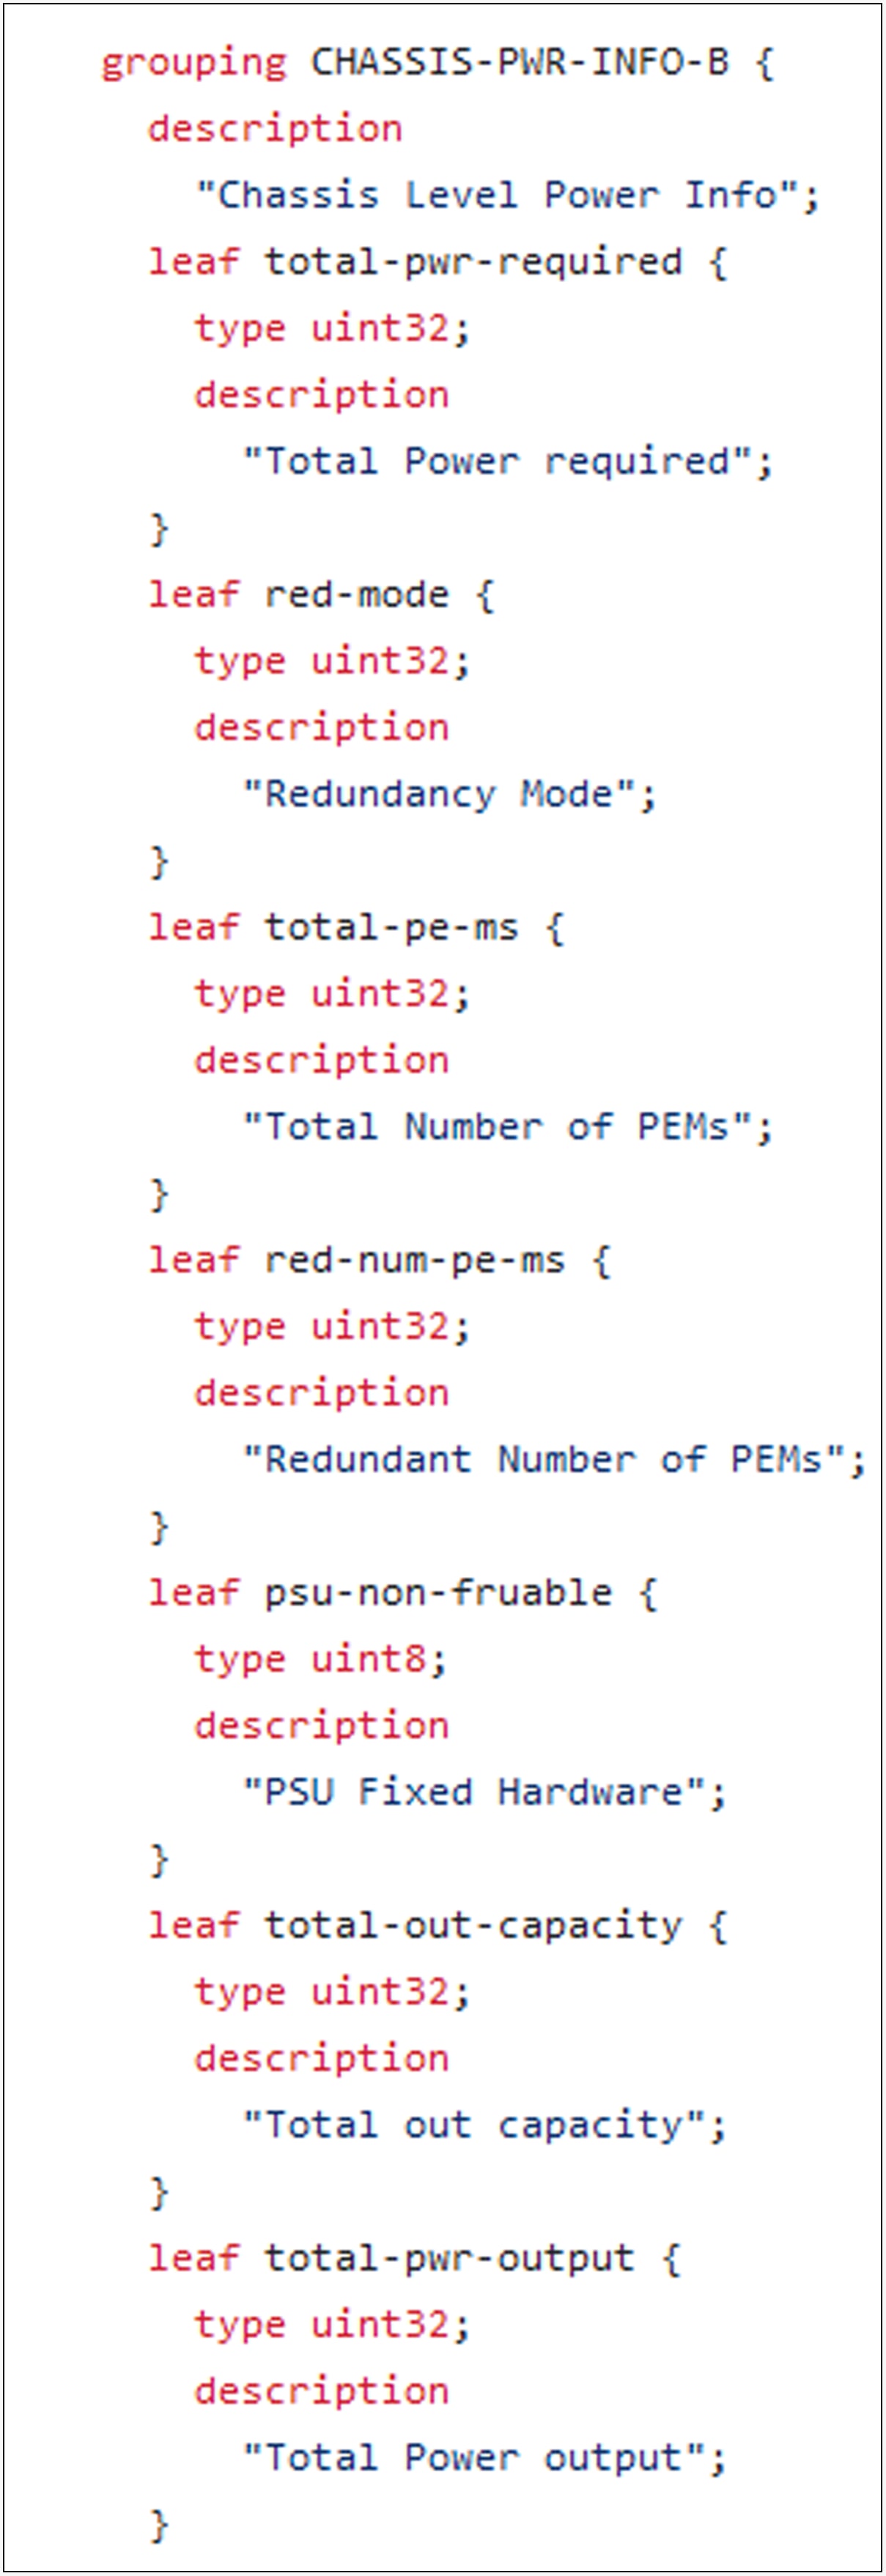
total-pwr-output type
Temperature: This is a performance monitoring KPI and gives us information on the temperature of all major hardware components in the cell site router. The value is in degrees Celsius (C), and critical, major, and minor thresholds are defined in the IOS XR code for both high and low temperatures.
The CLI command to display the temperature of all major hardware components of the router is shown below:
| <<router>>#show environment temperature ============================================================================================================= Location TEMPERATURE Value Crit Major Minor Minor Major Crit Sensor (deg C) (Lo) (Lo) (Lo) (Hi) (Hi) (Hi) ------------------------------------------------------------------------------------------------------------- 0/RP0/CPU0 X86_PACKAGE_TEMP_SENSOR 30 -40 -25 -10 85 89 91 X86_CORE_0_TEMP_SENSOR 29 -40 -25 -10 85 89 91 X86_CORE_1_TEMP_SENSOR 29 -40 -25 -10 85 89 91 X86_CORE_2_TEMP_SENSOR 26 -40 -25 -10 85 89 91 X86_CORE_3_TEMP_SENSOR 29 -40 -25 -10 85 89 91 X86_CORE_4_TEMP_SENSOR 30 -40 -25 -10 85 89 91 X86_CORE_5_TEMP_SENSOR 28 -40 -25 -10 85 89 91 X86_CORE_6_TEMP_SENSOR 28 -40 -25 -10 85 89 91 X86_CORE_7_TEMP_SENSOR 30 -40 -25 -10 85 89 91 MB-Inlet Temp Sensor 25 -40 -25 -10 65 70 75 P1V15_CPU_CORE_TEMP1 32 -40 -25 -10 85 89 91 P1V0_CPU_UNCORE_TEMP1 35 -40 -25 -10 85 89 91 P1V15_CPU_VCCRAM_TEMP1 32 -40 -25 -10 85 89 91 P1V2A_CPUDDR_TEMP1 30 -40 -25 -10 85 89 91 VP1P0_TEMP1 35 -40 -25 -10 85 89 91 P1V05_CPU_SRDS_TEMP1 31 -40 -25 -10 85 89 91 P3_3V_TEMP1 34 -40 -25 -10 85 89 91 P1V0B_QAX_TEMP1 34 -40 -25 -10 97 103 108 P1V0_QAX_CORE_TEMP1 36 -40 -25 -10 97 103 108 P1V2B_QAX_TEMP1 29 -40 -25 -10 97 103 108 MB-Outlet Temp Sensor 26 -40 -25 -10 68 73 78 MB-CPU Temp Sensor Local 33 -40 -25 -10 85 89 91 MB-CPU Temp Sensor Remote 31 -40 -25 -10 85 89 91 MB-QAX Temp Sensor Local 36 -40 -25 -10 97 103 108 MB-QAX Temp Sensor Remote 43 -40 -25 -10 97 103 108 MB-QAX In-Die Temp Sensor 42 -40 -25 -10 97 103 108 |
The corresponding YANG model, sensor path, and Leaf that stores the value of the temperature KPI is shown below:
| <<router>>#yang-describe operational show environment temperature <<router>> |
Now, since that output didn’t fetch any value, we will have to look at the schema:
| <<router>>#schema-describe show environment temperature Action: get_children Path: RootOper.EnvironmentalMonitoring
Action: get_children Path: RootOper.EnvironmentalMonitoring.Rack({'Name': '9abd6cf8'}).Node
Action: get Path: RootOper.EnvironmentalMonitoring.Rack({'Name': '9abd6cf8'}).Node({'node': '0/RP0/CPU0'}).SensorType({'Type': 'temperature'}) |
The above has given us some clue about the possible data model and the corresponding containers and leaf that will give us the data for temperature of the above sensor types.
Let us explore the data model now.
| sounmukh@<<YANG-DESKTOP>>yang/vendor/cisco/xr/781$ pyang -f tree Cisco-IOS-XR-envmon-oper.yang --tree-depth 9 --tree-path environmental-monitoring/rack/nodes module: Cisco-IOS-XR-envmon-oper +--ro environmental-monitoring +--ro rack* [name] +--ro nodes +--ro node* [node] +--ro sensor-types | +--ro sensor-type* [type] | +--ro sensor-names | | +--ro sensor-name* [name] | | +--ro name string | | +--ro sensor-value? int32 | | +--ro critical-low-threshold? int32 | | +--ro critical-high-threshold? int32 | | +--ro major-low-threshold? int32 | | +--ro major-high-threshold? int32 | | +--ro minor-low-threshold? int32 | | +--ro minor-high-threshold? int32 | | +--ro name-xr? string | | +--ro location? string | | +--ro fru-type? string | | +--ro status? uint32 | +--ro type xr:Cisco-ios-xr-string +--ro node xr:Node-id |
Now, even though we are aware of the container/leaf data structure, we still don’t know the exact name of the variable we need to define for sensor-type/sensor-name. The only way to get around this problem is to stream the data on the router. So let us do that.
The telemetry sensor, as deduced from the above, is Cisco-IOS-XR-envmon-oper:environmental-monitoring/rack/nodes/node/sensor-types/sensor-type/sensor-names/sensor-name.
| <<router>>#run mdt_exec -s Cisco-IOS-XR-envmon-oper:environmental-monitoring/rack/nodes/node/sensor-types/sensor-type/sensor-names/sensor-name -c 10000
{"node_id_str":"<<router>>","subscription_id_str":"app_TEST_200000001","encoding_path":"Cisco-IOS-XR-envmon-oper:environmental-monitoring/rack/nodes/node/sensor-types/sensor-type/sensor-names/sensor-name","collection_id":"399276","collection_start_time":"1707253351772","msg_timestamp":"1707253351803","data_json":[{"timestamp":"1707253351799","keys":[{"name":"0"},{"node":"0/RP0/CPU0"},{"type":"temperature"},{"name":"X86_PACKAGE_TEMP_SENSOR"}],"content":{"sensor-value":30,"critical-low-threshold":-40,"critical-high-threshold":91,"major-low-threshold":-25
/// Truncated Output /// |
After viewing the full JSON output in a code viewer, we can get the sensor name and value of our KPIs:
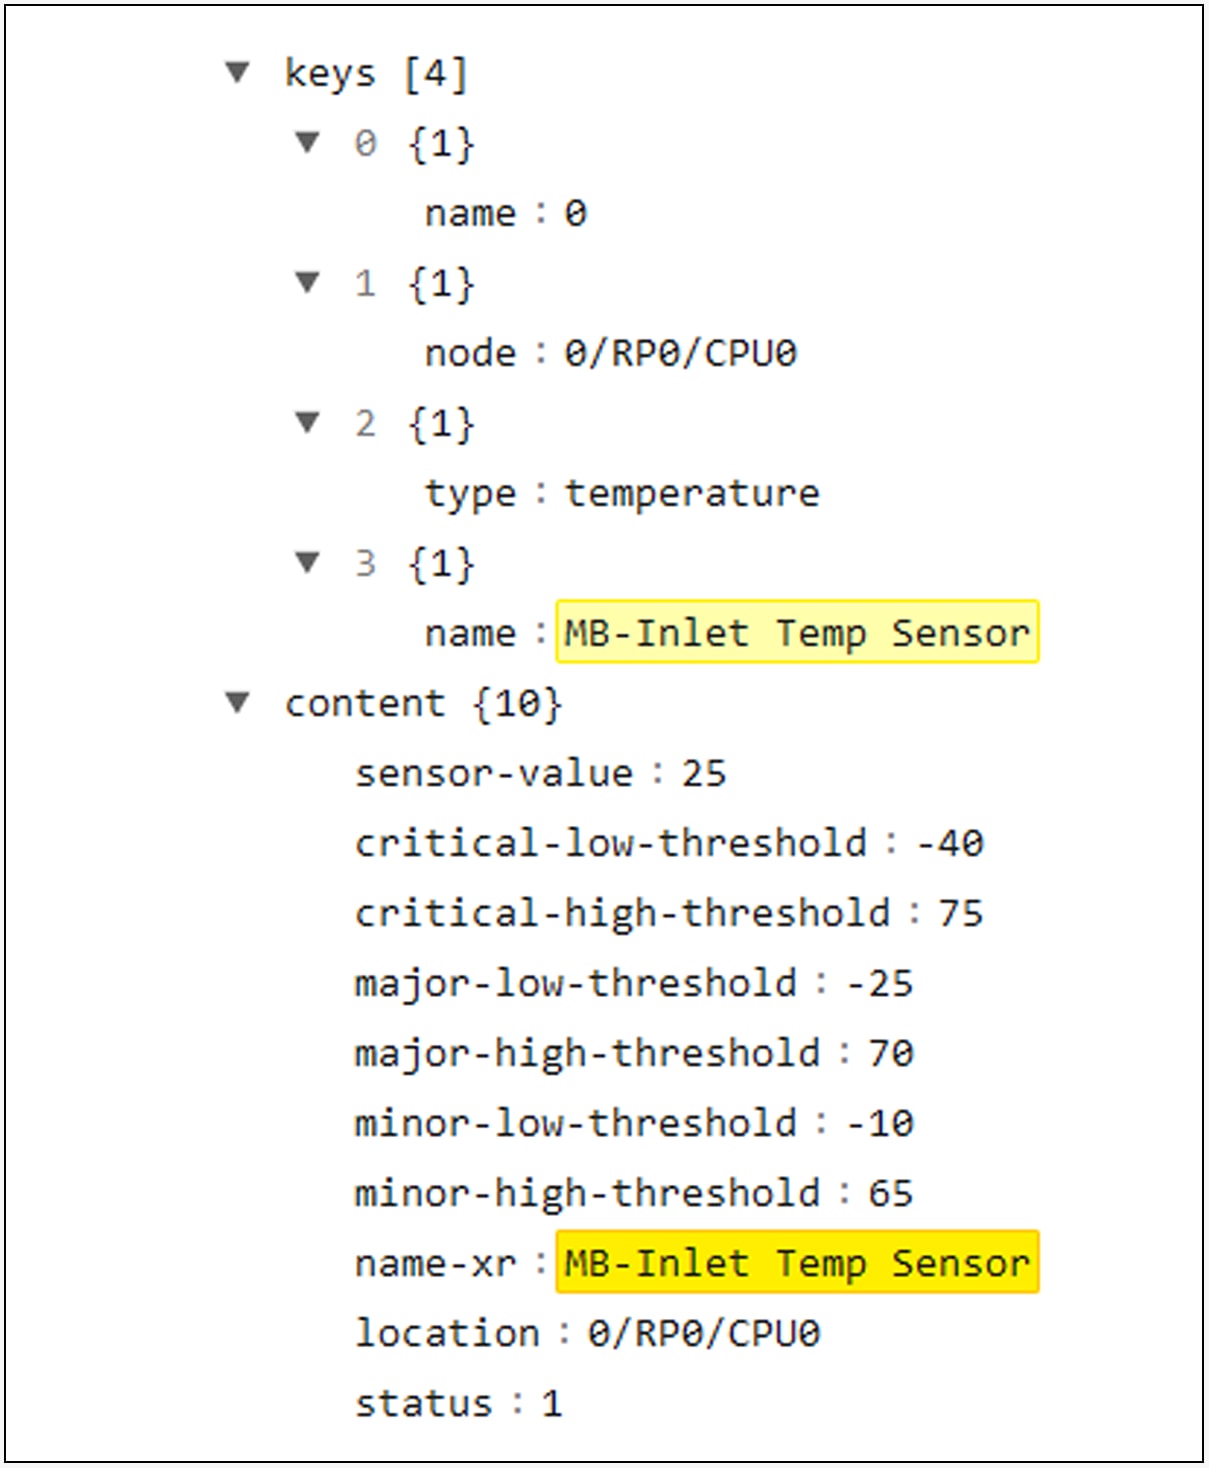
MB-Inlet Temp Sensor temperature

MB-Outlet Temp Sensor temperature
Let us redefine our telemetry sensors to the granular level of the two KPIs, based on the information above.
| <<router>>#run mdt_exec -s Cisco-IOS-XR-envmon-oper:environmental-monitoring/rack/nodes/node/sensor-types/sensor-type/sensor-names/sensor-name[name="MB-Inlet Temp Sensor”] -c 10000
-------- {"node_id_str":"<<router>>","subscription_id_str":"app_TEST_200000001","encoding_path":"Cisco-IOS-XR-envmon-oper:environmental-monitoring/rack/nodes/node/sensor-types/sensor-type/sensor-names/sensor-name","collection_id":"399297","collection_start_time":"1707253815429","msg_timestamp":"1707253815461","data_json":[{"timestamp":"1707253815459","keys":[{"name":"0"},{"node":"0/RP0/CPU0"},{"type":"temperature"},{"name":"MB-Inlet Temp Sensor"}],"content":{"sensor-value":25,"critical-low-threshold":-40,"critical-high-threshold":75,"major-low-threshold":-25,"major-high-threshold":70,"minor-low-threshold":-10,"minor-high-threshold":65,"name-xr":"MB-Inlet Temp Sensor","location":"0/RP0/CPU0","status":1}}],"collection_end_time":"1707253815560"} --------
<<router>>#run mdt_exec -s Cisco-IOS-XR-envmon-oper:environmental-monitoring/rack/nodes/node/sensor-types/sensor-type/sensor-names/sensor-name[name"MB-Outlet Temp Sensor”] -c 10000
-------- {"node_id_str":"<<router>>","subscription_id_str":"app_TEST_200000001","encoding_path":"Cisco-IOS-XR-envmon-oper:environmental-monitoring/rack/nodes/node/sensor-types/sensor-type/sensor-names/sensor-name","collection_id":"399298","collection_start_time":"1707253838080","msg_timestamp":"1707253838109","data_json":[{"timestamp":"1707253838107","keys":[{"name":"0"},{"node":"0/RP0/CPU0"},{"type":"temperature"},{"name":"MB-Outlet Temp Sensor"}],"content":{"sensor-value":26,"critical-low-threshold":-40,"critical-high-threshold":78,"major-low-threshold":-25,"major-high-threshold":73,"minor- low-threshold":-10,"minor-high-threshold":68,"name-xr":"MB-Outlet Temp Sensor","location":"0/RP0/CPU0","status":1}}],"collection_end_time":"1707253838206"} -------- |
Current: This is a performance monitoring KPI that gives us information on the total current being consumed by all the hardware components of the router. This KPI value is in mA.
The CLI command to display the current used by the major hardware components of a cell site router is shown below:
| <<router>>#show environment current ============================================================================================================= Location CURRENT Value Sensor (mA) ------------------------------------------------------------------------------------------------------------- 0/RP0/CPU0 ADM1275_Hotswap_controller_Iout 7977 P1V15_CPU_CORE_IIN 125 P1V15_CPU_CORE_IOUT 1250 P1V0_CPU_UNCORE_IIN 125 P1V0_CPU_UNCORE_IOUT 1750 P1V15_CPU_VCCRAM_IIN 0 P1V15_CPU_VCCRAM_IOUT 0 P1V2A_CPUDDR_IIN 62 P1V2A_CPUDDR_IOUT 500 VP1P0_IIN 1312 VP1P0_IOUT 14000 P1V05_CPU_SRDS_IIN 375 P1V05_CPU_SRDS_IOUT 4000 P3_3V_IIN 1562 P3_3V_IOUT 5500 P1V0B_QAX_IIN 468 P1V0B_QAX_IOUT 5000 P1V0_QAX_CORE_IIN 1750 P1V0_QAX_CORE_IOUT 17750 P1V2B_QAX_IIN 156 P1V2B_QAX_IOUT 1750 |
We can skip the next step, as we know that the “yang-describe” for this data model is not built into the IOS XR code. Let us look at the schema.
| <<router>>#schema-describe show environment current Action: get_children Path: RootOper.EnvironmentalMonitoring
Action: get_children Path: RootOper.EnvironmentalMonitoring.Rack({'Name': 'b4937cf8'}).Node
Action: get Path: RootOper.EnvironmentalMonitoring.Rack({'Name': 'b4937cf8'}).Node({'node': '0/RP0/CPU0'}).SensorType({'Type': 'current'}) |
The above has given us some clue about the possible data model and the corresponding containers and leaf that will give us the data for the current being used by each hardware component/sensor name.
Let us explore the data model now:
| sounmukh@<<PYANG-DESKTOP>>:~/yang/vendor/cisco/xr/781$ pyang -f tree Cisco-IOS-XR-envmon-oper.yang --tree-depth 9 --tree-path environmental-monitoring/rack/nodes module: Cisco-IOS-XR-envmon-oper +--ro environmental-monitoring +--ro rack* [name] +--ro nodes +--ro node* [node] +--ro sensor-types | +--ro sensor-type* [type] | +--ro sensor-names | | +--ro sensor-name* [name] | | +--ro name string | | +--ro sensor-value? int32 | | +--ro critical-low-threshold? int32 | | +--ro critical-high-threshold? int32 | | +--ro major-low-threshold? int32 | | +--ro major-high-threshold? int32 | | +--ro minor-low-threshold? int32 | | +--ro minor-high-threshold? int32 | | +--ro name-xr? string | | +--ro location? string | | +--ro fru-type? string | | +--ro status? uint32 | +--ro type xr:Cisco-ios-xr-string +--ro node xr:Node-id |
The sensor type here is “current,” as mentioned in the schema. So, the telemetry sensor to fetch this data is:
| <<router>>#run mdt_exec -s Cisco-IOS-XR-envmon-oper:environmental-monitoring/rack/nodes/node/sensor-types/sensor-type[type=current]/sensor-names/sensor-name $
-------- {"node_id_str":"<<router>>","subscription_id_str":"app_TEST_200000001","encoding_path":"Cisco-IOS-XR-envmon-oper:environmental-monitoring/rack/nodes/node/sensor-types/sensor-type/sensor-names/sensor-name","collection_id":"399319","collection_start_time":"1707254572757","msg_timestamp":"1707254572785","data_json":[{"timestamp":"1707254572781","keys":[{"name":"0"},{"node":"0/RP0/CPU0"},{"type":"current"},{"name":"ADM1275_Hotswap_controller_Iout"}],"content":{"sensor-value":7803,"critical-low-threshold":-32768,"critical-high-threshold":-32768,"major-low-threshold":-32768,"major-high-threshold":-32768,"minor-low-threshold":-32768,"minor-high-threshold":-32768,"name-xr":"ADM1275_Hotswap_controller_Iout","location":"0/RP0/CPU0","status":1}},{"timestamp":"1707254572781","keys":[{"name":"0"},{"node":"0/RP0/CPU0"},{"type":"current"},{"name":"P1V15_CPU_CORE_IIN/// Output truncated /// -------- |
You can monitor either all the sensor names or a few of them, like CPU and NPU (QAX), based on your requirements.
Voltage: This is a performance monitoring KPI that gives us information on the total voltage incurred by all the hardware components of the router. This KPI value is in mV. Critical and minor thresholds are defined in IOS XR code for each sensor name.
The CLI command to display the voltage of the major hardware components of a cell site router is shown below:
| <<router>>#show environment voltage ============================================================================================================= Location VOLTAGE Value Crit Minor Minor Crit Sensor (mV) (Lo) (Lo) (Hi) (Hi) ------------------------------------------------------------------------------------------------------------- 0/RP0/CPU0 ADM1266_VH1_12V 11939 10560 10800 13200 13440 ADM1266_VP6_1.24V 1238 1091 1116 1364 1389 ADM1266_VP7_1.0V 1042 880 900 1100 1120 ADM1266_VP8_1V 1005 880 900 1100 1120 ADM1266_VP9_1.2V 1204 1056 1080 1320 1344 ADM1266_VP10_1.25V 1248 1100 1125
/// Output omitted for brevity ///
11875 100 120 25000 25200 P1V2B_QAX_VOUT 1199 1056 1080 1320 1344 ADM1266_VP1_1.15V 880 632 644 1256 1323 ADM1266_VP2_1.0V 834 560 620 1200 1250 ADM1266_VP3_1.15V 946 667 713 1265 1288 ADM1266_VP4_1.2V 1204 1140 1164 1236 1260 ADM1266_VP5_1.05V 1051 924 945 1155 1176 |
We can follow the same steps as in Sections 2.3.2 and 2.3.3, as these KPIs belong to the same data model. The telemetry sensor for this KPI will be:
| <<router>>#run mdt_exec -s Cisco-IOS-XR-envmon-oper:environmental-monitoring/rack/nodes/node/sensor-types/sensor-type[type=voltage]/sensor-names/sensor-name
-------- {"node_id_str":"<<router>>","subscription_id_str":"app_TEST_200000001","encoding_path":"Cisco-IOS-XR-envmon-oper:environmental-monitoring/rack/nodes/node/sensor-types/sensor-type/sensor-names/sensor-name","collection_id":"399340","collection_start_time":"1707255066767","msg_timestamp":"1707255066797","data_json":[{"timestamp":"1707255066791","keys":[{"name":"0"},{"node":"0/RP0/CPU0"},{"type":"voltage"},{"name":"ADM1266_VH1_12V"}],"content":{"sensor-value":11939,"critical-low-threshold":10560,"critical-high-threshold":13440,"major-low-threshold":10680,"major-high-threshold":13320,"minor-low-threshold":10800,"minor-high-threshold":13200,"name-xr":"ADM1266_VH1_12V","location":"0/RP0/CPU0","status":1}},{"timestamp":"1707255066791","keys":[{"name":"0"},{"node":"0/RP0/CPU0"},{"type":"voltage"},{"name":"ADM1266_VP6_1.24V"}],"content":{"sensor-value":1238,"critical-low-threshold":1091,"critical-high-threshold":1389,"major-low-threshold":1103,"major-high-threshold":1376,"minor-low-threshold":1116,"minor-high-threshold":1364,"name-xr":"ADM1266_VP6_1.24V","location":"0/RP0/CPU0","status":1}},{"timestamp":"1707255066791","keys":[{"name":"0"},{"node":"0/RP0/CPU0"},{"type":"voltage"},{"name":"ADM1266_VP7_1.0V"}],"content":{"sensor-value":1042,"critical-low-threshold":880,"critical-high-threshold":1120,"major-low-threshold":890,"major-high-threshold":1110,"minor-low-threshold":900,"minor-high-threshold":1100,"name-xr
/// Output omitted for brevity ///
"name-xr":"ADM1266_VP3_1.15V","location":"0/RP0/CPU0","status":1}},{"timestamp":"1707255066791","keys":[{"name":"0"},{"node":"0/RP0/CPU0"},{"type":"voltage"},{"name":"ADM1266_VP4_1.2V"}],"content":{"sensor-value":1204,"critical-low-threshold":1140,"critical-high-threshold":1260,"major-low-threshold":1152,"major-high-threshold":1248,"minor-low-threshold":1164,"minor-high-threshold":1236,"name-xr":"ADM1266_VP4_1.2V","location":"0/RP0/CPU0","status":1}},{"timestamp":"1707255066791","keys":[{"name":"0"},{"node":"0/RP0/CPU0"},{"type":"voltage"},{"name":"ADM1266_VP5_1.05V"}],"content":{"sensor-value":1051,"critical-low-threshold":924,"critical-high-threshold":1176,"major-low-threshold":934,"major-high-threshold":1165,"minor-low-threshold":945,"minor-high-threshold":1155,"name-xr":"ADM1266_VP5_1.05V","location":"0/RP0/CPU0","status":1}}],"collection_end_time":"1707255066815"} -------- |
Fan speed: This is a performance monitoring KPI and the last environmental KPI that I will recommend enabling on your cell site router. The fan speed is a good indicator for the energy efficiency of a router. If we see a sudden spike in speed, that is a good indicator of increases in the heat/temperature of any hardware component due to various reasons. We can analyze and correlate all the environmental KPIs and come to a better conclusion.
The CLI command to display the fan speed of all five fans of a cell site router is shown below:
| <<router>>#show environment fan ======================================================================================================= Fan speed (rpm) Location FRU Type FAN_0 FAN_1 FAN_2 FAN_3 FAN_4 -------------------------------------------------------------------------------------------------------
0/FT0 N540-X-BB-FAN 13620 13620 13500 13560 13530 |
We can follow the same steps as in Sections 2.3.2, 2.3.3, and 2.3.4, as these KPIs belong to the same data model. The telemetry sensor for this KPI will be:
| <<router>>#run mdt_exec -s Cisco-IOS-XR-envmon-oper:environmental-monitoring/rack/nodes/node/sensor-types/sensor-type[type=fan]/sensor-names/sensor-name -c$
-------- {"node_id_str":"<<router>>","subscription_id_str":"app_TEST_200000001","encoding_path":"Cisco-IOS-XR-envmon-oper:environmental-monitoring/rack/nodes/node/sensor-types/sensor-type/sensor-names/sensor-name","collection_id":"399467","collection_start_time":"1707258233780","msg_timestamp":"1707258233824","data_json":[{"timestamp":"1707258233822","keys":[{"name":"0"},{"node":"0/FT0"},{"type":"fan"},{"name":"FAN_0 Speed"}],"content":{"sensor-value":13620,"critical-low-threshold":-32768,"critical-high-threshold":-32768,"major-low-threshold":-32768,"major-high-threshold":-32768,"minor-low-threshold":-32768
/// Output omitted for brevity ///
name":"FAN_4 Speed"}],"content":{"sensor-value":13530,"critical-low-threshold":-32768,"critical-high-threshold":-32768,"major-low-threshold":-32768,"major-high-threshold":-32768,"minor-low-threshold":-32768,"minor-high-threshold":-32768,"name-xr":"FAN_4 Speed","location":"0/FT0","fru-type":"N540-X-BB-FAN","status":1}}],"collection_end_time":"1707258233824"} |
Even though I have shown here telemetry sensors for each environmental KPI, you can use the generic sensor for all environmental KPIs (excluding power, which is in a different container):
| Cisco-IOS-XR-envmon-oper:environmental-monitoring/rack/nodes/node/sensor-types/sensor-type/sensor-names/sensor-name |
2.3.6. Optical health – laser state
Optical health ‒ laser state: This is a performance monitoring KPI used to monitor the laser state of the optics controller on the system.
The CLI command to display the laser state of the optics controller on the cell site router is shown below:
| <<router>>#show controllers optics 0/0/0/19
Controller State: Up
Transport Admin State: In Service
Laser State: On
LED State: Green
FEC State: FEC DISABLED
/// Output truncated for relevance /// |
The corresponding YANG model, sensor path, and leaf that stores the value of the laser state KPI can be built by getting clues from the commands below:
| <<router>> #yang-describe operational show controllers optics 0/0/0/19
<<router>> #schema-describe show controller optics 0/0/0/19 Wed Feb 28 20:36:56.832 UTC Action: get Path: RootOper.OpticsOper.OpticsPort({'Name': 'Optics0/0/0/19'}).OpticsInfo
<<router>> |
It is time to jump into our local YANG repository to try to map out the containers and leaf in a tree form:
| sounmukh@<<PYANG-DESKTOP>>/yang/vendor/cisco/xr/782$ ls -lrt | grep controller-optics -rwxrwxrwx 1 sounmukh sounmukh 24051 Oct 26 09:11 Cisco-IOS-XR-controller-optics-cfg.yang -rwxrwxrwx 1 sounmukh sounmukh 114443 Oct 26 09:11 Cisco-IOS-XR-controller-optics-oper-sub1.yang -rwxrwxrwx 1 sounmukh sounmukh 7409 Oct 26 09:11 Cisco-IOS-XR-controller-optics-oper.yang -rwxrwxrwx 1 sounmukh sounmukh 4676 Oct 26 09:11 Cisco-IOS-XR-osa-controller-optics-oper-sub1.yang -rwxrwxrwx 1 sounmukh sounmukh 2203 Oct 26 09:11 Cisco-IOS-XR-osa-controller-optics-oper.yang
sounmukh@<<PYANG-DESKTOP>>/yang/vendor/cisco/xr/782$ pyang -f tree Cisco-IOS-XR-controller-optics-oper.yang --tree-path optics-oper/optics-ports/optics-port/optics-info --tree-depth 5 module: Cisco-IOS-XR-controller-optics-oper +--ro optics-oper +--ro optics-ports +--ro optics-port* [name] +--ro optics-info +--ro network-srlg-info | ... +--ro optics-alarm-info | ... +--ro ots-alarm-info | ... +--ro transceiver-info | ...
/// Output truncated for brevity ///
string +--ro pm-enable? uint32 +--ro laser-state? Optics-laser-state +--ro modulation-type? Optics-modulation +--ro led-state? Optics-led-state +--ro controller-state? Optics-controller-state +--ro form-factor? Optics-form-factor |
This gives us a concrete idea about our telemetry sensor.
| Sensor Path: Cisco-IOS-XR-controller-optics-oper:optics-oper/optics-ports/optics-port/optics-info Sensor Path State: Resolved |
We will explore the value of this KPI/leaf in the data model on the system and validate it with our CLI command for the same optics controller KPI:
| <<router>>#show yang operational controller-optics-oper:optics-oper optics-ports optics-port optics-info laser-state JSON { "Cisco-IOS-XR-controller-optics-oper:optics-oper": { "optics-ports": { "optics-port": [ { "name": "Optics0/0/0/0", "optics-info": { "laser-state": "na" } }, { "name": "Optics0/0/0/1", "optics-info": { "laser-state": "na" } }, { "name": "Optics0/0/0/2", "optics-info": { "laser-state": "na" } },
/// Output truncated for brevity ///
"name": "Optics0/0/0/19", "optics-info": { "laser-state": "on" } }, { "name": "Optics0/0/0/20", "optics-info": { "laser-state": "off" } } |
2.3.7. Optical health – LED state
Optical health ‒ LED state: This is a performance monitoring KPI used to monitor the LED state of the optics controller on the system.
The CLI command to display the LED state of the optics controller on the cell site router is shown below:
| <<router>>#show controllers optics 0/0/0/19
Controller State: Up
Transport Admin State: In Service
Laser State: On
LED State: Green
FEC State: FEC DISABLED
/// Output truncated for relevance /// |
The telemetry sensor stays the same, as used in Section 2.3.6, so let us explore the value of our KPI in the data model and validate it with our CLI command for the same optics controller:
| <<router>>#show yang operational controller-optics-oper:optics-oper optics-ports optics-port optics-info led-state JSON { "Cisco-IOS-XR-controller-optics-oper:optics-oper": { "optics-ports": { "optics-port": [ { "name": "Optics0/0/0/0", "optics-info": { "led-state": "na" } }, { "name": "Optics0/0/0/1", "optics-info": { "led-state": "na" } },
/// Output truncated for brevity ///
{ "name": "Optics0/0/0/19", "optics-info": { "led-state": "green-on" } }, { "name": "Optics0/0/0/24", "optics-info": { "led-state": "green-on" } } ] } } } |
2.3.8. Optical health – controller state
Optical health ‒ controller state: This is a performance monitoring KPI used to monitor the state of the optics controller on the system.
The CLI command to display the state of the optics controller on the cell site router is shown below:
| <<router>>#show controllers optics 0/0/0/19
Controller State: Up
Transport Admin State: In Service
Laser State: On
LED State: Green
FEC State: FEC DISABLED
/// Output truncated for relevance /// |
The telemetry sensor stays the same, as used in Section 2.3.6, so let us explore the value of our KPI in the data model and validate it with our CLI command for the same optics controller:
| <<router>># show yang operational controller-optics-oper:optics-oper optics-ports optics-port optics-info controller-state JSON { "Cisco-IOS-XR-controller-optics-oper:optics-oper": { "optics-ports": { "optics-port": [ { "name": "Optics0/0/0/0", "optics-info": { "controller-state": "optics-state-up" } }, { "name": "Optics0/0/0/1", "optics-info": { "controller-state": "optics-state-up" } },
/// Output truncated for brevity ///
"name": "Optics0/0/0/19", "optics-info": { "controller-state": "optics-state-up" } }, { "name": "Optics0/0/0/20", "optics-info": { "controller-state": "optics-state-down" } }, |
2.3.9. Optical health – transmit power
Optical health ‒ transmit power: This is a performance monitoring KPI used to monitor the transmit power of the optics controller on the system.
The CLI command to display the transmit power of the optics controller on the cell site router is shown below:
| <<router>>#show controllers optics 0/0/0/19
Controller State: Up
/// Output truncated for relevance ///
Optics Status
Optics Type: SFP+ 10G LR Wavelength = 1310.00 nm
Alarm Status: ------------- Detected Alarms: None
LOS/LOL/Fault Status:
Laser Bias Current = 29.8 mA Actual TX Power = -2.51 dBm RX Power = -2.32 dBm |
The telemetry sensor is slightly different from the one in Section 2.3.6, as we will get the optics status information from the optics-lane container rather than the optics-info one.
| Sensor Group Id:GNMI__3047795260018525609_20 Sensor Path: Cisco-IOS-XR-controller-optics-oper:optics-oper/optics-ports/optics-port/optics-lanes Sensor Path State: Resolved |
Let us quickly validate the CLI command data with the JSON data residing in the relevant data model/container hierarchy:
| RP/0/RP0/CPU0:CLCLT00001A-CS000-CSR001#show yang operational controller-optics-oper:optics-oper optics-ports optics-port optics-lanes optics-lane transmit-power JSON Wed Feb 28 20:59:37.495 UTC { "Cisco-IOS-XR-controller-optics-oper:optics-oper": { "optics-ports": { "optics-port": [ { "name": "Optics0/0/0/4", "optics-lanes": { "optics-lane": [ { "number": 0, "transmit-power": -234 } ] } },
/// Output truncated for brevity ///
"name": "Optics0/0/0/19", "optics-lanes": { "optics-lane": [ { "number": 0, "transmit-power": -251 } ] } }, |
Somehow, the two values don’t really match, so we will have to explore the data type of this KPI. Let us jump into Cisco’s YANG explorer.
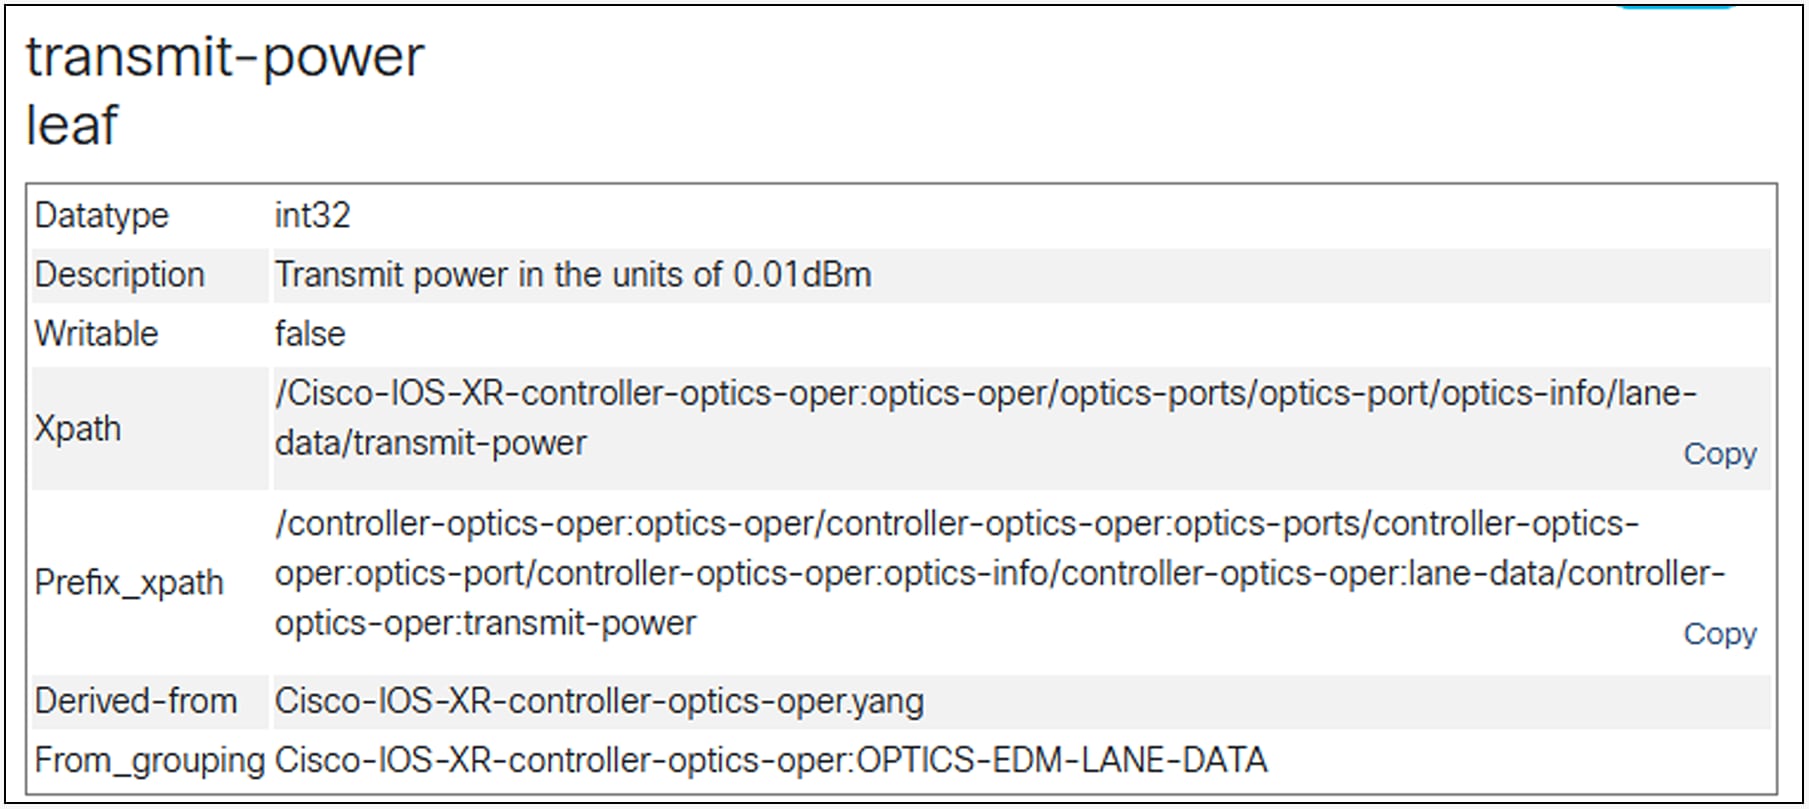
Data type for transmit-power
It clearly mentions that the transmit power is in 0.01 dBm on the data model. So the actual data is -2.51 decibel-milliwatts.
2.3.10. Optical health – receive power
Optical health ‒ receive power: This is a performance monitoring KPI used to monitor the receive power of the optics controller on the system.
The CLI command to display the receive power of the optics controller on the cell site router is shown below:
| <<router>>#show controllers optics 0/0/0/19
Controller State: Up
/// Output truncated for relevance ///
Optics Status
Optics Type: SFP+ 10G LR Wavelength = 1310.00 nm
Alarm Status: ------------- Detected Alarms: None
LOS/LOL/Fault Status:
Laser Bias Current = 29.8 mA Actual TX Power = -2.51 dBm RX Power = -2.32 dBm
|
The telemetry sensor is the same as in Section 2.3.9, and the JSON variable/leaf/KPI is receive-power:
| Sensor Group Id:GNMI__3047795260018525609_20 Sensor Path: Cisco-IOS-XR-controller-optics-oper:optics-oper/optics-ports/optics-port/optics-lanes Sensor Path State: Resolved
<<router>>#show yang operational controller-optics-oper:optics-oper optics-ports optics-port optics-lanes optics-lane ? JSON Output in JSON format. XML Output in XML format. dac-rate description frequency-offset frequency100mhz lane-alarm-info lane-index laser-age laser-bias-current-milli-amps laser-bias-current-percent laser-temperature number output-frequency receive-power receive-powerm-w receive-signal-power transmit-power transmit-powerm-w transmit-signal-power | Output Modifiers <cr> |
2.3.11. Optical health – laser bias current
Optical health ‒ laser bias current: This is a performance monitoring KPI used to monitor the laser bias current of the optics controller on the system.
The CLI command to display the laser bias current of the optics controller on the cell site router is shown below:
| <<router>>#show controllers optics 0/0/0/19
Controller State: Up
/// Output truncated for relevance ///
Optics Status
Optics Type: SFP+ 10G LR Wavelength = 1310.00 nm
Alarm Status: ------------- Detected Alarms: None
LOS/LOL/Fault Status:
Laser Bias Current = 29.8 mA Actual TX Power = -2.51 dBm RX Power = -2.32 dBm |
The telemetry sensor is the same as in Section 2.3.9, and the JSON variable/leaf/KPI is receive-power:
| Sensor Group Id:GNMI__3047795260018525609_20 Sensor Path: Cisco-IOS-XR-controller-optics-oper:optics-oper/optics-ports/optics-port/optics-lanes Sensor Path State: Resolved
<<router>>#show yang operational controller-optics-oper:optics-oper optics-ports optics-port optics-lanes optics-lane ? JSON Output in JSON format. XML Output in XML format. dac-rate description frequency-offset frequency100mhz lane-alarm-info lane-index laser-age laser-bias-current-milli-amps laser-bias-current-percent laser-temperature number output-frequency receive-power receive-powerm-w receive-signal-power transmit-power transmit-powerm-w transmit-signal-power | Output Modifiers <cr> |
This KPI indicates how much current the optics controller requires to maintain a laser (GREEN) at expected output levels.
2.4.1. GNSS receiver lock status
GNSS receiver lock status: This is a performance monitoring KPI and is essential for timing and synchronization at a cell site. The Timing port of the cell site router is connected to a GPS antenna, and this KPI gives the status of that clock feed in phase, frequency, and time.
The CLI command to display the GNSS receiver lock status of a cell site router is shown below:
| <<router>>#show gnss-receiver GNSS-receiver 0 location 0/RP0/CPU0 Status: Available, Up Position: 35:30.60 N -97:45.68 W 0.373km Time: 2024:02:07 02:36:18 (UTC offset: 0s) Locked at: 2024:02:07 02:36:15 Firmware version: TIM 1.10 Lock Status: Phase Locked, Receiver Mode: Time fix only Survey Progress: 100, Holdover Duration: Unknown Major Alarms: None Minor Alarms: None Anti-jam: Enabled, Cable-delay compensation: 0 1PPS polarity: Positive PDOP: 99.990, HDOP: 99.990, VDOP: 99.990, TDOP: 0.350 Constellation: GPS, Satellite Count: 8 Satellite Thresholds: SNR - 0 dB-Hz, Elevation - 0 degrees, PDOP - 0, TRAIM - 0 us Satellite Info: CHN: Channel, AQUN: Aquisition, EPH: Ephemeris PRN CHN AQUN EPH SV Signal No. No. Flag Flag Type Strength Elevat'n Azimuth --- --- ---- ---- ----------- -------- -------- -------- 5 n/a On On GPS 50.000 66.000 193.000 6 n/a On On GPS 34.000 14.000 64.000 11 n/a On On GPS 41.000 45.000 47.000 12 n/a On On GPS 51.000 50.000 209.000 13 n/a On On GPS 40.000 6.000 147.000 20 n/a On On GPS 45.000 68.000 55.000 25 n/a On On GPS 49.000 49.000 266.000 29 n/a On On GPS 48.000 32.000 313.000 |
Let us look at the YANG model, container, and leaf using the yang-describe command:
| <<router>>#yang-describe operational show gnss-receiver <<router>># |
As this command didn’t fetch an output, we will try out the schema for gnss-receiver.
| <<router>>#schema-describe show gnss-receiver Action: get_children Path: RootOper.GNSSReceiver.Node
Action: get Path: RootOper.GNSSReceiver.Node({'Node': '0/RP0/CPU0'}).Receiver |
With the clues provided in the above output, we will try to search for the data model in our GIT repository (locally downloaded) and build our container/leaf hierarchy to derive the telemetry sensor.
| sounmukh@<<PYANG-DESKTOP>>:~/yang/vendor/cisco/xr/781$ ls -lrt | grep gnss -rwxrwxrwx 1 sounmukh sounmukh 7774 Oct 26 09:11 Cisco-IOS-XR-gnss-cfg.yang -rwxrwxrwx 1 sounmukh sounmukh 10814 Oct 26 09:11 Cisco-IOS-XR-gnss-oper-sub1.yang -rwxrwxrwx 1 sounmukh sounmukh 2391 Oct 26 09:11 Cisco-IOS-XR-gnss-oper.yang -rwxrwxrwx 1 sounmukh sounmukh 18221 Oct 26 09:11 Cisco-IOS-XR-um-gnss-receiver-cfg.yang
sounmukh@<<PYANG-DESKTOP>>:~/yang/vendor/cisco/xr/781$ pyang -f tree Cisco-IOS-XR-gnss-oper.yang --tree-depth 6 module: Cisco-IOS-XR-gnss-oper +--ro gnss-receiver +--ro nodes +--ro node* [node] +--ro receivers | +--ro receiver* [number] | +--ro number uint32 | +--ro receiver-number? uint32 | +--ro node? xr:Node-id | +--ro enabled? boolean | +--ro shutdown? boolean | +--ro anti-jam-disable? boolean | +--ro constellation? Gnssmgr-bag-constellation | +--ro snr-threshold? uint32 | +--ro elevation-threshold? uint32 | +--ro pdop-threshold? uint32 | +--ro traim-threshold? uint32 | +--ro cable-delay-compensation? int32 | +--ro polarity1pps? Gnssmgr-bag-1pps-polarity | +--ro available? boolean | +--ro lock-status? Gnssmgr-bag-lock-status | +--ro receiver-mode? Gnssmgr-bag-rx-mode /// Output truncated /// |
With the help from the above, we can build the telemetry sensor:
| Cisco-IOS-XR-gnss-oper:gnss-receiver/nodes/node/receivers/receiver |
Now, to implement this KPI (and build an anomaly detection logic) on our monitoring solution, we need to know the possible values of this “lock-status” KPI. Let us look at the YANG model in GitHub to get our answers.
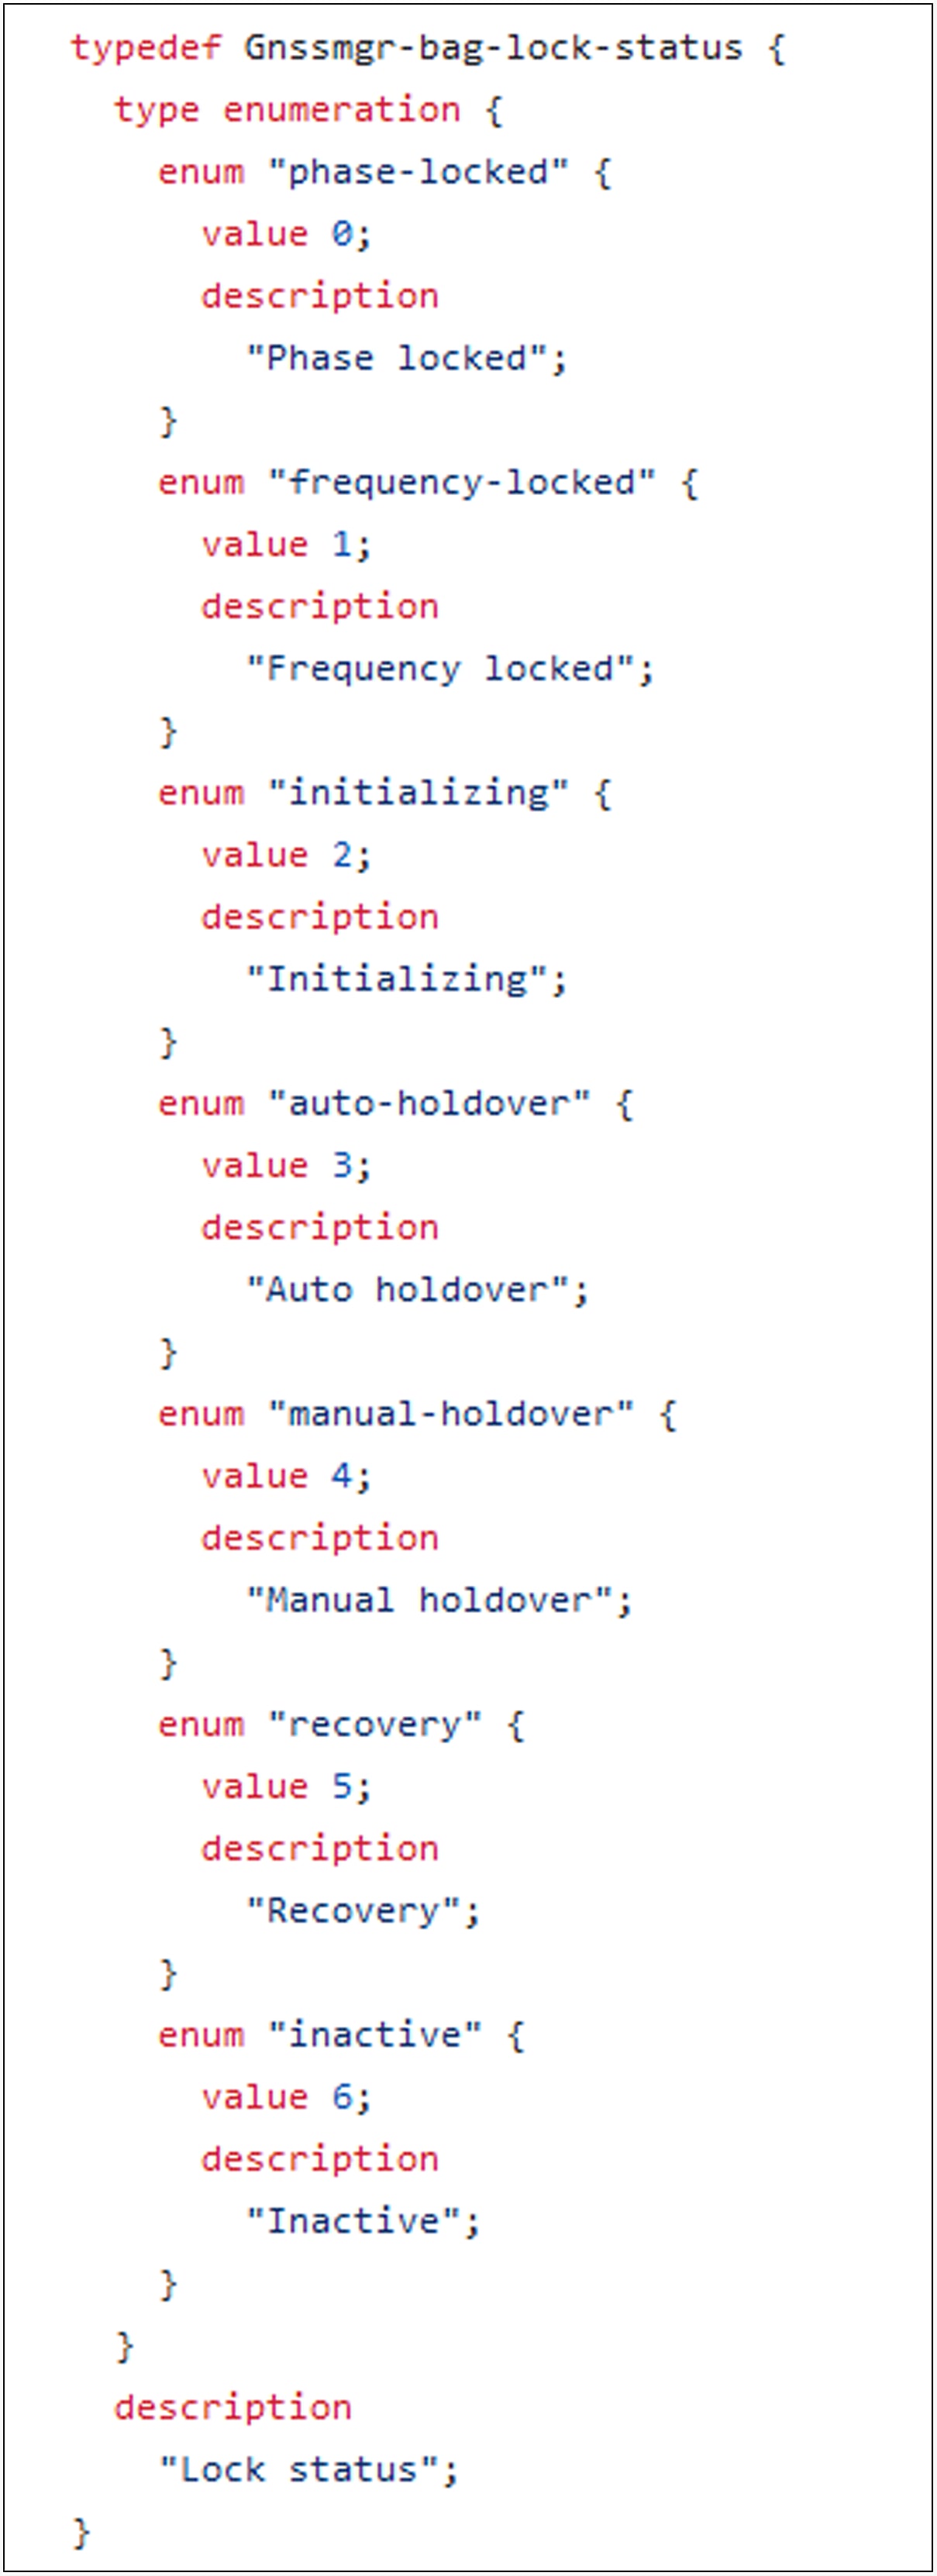
GNSS receiver lock status bag
2.4.2. GNSS receiver major alarms
GNSS receiver major alarms: This is a performance monitoring KPI and a good indicator of the health of the feed between the GPS antenna and the cell site router.
The CLI command to capture the major alarms of the GNSS receiver of a cell site router is shown below:
| <<router>>#show gnss-receiver GNSS-receiver 0 location 0/RP0/CPU0 Status: Available, Up Position: 35:30.60 N -97:45.68 W 0.373km Time: 2024:02:07 02:36:18 (UTC offset: 0s) Locked at: 2024:02:07 02:36:15 Firmware version: TIM 1.10 Lock Status: Phase Locked, Receiver Mode: Time fix only Survey Progress: 100, Holdover Duration: Unknown Major Alarms: None Minor Alarms: None Anti-jam: Enabled, Cable-delay compensation: 0 1PPS polarity: Positive PDOP: 99.990, HDOP: 99.990, VDOP: 99.990, TDOP: 0.350 Constellation: GPS, Satellite Count: 8 Satellite Thresholds: SNR - 0 dB-Hz, Elevation - 0 degrees, PDOP - 0, TRAIM - 0 us Satellite Info: CHN: Channel, AQUN: Aquisition, EPH: Ephemeris PRN CHN AQUN EPH SV Signal No. No. Flag Flag Type Strength Elevat'n Azimuth --- --- ---- ---- ----------- -------- -------- -------- 5 n/a On On GPS 50.000 66.000 193.000 6 n/a On On GPS 34.000 14.000 64.000 11 n/a On On GPS 41.000 45.000 47.000 12 n/a On On GPS 51.000 50.000 209.000 13 n/a On On GPS 40.000 6.000 147.000 20 n/a On On GPS 45.000 68.000 55.000 25 n/a On On GPS 49.000 49.000 266.000 29 n/a On On GPS 48.000 32.000 313.000 |
The telemetry sensor is the same as in Section 2.4.1. The KPI is different here.
| sounmukh@<<PYANG-DESKTOP>>:~/yang/vendor/cisco/xr/781$ pyang -f tree Cisco-IOS-XR-gnss-oper.yang --tree-depth 6 module: Cisco-IOS-XR-gnss-oper +--ro gnss-receiver +--ro nodes +--ro node* [node] +--ro receivers | +--ro receiver* [number] | +--ro number uint32 | +--ro receiver-number? uint32 | +--ro node? xr:Node-id | +--ro enabled? boolean | +--ro shutdown? boolean | +--ro anti-jam-disable? boolean | +--ro constellation? Gnssmgr-bag-constellation | +--ro snr-threshold? uint32 | +--ro elevation-threshold? uint32 | +--ro pdop-threshold? uint32 | +--ro traim-threshold? uint32 | +--ro cable-delay-compensation? int32 | +--ro polarity1pps? Gnssmgr-bag-1pps-polarity | +--ro available? boolean | +--ro lock-status? Gnssmgr-bag-lock-status | +--ro receiver-mode? Gnssmgr-bag-rx-mode | +--ro survey-progress? uint32 | +--ro holdover-duration? uint32 | +--ro major-alarm? uint32 | +--ro minor-alarm? uint32 | +--ro pdop? uint32 | +--ro hdop? uint32 | +--ro vdop? uint32 |
| Cisco-IOS-XR-gnss-oper:gnss-receiver/nodes/node/receivers/receiver |
Now, we would like to know the possible values for this KPI, but that information is not present in the YANG definition of the model. The only information is the data type, which is uint32.
So what are the possible values? Thankfully, with deployments across service providers, we have knowledge of that. There are two possible error values (the expected value is 0):
● Antenna open when survey is complete (value of 2): Power drawn is very low, below the low threshold.
● Antenna shorted when survey hasn’t started (value of 4): Power drawn is very high, beyond the high threshold.
| {"node_id_str":"<<router>>","subscription_id_str":"app_TEST_200000001","encoding_path":"Cisco-IOS-XR-gnss-oper:gnss-receiver/nodes/node/receivers/receiver","collection_id":"93083","collection_start_time":"1684953014303","msg_timestamp":"1684953014314","data_json":[{"timestamp":"1684953014313","keys":[{"node":"0/RP0/CPU0"},{"number":0}],"content":{"receiver-number":0,"node":"0/RP0/CPU0","enabled":true,"shutdown":false,"anti-jam-disable":false,"constellation":"gps","snr-threshold":0,"elevation-threshold":0,"pdop-threshold":0,"traim-threshold":0,"cable-delay-compensation":0,"polarity1pps":"positive","available":true,"lock-status":"initializing","receiver-mode":"no-fix","survey-progress":100,"major-alarm":2,"minor-alarm":0,"pdop":99990,"hdop":99990,"vdop":99990,"tdop":99990,"latitude":101806,"longitude":-296378,"altitude":"11527","utc-offset":0,"firmware-version":"TIM 1.10","satellite-data-known":true}}],"collection_end_time":"1684953014314"} |
| <<router>>#show gnss-receiver GNSS-receiver 0 location 0/RP0/CPU0 Status: Available, Up Position: 28:16.77 N -82:19.63 W 0.012km Firmware version: TIM 1.10 Lock Status: Initializing, Receiver Mode: No fix Survey Progress: 100, Holdover Duration: Unknown Major Alarms: Antenna open Minor Alarms: None Anti-jam: Enabled, Cable-delay compensation: 0 1PPS polarity: Positive PDOP: 99.990, HDOP: 99.990, VDOP: 99.990, TDOP: 99.990 Constellation: GPS, Satellite Count: 0 Satellite Thresholds: SNR - 0 dB-Hz, Elevation - 0 degrees, PDOP - 0, TRAIM - 0 us Satellite Info: No visible satellites |
| {"node_id_str":"<<router>>subscription_id_str":"app_TEST_200000001","encoding_path":"Cisco-IOS-XR-gnss-oper:gnss-receiver/nodes/node/receivers/receiver","collection_id":"1419","collection_start_time":"1684954211172","msg_timestamp":"1684954211184","data_json":[{"timestamp":"1684954211182","keys":[{"node":"0/RP0/CPU0"},{"number":0}],"content":{"receiver-number":0,"node":"0/RP0/CPU0","enabled":true,"shutdown":false,"anti-jam-disable":false,"constellation":"gps","snr-threshold":0,"elevation-threshold":0,"pdop-threshold":0,"traim-threshold":0,"cable-delay-compensation":0,"polarity1pps":"positive","available":true,"lock-status":"initializing","receiver-mode":"no-fix","survey-progress":0,"major-alarm":4,"minor-alarm":0,"pdop":99990,"hdop":99990,"vdop":99990,"tdop":99990,"latitude":0,"longitude":0,"altitude":"0","utc-offset":0,"firmware-version":"TIM 1.10","satellite-data-known":true}}],"collection_end_time":"1684954211184"} |
| <<router>>#show gnss-receiver GNSS-receiver 0 location 0/RP0/CPU0 Status: Available, Up Position: 00:00.00 N 00:00.00 W 0.000km Firmware version: TIM 1.10 Lock Status: Initializing, Receiver Mode: No fix Survey Progress: 0, Holdover Duration: Unknown Major Alarms: Antenna shorted Minor Alarms: None Anti-jam: Enabled, Cable-delay compensation: 0 1PPS polarity: Positive PDOP: 99.990, HDOP: 99.990, VDOP: 99.990, TDOP: 99.990 Constellation: GPS, Satellite Count: 0 Satellite Thresholds: SNR - 0 dB-Hz, Elevation - 0 degrees, PDOP - 0, TRAIM - 0 us Satellite Info: No visible satellites |
2.4.3. GNSS receiver satellite count
GNSS receiver satellite count: This is a performance monitoring KPI and indicates how many satellites the antenna/router can “lock on to.” When the GNSS module comes up in self-survey mode, it tries to lock on to a minimum of four different satellites. So we cannot fall below that threshold of 4.
The CLI command to display the satellite count of the GNSS receiver of a cell site router is shown below:
| <<router>>#sh gnss-receiver GNSS-receiver 0 location 0/RP0/CPU0 Status: Available, Up Position: 35:30.60 N -97:45.68 W 0.373km Time: 2024:02:07 03:08:14 (UTC offset: 0s) Locked at: 2024:02:07 03:08:11 Firmware version: TIM 1.10 Lock Status: Phase Locked, Receiver Mode: Time fix only Survey Progress: 100, Holdover Duration: Unknown Major Alarms: None Minor Alarms: None Anti-jam: Enabled, Cable-delay compensation: 0 1PPS polarity: Positive PDOP: 99.990, HDOP: 99.990, VDOP: 99.990, TDOP: 0.330 Constellation: GPS, Satellite Count: 9 Satellite Thresholds: SNR - 0 dB-Hz, Elevation - 0 degrees, PDOP - 0, TRAIM - 0 us Satellite Info: CHN: Channel, AQUN: Aquisition, EPH: Ephemeris PRN CHN AQUN EPH SV Signal No. No. Flag Flag Type Strength Elevat'n Azimuth --- --- ---- ---- ----------- -------- -------- -------- 5 n/a On On GPS 47.000 82.000 192.000 11 n/a On On GPS 34.000 35.000 59.000 12 n/a On On GPS 48.000 36.000 200.000 13 n/a On On GPS 42.000 17.000 137.000 15 n/a On On GPS 47.000 13.000 173.000 18 n/a On On GPS 29.000 11.000 271.000 20 n/a On On GPS 46.000 54.000 45.000 25 n/a On On GPS 47.000 44.000 244.000 29 n/a On On GPS 46.000 45.000 318.000 |
We will be using the same telemetry sensor for the satellite count as we used in Sections 2.4.1 and 2.4.2. The tricky part is that satellite count is not a KPI defined in the data model. We need to parse that output (present as a list) from the data streamed out of the router.
| <<router>>#run mdt_exec -s Cisco-IOS-XR-gnss-oper:gnss-receiver/nodes/node/receivers -c 10000 -------- {"node_id_str":"OKOKC00012A-CS000-CSR001","subscription_id_str":"app_TEST_200000001","encoding_path":"Cisco-IOS-XR-gnss-oper:gnss-receiver/nodes/node/receivers/receiver","collection_id":"388489","collection_start_time":"1707275448416","msg_timestamp":"1707275448423","data_json":[{"timestamp":"1707275448421","keys":[{"node":"0/RP0/CPU0"},{"number":0}],"content":{"receiver-number":0,"node":"0/RP0/CPU0","enabled":true,"shutdown":false,"anti-jam-disable":false,"constellation":"gps","snr-threshold":0,"elevation-threshold":0,"pdop-threshold":0,"traim-threshold":0,"cable-delay-compensation":0,"polarity1pps":"positive","available":true,"lock-status":"phase-locked","receiver-mode":"time-fix-only","survey-progress":100,"major-alarm":0,"minor-alarm":0,"pdop":99990,"hdop":99990,"vdop":99990,"tdop":330,"latitude":127836,"longitude":-351941,"altitude":"372682","time":1707275446,"utc-offset":0,"firmware-version":"TIM 1.10","locked-time":1707275291,"satellite-data-known":true,"satellite":[{"prn-number":5,"acquisition-flag":true,"ephemeris-flag":true,"sv-type":"gps","signal-strength":48000,"elevation":83000,"azimuth":191000},{"prn-number":11,"acquisition-flag":true,"ephemeris-flag":true,"sv-type":"gps","signal-
/// Output truncated /// |
When we parse this data on a JSON code viewer, you can see that the satellite count mentioned here is 9.
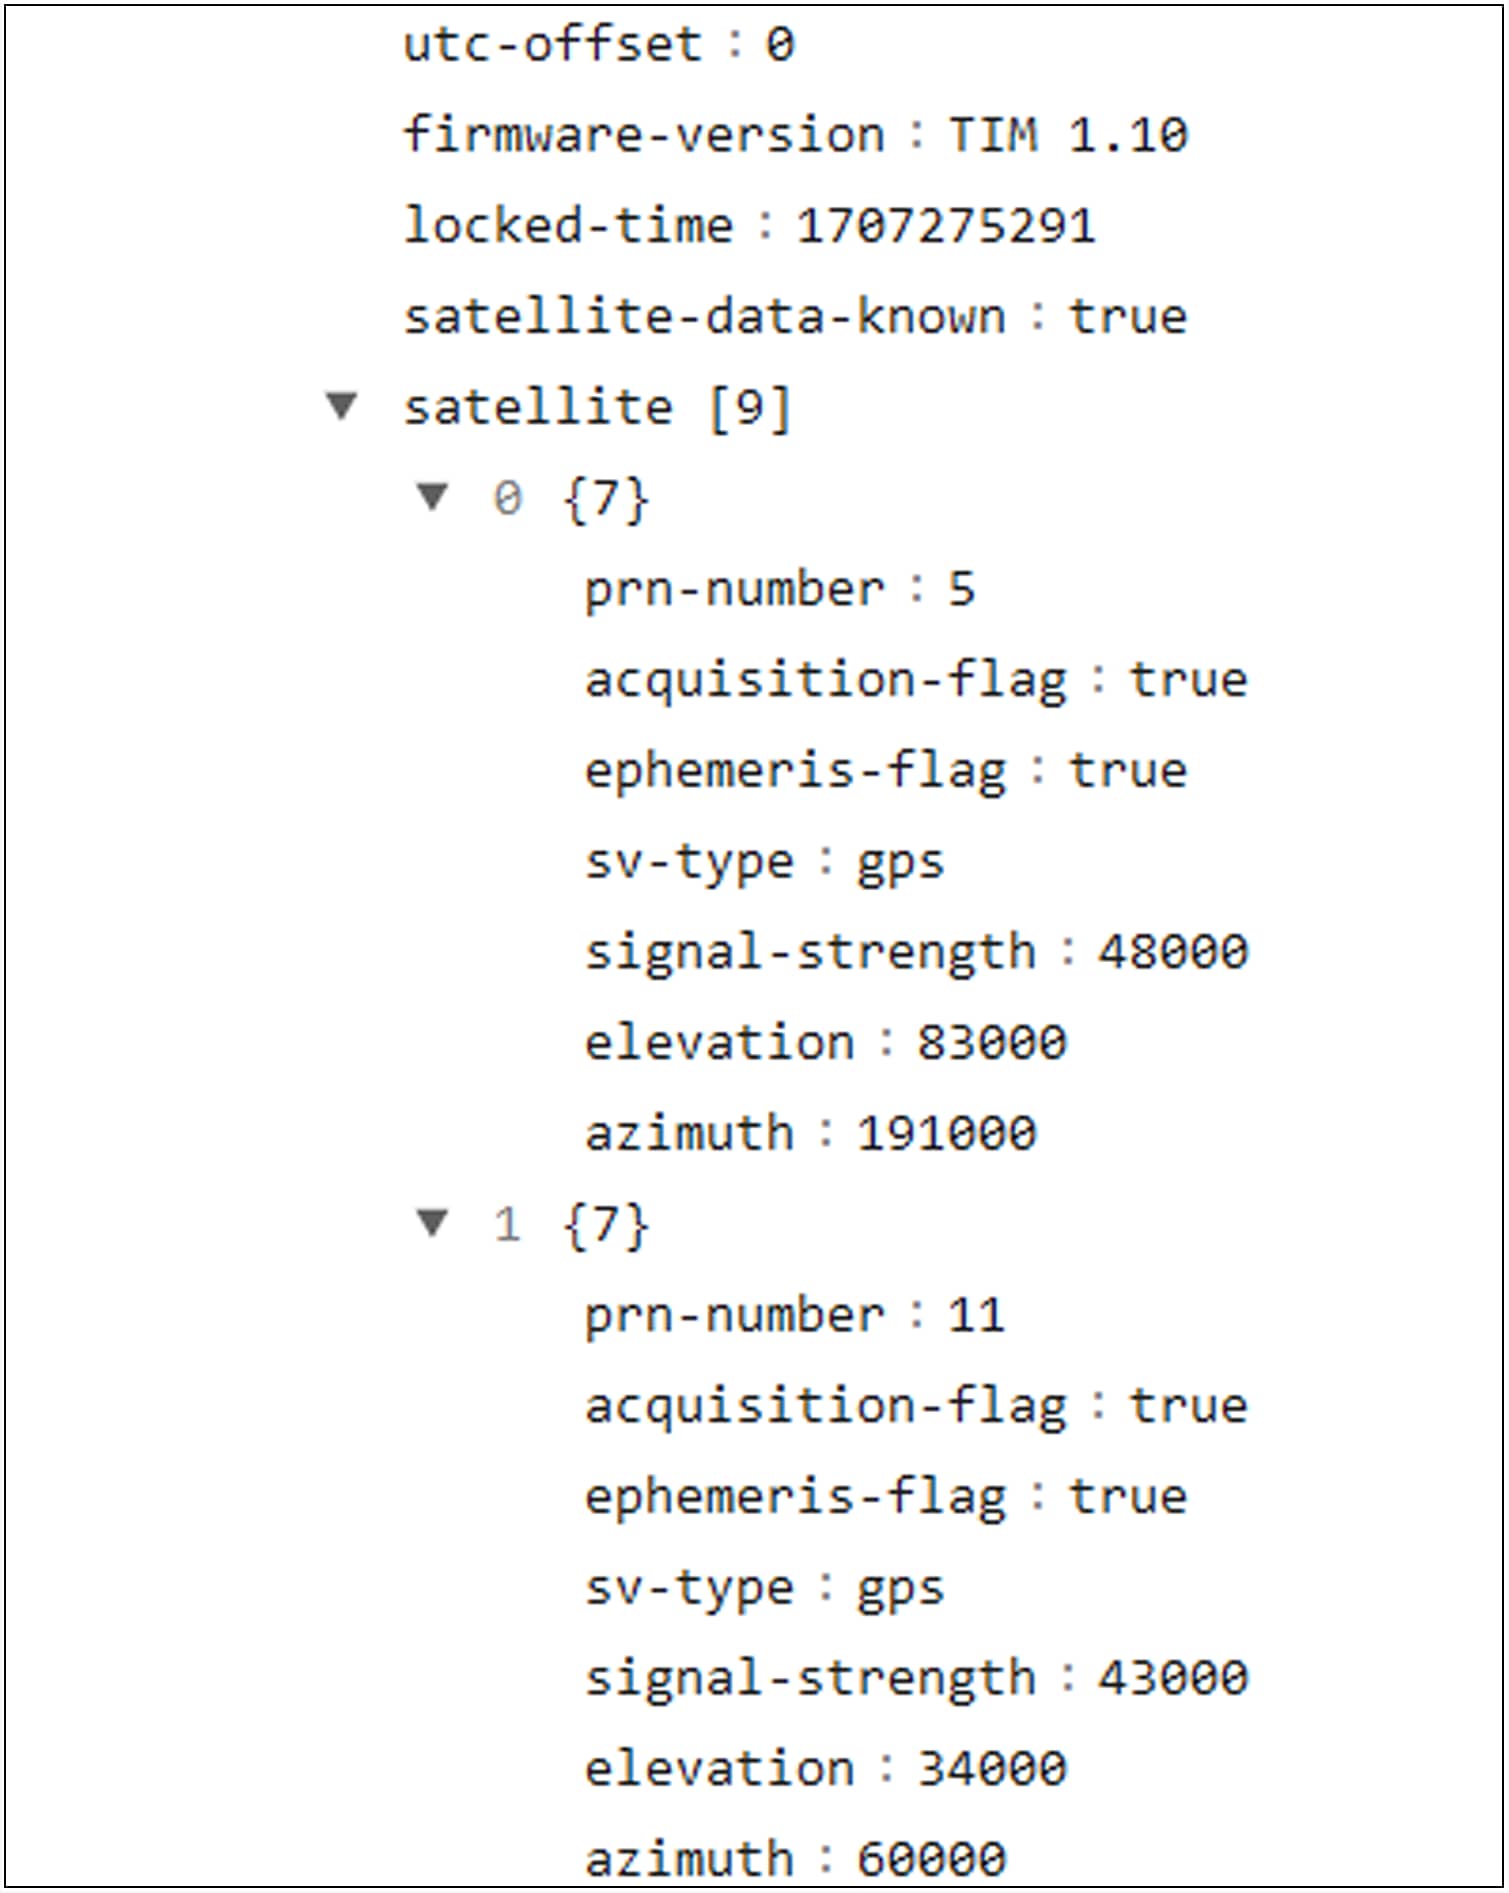
Count of satellites
2.4.4. GNSS receiver satellite signal strength
GNSS receiver satellite signal strength: This is a performance monitoring KPI and a good indicator of the strength of the signal for each satellite discovered by the GNSS module of the cell site router.
The CLI command is the same as above. Below is a snippet of what it looks like:
| Satellite Info: CHN: Channel, AQUN: Aquisition, EPH: Ephemeris PRN CHN AQUN EPH SV Signal No. No. Flag Flag Type Strength Elevat'n Azimuth --- --- ---- ---- ----------- -------- -------- -------- 5 n/a On On GPS 47.000 82.000 192.000 11 n/a On On GPS 34.000 35.000 59.000 12 n/a On On GPS 48.000 36.000 200.000 13 n/a On On GPS 42.000 17.000 137.000 15 n/a On On GPS 47.000 13.000 173.000 18 n/a On On GPS 29.000 11.000 271.000 20 n/a On On GPS 46.000 54.000 45.000 25 n/a On On GPS 47.000 44.000 244.000 29 n/a On On GPS 46.000 45.000 318.000 |
The expected “good” values are 40 and above. If the value is 30 or less, that indicates poor signal strength. We should have at least four satellites with a value greater than 30. The signal value here is defined (in GitHub) as 0.001 dB-Hz.
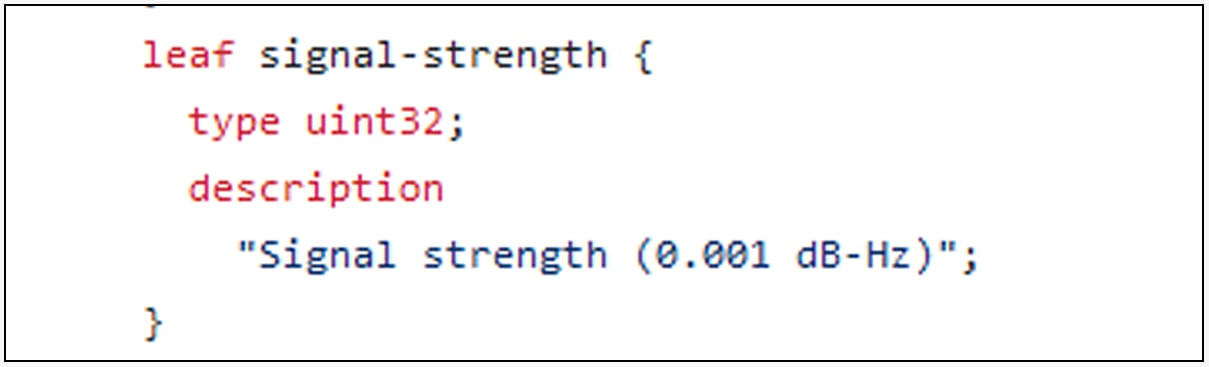
Unit of signal strength
Before we leave the GNSS section, I will leave you with a bonus KPI, which is the location of the cell site router in latitude, longitude, and altitude. You can use the same telemetry sensor to monitor the location.
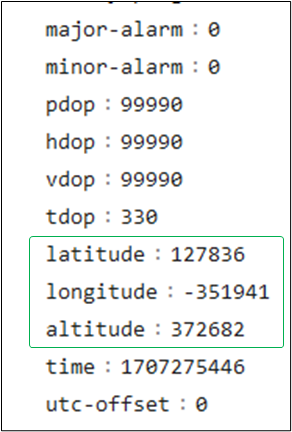
Latitude, longitude, and altitude
2.4.5. PTP advertised clock class
PTP advertised clock class: This is a performance monitoring KPI, and it gives us information about the Precision Time Protocol (PTP) clock class the cell site router is advertising to its downstream devices (another router, or a radio unit or distributed unit).
The CLI command to validate the advertised clock class is:
| <<router>>#sh ptp advertised-clock Clock ID: Local Clock (28affdfffeba4000) Clock properties: Domain: 24, Priority1: 128, Priority2: 128, Class: 6 Accuracy: 0x21, Offset scaled log variance: 0x4e5d Time Source: GPS Timescale: PTP Frequency-traceable, Time-traceable Current UTC offset: 37 seconds (valid) |
A clock class of 6 essentially means that the router (primary clock) is locked to the primary reference clock (that is good) and is advertising that clock class to subordinate clocks.
Now let us figure out how to stream this data using an appropriate data model and a telemetry sensor.
| <<router>>#yang-describe operational show ptp advertised-clock YANG Paths: Cisco-IOS-XR-ptp-oper:ptp/advertised-clock |
We will have a look at the data stored and the leaf of our interest.
| <<router>>#show yang operational ptp-oper:ptp advertised-clock JSON { "Cisco-IOS-XR-ptp-oper:ptp": { "advertised-clock": { "clock-properties": { "clock-id": "2931841158373588992", "priority1": 128, "priority2": 128, "class": 6, "accuracy": 33, "offset-log-variance": 20061, "steps-removed": 0, "time-source": "gps", "utc-offset": { "current-offset": 37, "offset-valid": true }, "frequency-traceable": true, "time-traceable": true, "timescale": "ptp", "leap-seconds": "none", "receiver": { "clock-id": "0", "port-number": 0 }, "is-receiver-valid": false, "sender": { "clock-id": "0", "port-number": 0 }, "is-sender-valid": false, "local": true, "configured-clock-class": 0, "configured-priority": 128 }, "domain": 24, "time-source-configured": false, "received-time-source": "gps", "timescale-configured": false, "received-timescale": "ptp" } } } |
Before we move to the next KPI, we must understand the possible values of this KPI so that we can build anomaly detection for it. Here is a mapping table of the possible values of this KPI and what it means from a PTP specification perspective.
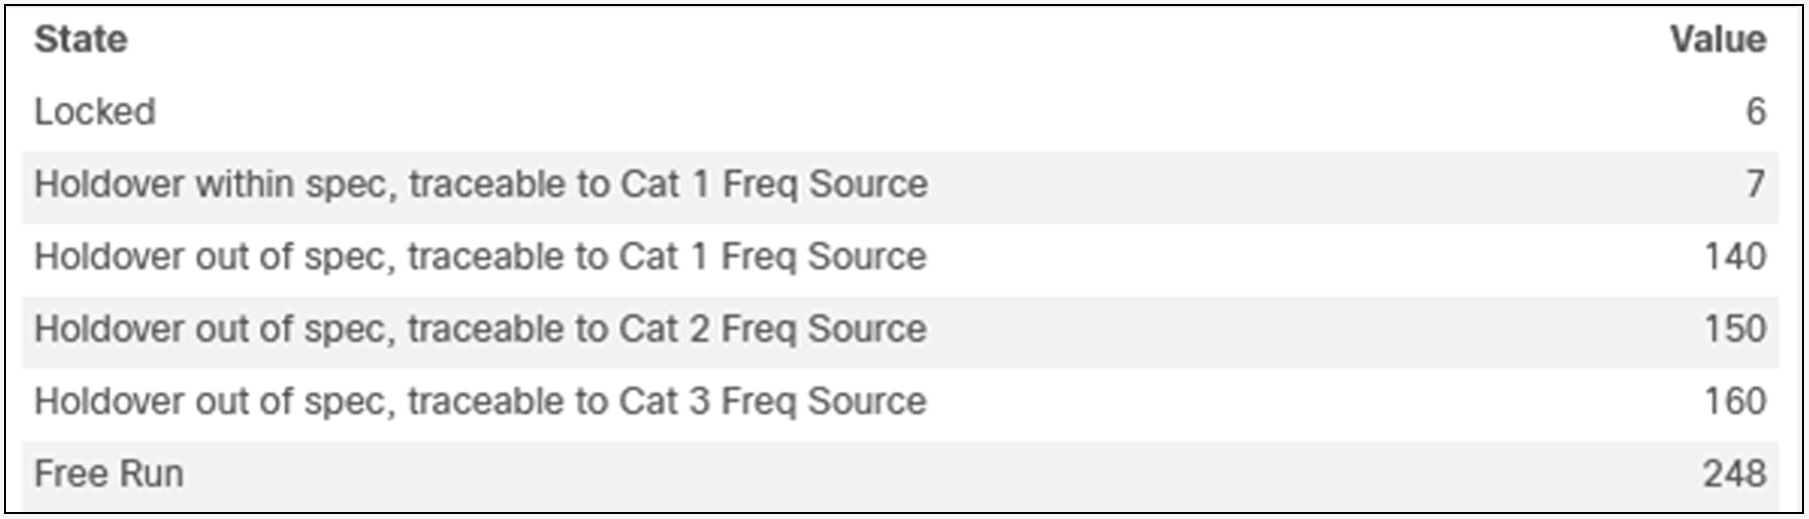
PTP advertised clock class values table
2.4.6. PTP interface line state
PTP interface line state: This is a performance monitoring KPI and will indicate if the cell site router is distributing the clock properly.
The CLI command to verify the PTP interface line state on a cell site router is:
| <<router>>#sh ptp inter br Intf Port Port Line Name Number State Encap State Mechanism -------------------------------------------------------------------------------- Te0/0/0/13 1 Master Ethernet up 1-step DRRM Te0/0/0/4.200 2 Master Ethernet up 1-step DRRM Te0/0/0/5.200 3 Master Ethernet up 1-step DRRM Te0/0/0/6.200 4 Master Ethernet up 1-step DRRM Te0/0/0/7.200 5 Master Ethernet up 1-step DRRM Te0/0/0/8.200 6 Master Ethernet up 1-step DRRM Te0/0/0/9.200 7 Master Ethernet up 1-step DRRM |
The telemetry sensor with the data model and the container information can be found as follows:
| <<router>>#yang-describe operational show ptp int br YANG Paths: Cisco-IOS-XR-ptp-oper:ptp/interfaces/interface |
Let us have a look at the exact “string” value of this KPI on this router.
| <<router>>#show yang operational ptp-oper:ptp interfaces interface JSON { "Cisco-IOS-XR-ptp-oper:ptp": { "interfaces": { "interface": [ { "interface-name": "TenGigE0/0/0/13", "port-state": "master", "port-number": 1, "line-state": "im-state-up", "interface-type": "IFT_TENGETHERNET", "encapsulation": "ethernet", "mac-address": { "macaddr": "28:af:fd:ba:40:11" }, |
If you want to have a look at a cell site router where the line state is down, and what JSON value the router is streaming for this KPI for the corresponding index (interface), here you go:
| <<router>>#sh ptp int br Intf Port Port Line Name Number State Encap State Mechanism -------------------------------------------------------------------------------- Te0/0/0/13 1 Master Ethernet up 1-step DRRM Te0/0/0/4.200 2 Master Ethernet up 1-step DRRM Te0/0/0/5.200 3 Master Ethernet up 1-step DRRM Te0/0/0/6.200 4 Master Ethernet up 1-step DRRM Te0/0/0/7.200 5 Master Ethernet up 1-step DRRM Te0/0/0/8.200 6 Master Ethernet up 1-step DRRM Te0/0/0/9.200 7 Initializing Ethernet down 1-step DRRM
"interface-name": "TenGigE0/0/0/9.200", "port-state": "initializing", "port-number": 7, "line-state": "im-state-down", "interface-type": "IFT_VLAN_SUBIF", "encapsulation": "ethernet", "mac-address": { "macaddr": "d0:09:c8:b7:b9:0d" }, |
2.4.7. PTP interface port state
PTP interface port state: This is a performance monitoring KPI and will indicate if the cell site router is distributing the clock properly. If the router is directly connected to a primary reference clock signal, the port state will be “Master” and it will distribute the clock to subordinates.
The CLI command to verify the PTP interface port state on a cell site router is:
| <<router>>#sh ptp inter br Intf Port Port Line Name Number State Encap State Mechanism -------------------------------------------------------------------------------- Te0/0/0/13 1 Master Ethernet up 1-step DRRM Te0/0/0/4.200 2 Master Ethernet up 1-step DRRM Te0/0/0/5.200 3 Master Ethernet up 1-step DRRM Te0/0/0/6.200 4 Master Ethernet up 1-step DRRM Te0/0/0/7.200 5 Master Ethernet up 1-step DRRM Te0/0/0/8.200 6 Master Ethernet up 1-step DRRM Te0/0/0/9.200 7 Master Ethernet up 1-step DRRM |
The telemetry sensor with the data model and the container information can be found out with this command:
| <<router>>#yang-describe operational show ptp int br YANG Paths: Cisco-IOS-XR-ptp-oper:ptp/interfaces/interface |
Let us have a look at the exact “string” value of this KPI on the router.
| <<router>>#show yang operational ptp-oper:ptp interfaces interface JSON { "Cisco-IOS-XR-ptp-oper:ptp": { "interfaces": { "interface": [ { "interface-name": "TenGigE0/0/0/13", "port-state": "master", "port-number": 1, "line-state": "im-state-up", "interface-type": "IFT_TENGETHERNET", "encapsulation": "ethernet", "mac-address": { "macaddr": "28:af:fd:ba:40:11" }, |
If you want to have a look at a cell site router where the line state is down, and what JSON value the router is streaming for this KPI for the corresponding index (interface), here you go:
| <<router>>#sh ptp int br Intf Port Port Line Name Number State Encap State Mechanism -------------------------------------------------------------------------------- Te0/0/0/13 1 Master Ethernet up 1-step DRRM Te0/0/0/4.200 2 Master Ethernet up 1-step DRRM Te0/0/0/5.200 3 Master Ethernet up 1-step DRRM Te0/0/0/6.200 4 Initializing Ethernet down 1-step DRRM Te0/0/0/7.200 5 Master Ethernet up 1-step DRRM Te0/0/0/8.200 6 Master Ethernet up 1-step DRRM Te0/0/0/9.200 7 Master Ethernet up 1-step DRRM
"interface-name": "TenGigE0/0/0/6.200", "port-state": "initializing", "port-number": 4, "line-state": "im-state-down", "interface-type": "IFT_VLAN_SUBIF", "encapsulation": "ethernet", "mac-address": { "macaddr": "5c:31:92:a5:de:0a" }, |
If you want to understand all possible port states, there is more information in the YANG definition of this data model.
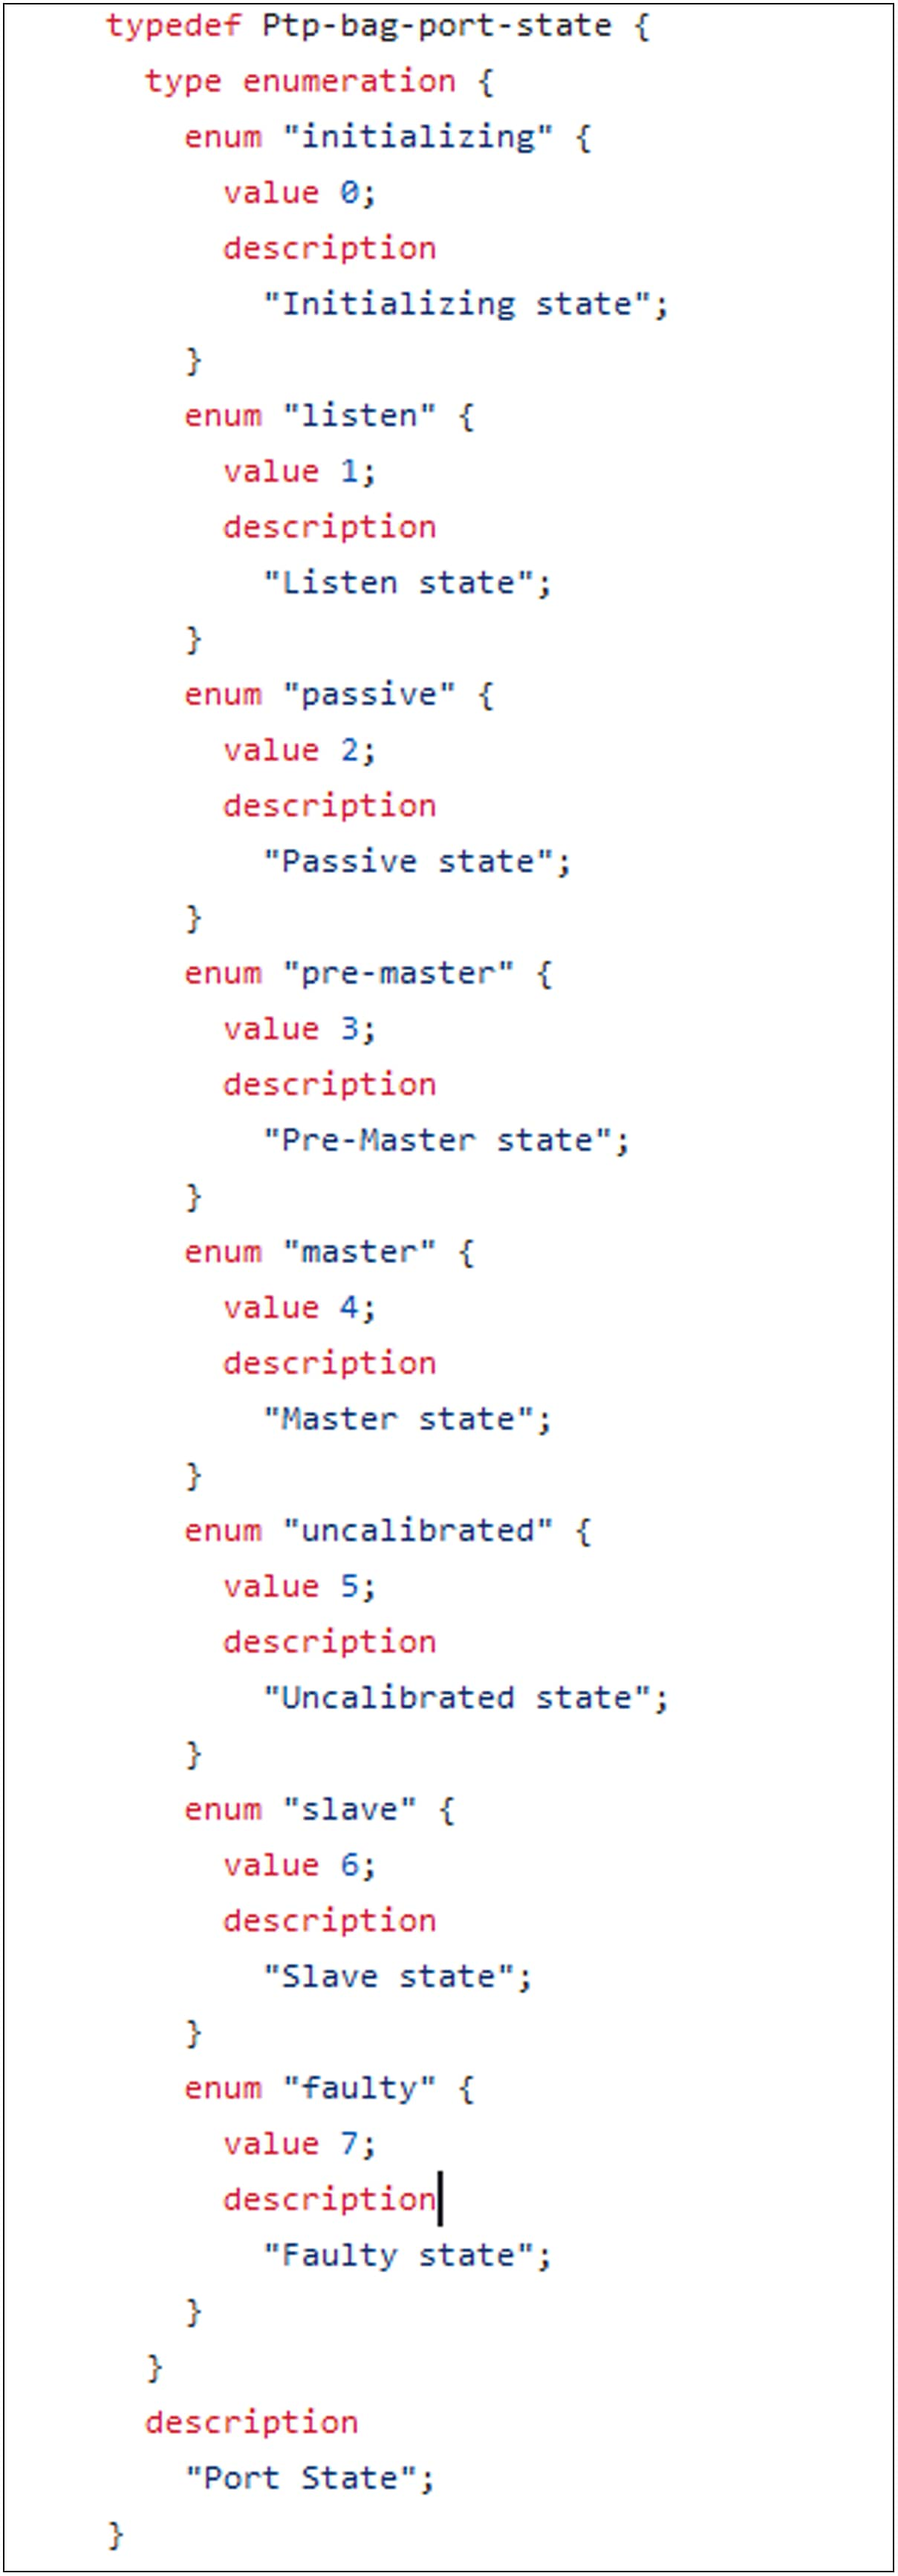
PTP port state possible values
2.4.8. Frequency synchronization selection status
Frequency synchronization selection status: This is a performance monitoring KPI that indicates if the router is in sync (frequency) with the primary reference clock. If the status shows “Locked” to the GNSS (which is the primary reference clock), that is a good place to be.
The CLI command shows the frequency synchronization selection status with respect to the clock input:
| <<router>>#sh frequency synchronization selection Node 0/RP0/CPU0: ============== Selection point: T0-SEL-B (2 inputs, 1 selected) Last programmed 1d01h ago, and selection made 1d01h ago Next selection points SPA scoped : None Node scoped : CHASSIS-TOD-SEL Chassis scoped: LC_TX_SELECT Router scoped : None Uses frequency selection Used for local line interface output S Input Last Selection Point QL Pri Status == ======================== ======================== ===== === =========== 1 GNSS 0 [0/RP0/CPU0] n/a PRC 100 Locked Internal0 [0/RP0/CPU0] n/a SEC 255 Available
Selection point: 1588-SEL (2 inputs, 1 selected) Last programmed 1d01h ago, and selection made 1d01h ago Next selection points SPA scoped : None Node scoped : None Chassis scoped: None Router scoped : None Uses frequency selection S Input Last Selection Point QL Pri Status == ======================== ======================== ===== === =========== 1 GNSS 0 [0/RP0/CPU0] n/a PRC 100 Locked Internal0 [0/RP0/CPU0] n/a SEC 255 Available |
Now we will try to get the telemetry sensor and the data model for this KPI. Let us execute the following command:
| <<router>>#yang-describe operational sh frequency synchronization selection <<router>># |
As this didn’t fetch an output, we will try to look at the schema of this data.
| <<router>>#schema-describe show frequency synchronization selection Action: get_children Path: RootOper.FrequencySynchronization.Node
Action: get Path: RootOper.FrequencySynchronization.Node({'Node': '0/RP0/CPU0'}).SelectionPointData
Action: get Path: RootOper.FrequencySynchronization.Node({'Node': '0/RP0/CPU0'}).SelectionPointInput |
Now we have a good understanding of the container (Selection Point Input) and the key (Node) to fetch the data. Let us search for the relevant YANG model and the tree structure with the KPI/leaf we are concerned with:
| sounmukh@<<PYANG-DESKTOP>>:~yang/vendor/cisco/xr/781$ ls -lrt | grep freqsync-oper -rwxrwxrwx 1 sounmukh sounmukh 48668 Oct 26 09:11 Cisco-IOS-XR-freqsync-oper-sub1.yang -rwxrwxrwx 1 sounmukh sounmukh 12218 Oct 26 09:11 Cisco-IOS-XR-freqsync-oper.yang -rwxrwxrwx 1 sounmukh sounmukh 48650 Oct 26 09:11 Cisco-IOS-XR-ncs4k-freqsync-oper-sub1.yang -rwxrwxrwx 1 sounmukh sounmukh 10828 Oct 26 09:11 Cisco-IOS-XR-ncs4k-freqsync-oper.yang
sounmukh@@<<PYANG-DESKTOP>>:~/yang/vendor/cisco/xr/781$ pyang -f tree Cisco-IOS-XR-freqsync-oper.yang --tree-depth 3 module: Cisco-IOS-XR-freqsync-oper +--ro frequency-synchronization +--ro global-nodes | +--ro global-node* [node] | ... +--ro global-interfaces | +--ro global-interface* [interface-name] | ... +--ro summary | +--ro frequency-summary* [] | | ... | +--ro time-of-day-summary* [] | ... +--ro interface-datas | +--ro interface-data* [interface-name] | ... +--ro nodes +--ro node* [node] ... |
From the clues that we got from the schema-describe command, we know that our data is in the nodes container followed by SelectionPointInputs, so we will open that and look inside it.
| sounmukh@<<PYANG-DESKTOP>>:~/yang/vendor/cisco/xr/781$ pyang -f tree Cisco-IOS-XR-freqsync-oper.yang --tree-path frequency-synchronization/nodes/node --tree-depth 4 module: Cisco-IOS-XR-freqsync-oper +--ro frequency-synchronization +--ro nodes +--ro node* [node] +--ro ntp-data | ... +--ro selection-point-datas | ... +--ro configuration-errors | ... +--ro ptp-data | ... +--ro ssm-summary | ... +--ro detailed-clock-datas | ... +--ro clock-datas | ... +--ro selection-point-inputs | ... +--ro node
sounmukh@<<PYANG-DESKTOP>>:~/yang/vendor/cisco/xr/781$ pyang -f tree Cisco-IOS-XR-freqsync-oper.yang --tree-path frequency-synchronization/nodes/node/selection-point-inputs --tree-depth 6 module: Cisco-IOS-XR-freqsync-oper +--ro frequency-synchronization +--ro nodes +--ro node* [node] +--ro selection-point-inputs +--ro selection-point-input* [] +--ro selection-point? uint32 +--ro stream-type? Fsync-stream +--ro source-type? Fsync-source +--ro interface? xr:Interface-name +--ro clock-port? uint32 +--ro last-node? xr:Node-id +--ro last-selection-point? uint32 +--ro output-id? uint32 +--ro input-selection-point | ... +--ro stream | ... +--ro original-source | ... +--ro quality-level | ... +--ro supports-frequency? boolean +--ro supports-time-of-day? boolean +--ro priority? Fsync-pri +--ro time-of-day-priority? Fsync-time-pri +--ro selected? boolean +--ro output-id-xr? Fsync-output-id +--ro platform-status? Fsync-bag-stream-state +--ro platform-failed-reason? Fsync-bag-optional-string +--ro source? string +--ro stale? boolean +--ro removed? boolean +--ro pd-update? boolean |
We now have our KPI (platform status), and we know the container hierarchy to arrive at this KPI. Let us build the telemetry sensor now before test streaming the data. We have inserted the value of the variable in the output below based on our understanding of the data we need to stream.
| Sensor Group Id:GNMI__959449196346437888_1 Sensor Path: Cisco-IOS-XR-freqsync-oper:frequency-synchronization/nodes/node/selection-point-inputs/selection-point-input[selection-point=3] Sensor Path State: Resolved |
Let us test stream this sensor and validate that our KPI exists in here.
| <<router>>#run mdt_exec -s Cisco-IOS-XR-freqsync-oper:frequency-synchronization/nodes/node/selection-point-inputs/selection-point-input[selection-point=3] -c 10000 $
-------- {"node_id_str":"<<router>> ","subscription_id_str":"app_TEST_200000001","encoding_path":"Cisco-IOS-XR-freqsync-oper:frequency-synchronization/nodes/node/selection-point-inputs/selection-point-input","collection_id":"61932","collection_start_time":"1707510863374","msg_timestamp":"1707510863381","data_json":[{"timestamp":"1707510863379","keys":[{"node":"0/RP0/CPU0"},{"selection-point":3},{"stream-type":"local"},{"source-type":"internal"},{"clock-port":5}],"content":{"input-selection-point":{"selection-point-type":3,"selection-point-description":"1588-SEL","node":"0/RP0/CPU0"},"stream":{"stream-input":"source-input","source-id":{"source-class":"internal-clock-source","internal-clock-id":{"node":"0/RP0/CPU0","id":5,"clock-name":""}}},"original-source":{"source-class":"internal-clock-source","internal-clock- id":{"node":"0/RP0/CPU0","id":5,"clock-name":""}},"supports-frequency":true,"supports-time-of-day":false,"quality-level":{"quality-level-option":"option1","option1-value":"option1sec"},"priority":255,"time-of-day-priority":255,"selected":false,"platform-status":"stream-available","source":"Internal Oscillator 0/RP0/CPU0","stale":false,"removed":false,"pd-update":false}},{"timestamp":"1707510863379","keys":[{"node":"0/RP0/CPU0"},{"selection-point":3},{"stream-type":"local"},{"source-type":"gnss"},{"clock-port":0}],"content":{"input-selection-point":{"selection-point-type":3,"selection-point-description":"1588-SEL","node":"0/RP0/CPU0"},"stream":{"stream-input":"source-input","source-id":{"source-class":"gnss-receiver","gnss-receiver-id":{"node":"0/RP0/CPU0","id":0,"clock-name":""}}},"original-source":{"source-class":"gnss-receiver","gnss-receiver-id":{"node":"0/RP0/CPU0","id":0,"clock-name":""}},"supports-frequency":true,"supports-time-of-day":true,"quality-level":{"quality-level-option":"option1","option1-value":"option1prc"},"priority":100,"time-of-day-priority":1,"selected":true,"output-id-xr":1,"platform-status":"stream-locked","source":"GNSS Receiver 0 location 0/RP0/CPU0","stale":false,"removed":false,"pd-update":false}}],"collection_end_time":"1707510863381"} --------
|
We will now have a look at a router where we don’t have a GNSS source for some time. Let us validate the KPI value here:
| <<router>>#sh frequency synchronization selection Node 0/RP0/CPU0: ============== Selection point: T0-SEL-B (1 inputs, 1 selected) Last programmed 01:13:05 ago, and selection made 01:13:05 ago Next selection points SPA scoped : None Node scoped : CHASSIS-TOD-SEL Chassis scoped: LC_TX_SELECT Router scoped : None Uses frequency selection Used for local line interface output S Input Last Selection Point QL Pri Status == ======================== ======================== ===== === =========== 1 Internal0 [0/RP0/CPU0] n/a SEC 255 Holdover
Selection point: 1588-SEL (1 inputs, 1 selected) Last programmed 01:13:05 ago, and selection made 01:13:05 ago Next selection points SPA scoped : None Node scoped : None Chassis scoped: None Router scoped : None Uses frequency selection S Input Last Selection Point QL Pri Status == ======================== ======================== ===== === =========== 1 Internal0 [0/RP0/CPU0] n/a SEC 255 Holdover |
You can see that the router is using the internal oscillator instead of the GNSS to display the platform status.
| <<router>>#run mdt_exec -s Cisco-IOS-XR-freqsync-oper:frequency-synchronization/nodes/node/selection-point-inputs/selection-point-input[selection-point=3] $
-------- {"node_id_str":"<<router>>","subscription_id_str":"app_TEST_200000001","encoding_path":"Cisco-IOS-XR-freqsync-oper:frequency-synchronization/nodes/node/selection-point-inputs/selection-point-input","collection_id":"169195","collection_start_time":"1707511387102","msg_timestamp":"1707511387109","data_json":[{"timestamp":"1707511387108","keys":[{"node":"0/RP0/CPU0"},{"selection-point":3},{"stream-type":"local"},{"source-type":"internal"},{"clock-port":5}],"content":{"input-selection-point":{"selection-point-type":3,"selection-point-description":"1588-SEL","node":"0/RP0/CPU0"},"stream":{"stream-input":"source-input","source-id":{"source-class":"internal-clock-source","internal-clock-id":{"node":"0/RP0/CPU0","id":5,"clock-name":""}}},"original-source":{"source-class":"internal-clock-source","internal-clock-id":{"node":"0/RP0/CPU0","id":5,"clock-name":""}},"supports-frequency":true,"supports-time-of-day":false,"quality-level":{"quality-level-option":"option1","option1-value":"option1sec"},"priority":255,"time-of-day-priority":255,"selected":true,"output-id-xr":1,"platform-status":"stream-holdover","source":"Internal Oscillator 0/RP0/CPU0","stale":false,"removed":false,"pd-update":false}}],"collection_end_time":"1707511387109"} -------- |
Interface admin status: This is a performance monitoring KPI and will (as the name indicates) let the operator know the admin status of the interface/link. The CLI command to validate this KPI is:
| <<router>>#sh interfaces tenGigE 0/0/0/19 TenGigE0/0/0/19 is up, line protocol is up Interface state transitions: 1 Hardware is TenGigE, address is 28af.fdba.4017 (bia 28af.fdba.4017) Internet address is Unknown
/// Output truncated for brevity ///
30 second input rate 179000 bits/sec, 71 packets/sec 30 second output rate 565000 bits/sec, 102 packets/sec 963668 packets input, 896953172 bytes, 0 total input drops 0 drops for unrecognized upper-level protocol Received 0 broadcast packets, 1194 multicast packets 0 runts, 0 giants, 0 throttles, 0 parity |
The telemetry sensor with the data model and the container information can be found out with this command:
| <<router>>#yang-describe operational show interfaces tenGigE 0/0/0/19 YANG Paths: Cisco-IOS-XR-pfi-im-cmd-oper:interfaces/interface-xr/interface |
Let us have a look at the exact “string” value of this KPI on the router.
| <<router>>#show yang operational pfi-im-cmd-oper:interfaces interface-xr interface
interfaces interface-xr interface interface-name TenGigE0/0/0/19 interface-handle TenGigE0/0/0/19 interface-type IFT_TENGETHERNET hardware-type-string TenGigE state im-state-up line-state im-state-up encapsulation ether encapsulation-type-string ARPA mtu 9000 is-l2-transport-enabled false state-transition-count 1 last-state-transition-time 1707668605203001733 is-dampening-enabled false speed 10000000 duplexity im-attr-duplex-full media-type im-attr-media-10gbase-lr link-type im-attr-link-type-force in-flow-control im-attr-flow-control-off out-flow-control im-attr-flow-control-off mac-address address 28:af:fd:ba:40:17 ! |
Now, if you want to stream the data out of this exact interface, you can use the variable name “interface-name” along with the data, and this is how you define it:
| <<router>>#run mdt_exec -s Cisco-IOS-XR-pfi-im-cmd-oper:interfaces/interface-xr/interface[interface-name=TenGigE0/0/0/19] -c 10000
-------- {"node_id_str":"<<router>>","subscription_id_str":"app_TEST_200000001","encoding_path":"Cisco-IOS-XR-pfi-im-cmd-oper:interfaces/interface-xr/interface","collection_id":"1","collection_start_time":"1707675332808","msg_timestamp":"1707675332844","data_json":[{"timestamp":"1707675332842","keys":[{"interface-name":"TenGigE0/0/0/19"}],"content":{"interface-handle":"TenGigE0/0/0/19","interface-type":"IFT_TENGETHERNET","hardware-type-string":"TenGigE","state":"im-state-up","line-state":"im-state-up","encapsulation":"ether","encapsulation-type-string":"ARPA","mtu":9000,"is-l2-transport-enabled":false,"state-transition-count":1,"last-state-transition-time":"1707668605203001733","is-dampening-enabled":false,"speed":10000000,"duplexity":"im-attr-duplex-full","media-type":"im-attr-media-10gbase-lr","link-type":"im-attr-link-type-force","in-flow-control":"im-attr-flow-control-off","out-flow-control":"im-attr-flow-control-off","mac-address":{"address":"28:af:fd:ba:40:17"},"burned-in-address":{"address":"28:af:fd:ba:40:17"},"carrier-delay":{"carrier-delay-up":0,"carrier-delay-down":0},"bandwidth":"10000000","max-bandwidth":"10000000","is-l2-looped":false,"loopback-configuration":"no- /// Output truncated ///
-------- |
If you want to explore the possible values of this leaf in the data model, this is where you get the information (this is a snapshot of some of the values; many other values are possible):
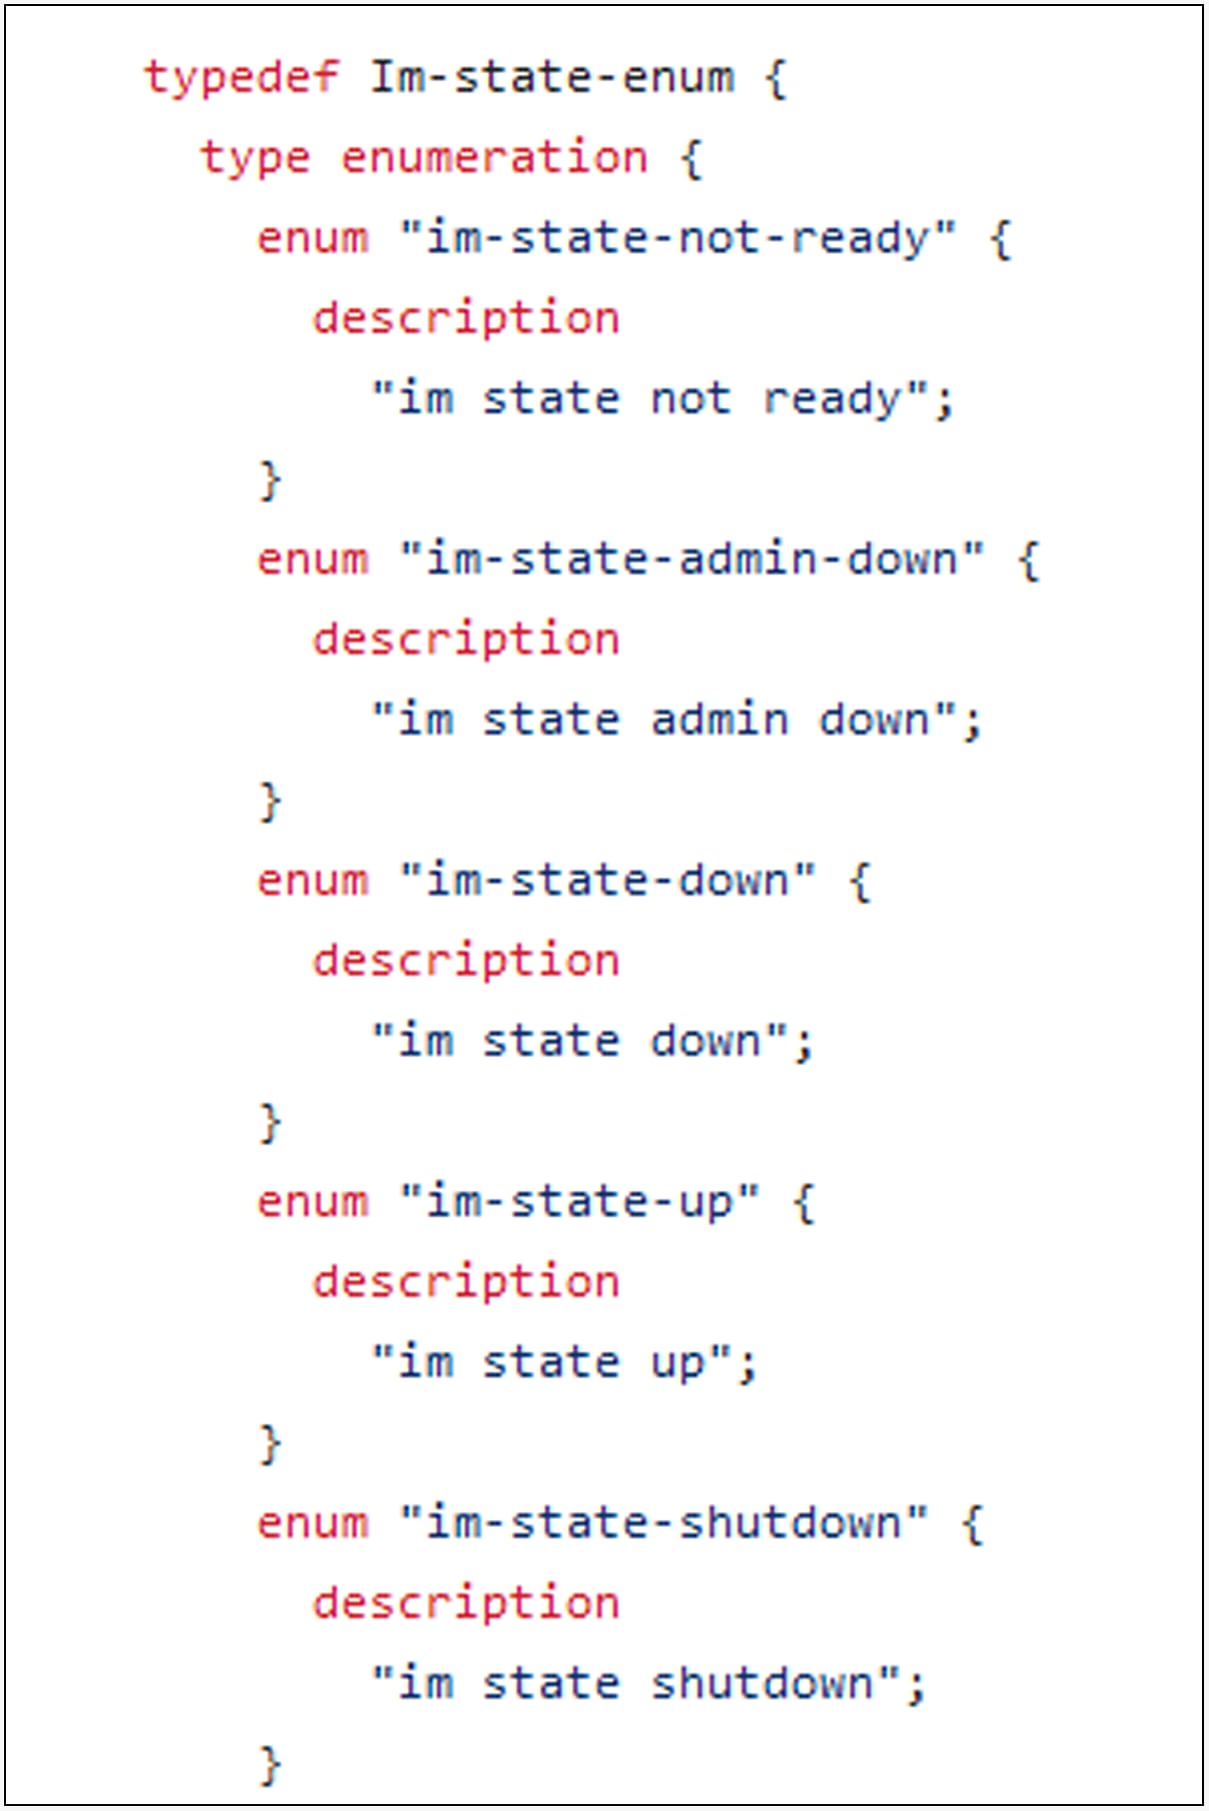
Interface admin status possible values
2.5.2. Interface operational status
Interface operational status: This is a performance monitoring KPI and will (as the name indicates) let the operator know the operational status of the interface/link. The CLI command to validate this KPI is:
| <<router>>#sh interfaces tenGigE 0/0/0/19 TenGigE0/0/0/19 is up, line protocol is up Interface state transitions: 1 Hardware is TenGigE, address is 28af.fdba.4017 (bia 28af.fdba.4017) Internet address is Unknown
/// Output truncated for brevity ///
30 second input rate 179000 bits/sec, 71 packets/sec 30 second output rate 565000 bits/sec, 102 packets/sec 963668 packets input, 896953172 bytes, 0 total input drops 0 drops for unrecognized upper-level protocol Received 0 broadcast packets, 1194 multicast packets 0 runts, 0 giants, 0 throttles, 0 parity |
The telemetry sensor with the data model and the container information can be found with this command:
| <<router>>#yang-describe operational show interfaces tenGigE 0/0/0/19 YANG Paths: Cisco-IOS-XR-pfi-im-cmd-oper:interfaces/interface-xr/interface |
Let us have a look at the exact “string” value of this KPI on this router.
| <<router>>#show yang operational pfi-im-cmd-oper:interfaces interface-xr interface
interfaces interface-xr interface interface-name TenGigE0/0/0/19 interface-handle TenGigE0/0/0/19 interface-type IFT_TENGETHERNET hardware-type-string TenGigE state im-state-up line-state im-state-up encapsulation ether encapsulation-type-string ARPA mtu 9000 is-l2-transport-enabled false state-transition-count 1 last-state-transition-time 1707668605203001733 is-dampening-enabled false speed 10000000 duplexity im-attr-duplex-full media-type im-attr-media-10gbase-lr link-type im-attr-link-type-force in-flow-control im-attr-flow-control-off out-flow-control im-attr-flow-control-off mac-address address 28:af:fd:ba:40:17 ! |
Now, if you want to stream the data from all “TenGig” interfaces on the router, you can use the variable name “interface-name” along with a regular expression, and this is how you define it:
| <<router>>#run mdt_exec -s Cisco-IOS-XR-pfi-im-cmd-oper:interfaces/interface-xr/interface[interface-name=TenGigE*] -c 10000
-------- {"node_id_str":"ORMCO00288A-CS000-CSR001","subscription_id_str":"app_TEST_200000001","encoding_path":"Cisco-IOS-XR-pfi-im-cmd-oper:interfaces/interface-xr/interface","collection_id":"3","collection_start_time":"1707675823932","msg_timestamp":"1707675825059","data_json":[{"timestamp":"1707675824331","keys":[{"interface-name":"TenGigE0/0/0/10"}],"content":{"interface-handle":"TenGigE0/0/0/10","interface-type":"IFT_TENGETHERNET","hardware-type-string":"TenGigE","state":"im-state-up","line-state":"im-state-up","encapsulation":"ether","encapsulation-type-string":"ARPA","mtu":9000,"is-l2-transport-enabled":false,"state-transition-count":1,"last-state-transition-time":"1707668603493817365","is-dampening-enabled":false,"speed":10000000,"duplexity":"im-attr-duplex-full","media-type":"im-attr-media-unknown","link-type":"im-attr-link-type-force","in-flow-control":"im-attr-flow-control-off","out-flow-control":"im-attr-flow-control-off","mac-address":{"address":"28:af:fd:ba:40:0e"},"burned-in-address":{"address":"28:af:fd:ba:40:0e"},"carrier-delay":{"carrier-delay-up":0,"carrier-delay-down":0},"bandwidth":"10000000" /// Output truncated for brevity ///
s":{"address":"28:af:fd:ba:40:09"},"carrier-delay":{"carrier-delay-up":0,"carrier-delay-down":0},"bandwidth":"10000000","max-bandwidth":"10000000","is-l2-looped":false,"parent-interface-name":"TenGigE0/0/0/5","loopback-configuration":"no-loopback","description":"RU2 S-Plane","fast-shutdown":false,"encapsulation-information":{"encapsulation-type":"vlan","dot1q-information":{"encapsulation-details":{"vlan-encapsulation":"service-instance","service-instance-details":{"tags-to-match":[{"ethertype":"untagged","priority":"priority-any","number-of-ranges":0}],"payload-ethertype":"payload-ethertype-any","tags-popped":0,"is-exact-match":0,"is-native-vlan":0,"is-native-preserving":0}},"vlan-switched":{"mode":"none"}}},"interface-statistics":{"stats-type":"basic","basic-interface-stats":{"packets-received":"110104","bytes-received":"7046656","packets-sent":"0","bytes-sent":"0","input-drops":0,"input-queue-drops":0,"input-errors":0,"unknown-protocol-packets-received":0,"output-drops":0,"output-queue-drops":0,"output-errors":0,"last-data-time":1707675824,"seconds-since-last-clear-counters":0,"last-discontinuity-time":1707668599,"seconds-since-packet-received":9,"seconds-since-packet-sent":4294967295}},"if-index":85,"is-intf-logical":true,"is-intf-type-management":false,"is-intf-type-cpu":false}}],"collection_end_time":"0"} -------- |
2.5.3. Interface ingress throughput
Interface ingress throughput: This is a performance monitoring KPI and is our first important network capacity planning KPI. It will indicate the traffic on the link and will help you validate your architecture baseline for the current subscribers on the network. The CLI command to display this KPI is:
| <<router>>#sh interfaces tenGigE 0/0/0/4 TenGigE0/0/0/4 is up, line protocol is up Interface state transitions: 1 Hardware is TenGigE, address is 28af.fdba.4008 (bia 28af.fdba.4008) Description: RU1 Internet address is Unknown MTU 8400 bytes, BW 10000000 Kbit (Max: 10000000 Kbit) reliability 255/255, txload 1/255, rxload 17/255 Encapsulation ARPA, Full-duplex, 10000Mb/s, 10GBASE-LR, link type is force-up output flow control is off, input flow control is off loopback not set, Last link flapped 02:08:02 Last input 00:00:00, output 00:00:00 Last clearing of "show interface" counters never 30 second input rate 676135000 bits/sec, 57219 packets/sec 30 second output rate 49942000 bits/sec, 17230 packets/sec 378359032 packets input, 558874311546 bytes, 0 total input drops 0 drops for unrecognized upper-level protocol Received 69 broadcast packets, 118422 multicast packets 0 runts, 0 giants, 0 throttles, 0 parity 0 input errors, 0 CRC, 0 frame, 0 overrun, 0 ignored, 0 abort 113937844 packets output, 41260657797 bytes, 0 total output drops Output 200 broadcast packets, 304843 multicast packets 0 output errors, 0 underruns, 0 applique, 0 resets 0 output buffer failures, 0 output buffers swapped out 1 carrier transitions |
The telemetry sensor stays the same as in Sections 2.5.1 and 2.5.3. We will look at the new container “data-rates” and the leaf/KPI of that container by streaming the data and viewing it on a JSON viewer.
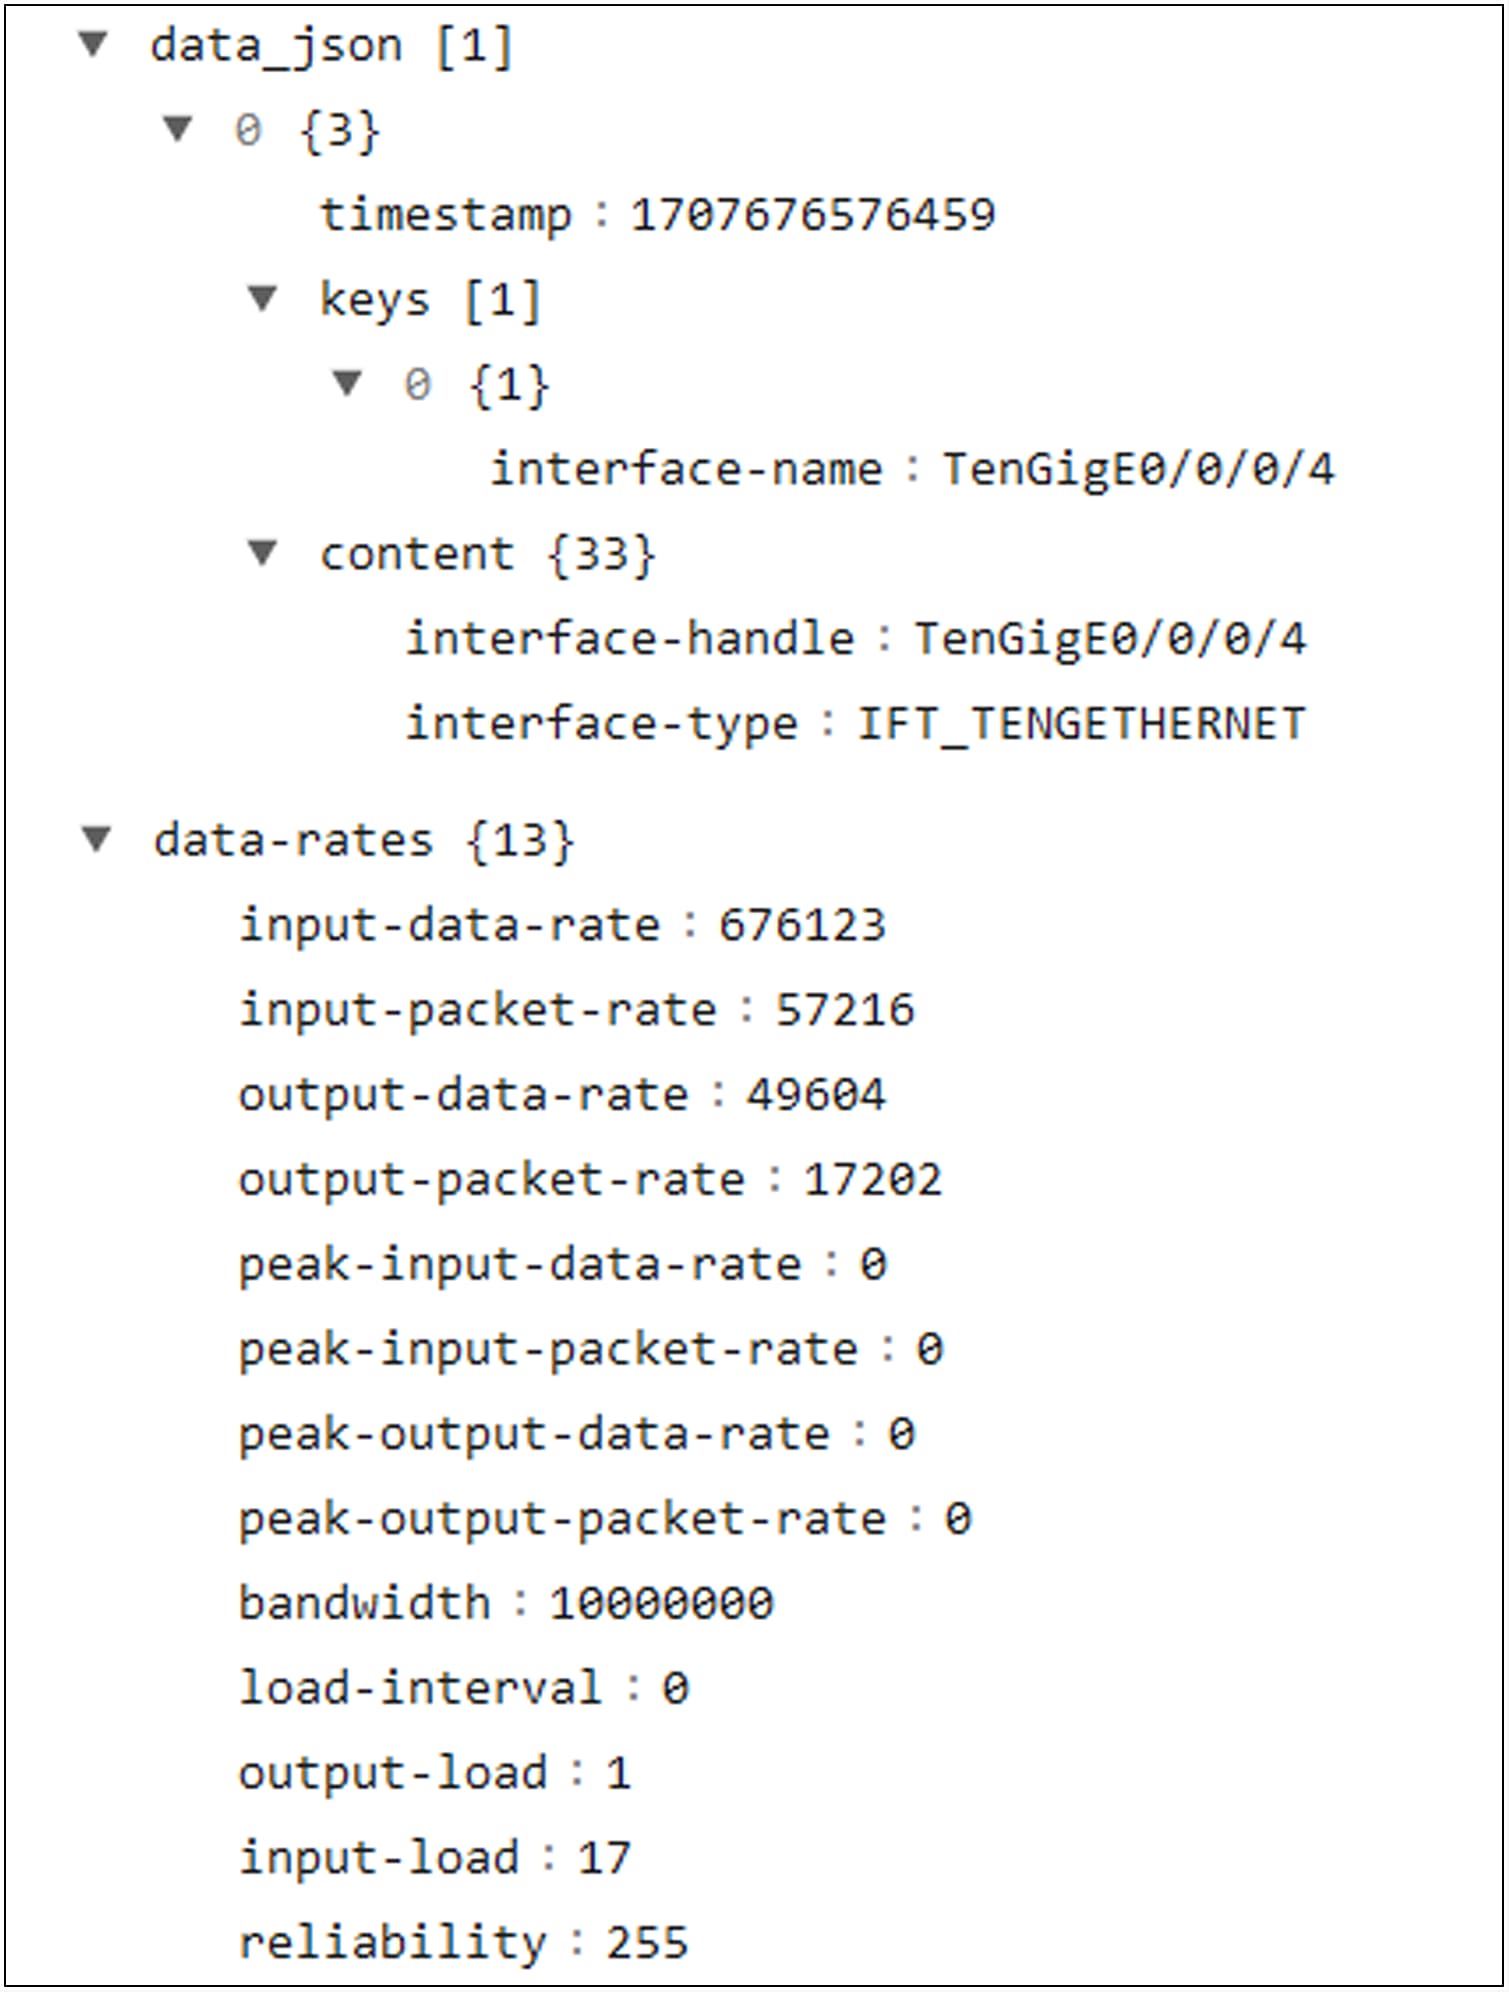
Input-packet-rate KPI
As this is a different container, if there is any requirement to stream only bandwidth, rate, or packets data (as a capacity team project) for a specific interface, we can use this telemetry sensor:
| <<router>>#run mdt_exec -s Cisco-IOS-XR-pfi-im-cmd-oper:interfaces/interface-xr/interface[interface-name=TenGigE0/0/0/4]/data-rates -c 10000
-------- {"node_id_str":"<<router>>","subscription_id_str":"app_TEST_200000001","encoding_path":"Cisco-IOS-XR-pfi-im-cmd-oper:interfaces/interface-xr/interface","collection_id":"45","collection_start_time":"1707676851080","msg_timestamp":"1707676851120","data_json":[{"timestamp":"1707676851118","keys":[{"interface-name":"TenGigE0/0/0/4"}],"content":{"data-rates":{"input-data-rate":"676131","input-packet-rate":"57217","output-data-rate":"49648","output-packet-rate":"17216","peak-input-data-rate":"0","peak-input-packet-rate":"0","peak-output-data-rate":"0","peak-output-packet-rate":"0","bandwidth":"10000000","load-interval":0,"output-load":1,"input-load":17,"reliability":255}}}],"collection_end_time":"1707676851120"} -------- |
2.5.4. Interface egress throughput
Interface egress throughput: This is a performance monitoring KPI and is an important network capacity planning KPI. It will indicate the traffic on the link and will help you validate your architecture baseline for the current subscribers on the network. The CLI command to display this KPI is:
| <<router>>#sh interfaces tenGigE 0/0/0/4 TenGigE0/0/0/4 is up, line protocol is up Interface state transitions: 1 Hardware is TenGigE, address is 28af.fdba.4008 (bia 28af.fdba.4008) Description: RU1 Internet address is Unknown MTU 8400 bytes, BW 10000000 Kbit (Max: 10000000 Kbit) reliability 255/255, txload 1/255, rxload 17/255 Encapsulation ARPA, Full-duplex, 10000Mb/s, 10GBASE-LR, link type is force-up output flow control is off, input flow control is off loopback not set, Last link flapped 02:08:02 Last input 00:00:00, output 00:00:00 Last clearing of "show interface" counters never 30 second input rate 676135000 bits/sec, 57219 packets/sec 30 second output rate 49942000 bits/sec, 17230 packets/sec 378359032 packets input, 558874311546 bytes, 0 total input drops 0 drops for unrecognized upper-level protocol Received 69 broadcast packets, 118422 multicast packets 0 runts, 0 giants, 0 throttles, 0 parity 0 input errors, 0 CRC, 0 frame, 0 overrun, 0 ignored, 0 abort 113937844 packets output, 41260657797 bytes, 0 total output drops Output 200 broadcast packets, 304843 multicast packets 0 output errors, 0 underruns, 0 applique, 0 resets 0 output buffer failures, 0 output buffers swapped out 1 carrier transitions |
The telemetry sensor and container stay the same as in Section 2.5.3. The new KPI is:
| {"node_id_str":"<<router>>","subscription_id_str":"app_TEST_200000001","encoding_path":"Cisco-IOS-XR-pfi-im-cmd-oper:interfaces/interface-xr/interface","collection_id":"45","collection_start_time":"1707676851080","msg_timestamp":"1707676851120","data_json":[{"timestamp":"1707676851118","keys":[{"interface-name":"TenGigE0/0/0/4"}],"content":{"data-rates":{"input-data-rate":"676131","input-packet-rate":"57217","output-data-rate":"49648","output-packet-rate":"17216","peak-input-data-rate":"0","peak-input-packet-rate":"0","peak-output-data-rate":"0","peak-output-packet-rate":"0","bandwidth":"10000000","load-interval":0,"output-load":1,"input-load":17,"reliability":255}}}],"collection_end_time":"1707676851120"} |
2.5.5. Interface ingress traffic rate
Interface ingress traffic rate: This is a performance monitoring KPI and is an important network capacity planning KPI. It will indicate the traffic rate on the link and will help you validate your architecture baseline for the current subscribers on the network. The CLI command to display this KPI is:
| <<router>>#sh interfaces tenGigE 0/0/0/9 TenGigE0/0/0/9 is up, line protocol is up Interface state transitions: 1 Hardware is TenGigE, address is 28af.fdba.400d (bia 28af.fdba.400d) Description: RU6 Internet address is Unknown MTU 8400 bytes, BW 10000000 Kbit (Max: 10000000 Kbit) reliability 255/255, txload 1/255, rxload 8/255 Encapsulation ARPA, Full-duplex, 10000Mb/s, 10GBASE-LR, link type is force-up output flow control is off, input flow control is off loopback not set, Last link flapped 02:29:54 Last input 00:00:00, output 00:00:00 Last clearing of "show interface" counters never 30 second input rate 337445000 bits/sec, 57217 packets/sec 30 second output rate 49160000 bits/sec, 13705 packets/sec 453400008 packets input, 334246569274 bytes, 0 total input drops 0 drops for unrecognized upper-level protocol Received 65 broadcast packets, 140720 multicast packets 0 runts, 0 giants, 0 throttles, 0 parity 0 input errors, 0 CRC, 0 frame, 0 overrun, 0 ignored, 0 abort 111519890 packets output, 51763548075 bytes, 0 total output drops Output 209 broadcast packets, 358937 multicast packets 0 output errors, 0 underruns, 0 applique, 0 resets 0 output buffer failures, 0 output buffers swapped out 1 carrier transitions |
The telemetry sensor stays the same as in Sections 2.5.1 and 2.5.3. We will look at this new leaf/KPI by running the command below.
| {"node_id_str":"<<router>>","subscription_id_str":"app_TEST_200000001","encoding_path":"Cisco-IOS-XR-pfi-im-cmd-oper:interfaces/interface-xr/interface","collection_id":"67","collection_start_time":"1707677583943","msg_timestamp":"1707677583985","data_json":[{"timestamp":"1707677583983","keys":[{"interface-name":"TenGigE0/0/0/9"}],"content":{"data-rates":{"input-data-rate":"337448","input-packet-rate":"57217","output-data-rate":"49177","output-packet-rate":"13707","peak-input-data-rate":"0","peak-input-packet-rate":"0","peak-output-data-rate":"0","peak-output-packet-rate":"0","bandwidth":"10000000","load-interval":0,"output-load":1,"input-load":8,"reliability":255}}}],"collection_end_time":"1707677583985"} |
The interesting observation here is the data type of the two data retrieval methods (CLI and JSON). They look different, don’t they? The CLI data type is “bits/sec” as we can see below. What about the JSON data type?
| 30 second input rate 337445000 bits/sec, 57217 packets/sec "input-data-rate":"337448" |
We will jump back into the data model at GitHub and search for this information:
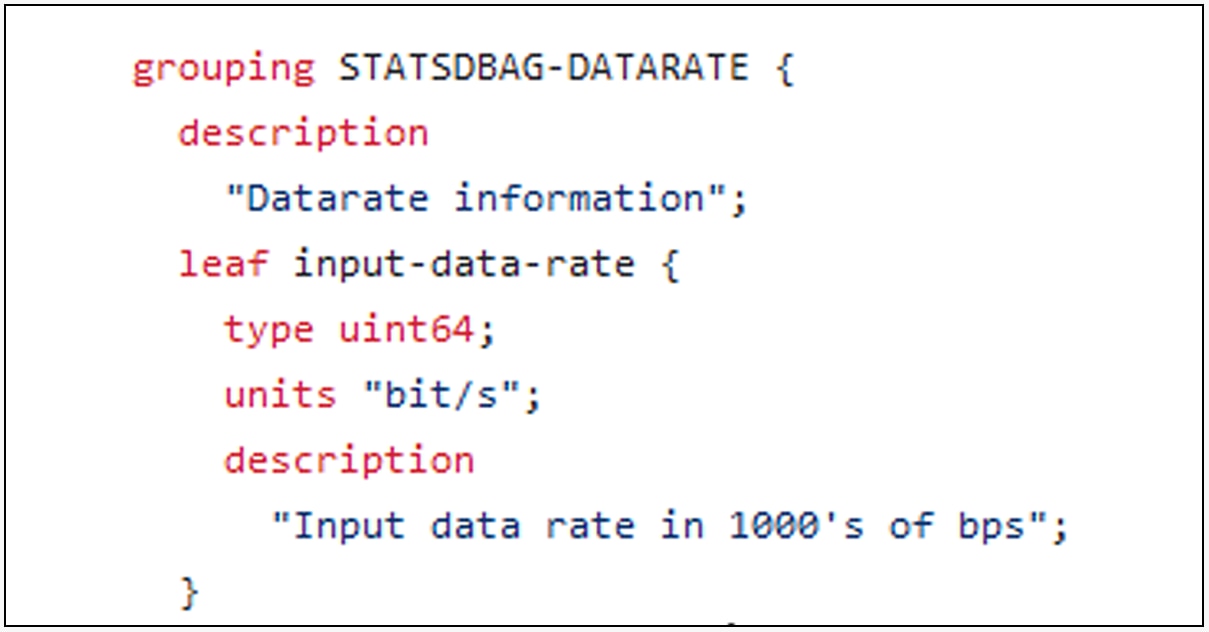
Description of our data rate KPI
There you have it. The input data rate is in thousands of bits per second. So 337448 is essentially 337,448,000 bits per second, which is the same as the CLI data.
2.5.6. Interface egress traffic rate
Interface egress traffic rate: This is a performance monitoring KPI and is an important network capacity planning KPI. It will indicate the traffic rate on the link and will help you validate your architecture baseline for the current subscribers on the network. The CLI command to display this KPI is:
| <<router>>#sh interfaces tenGigE 0/0/0/9 TenGigE0/0/0/9 is up, line protocol is up Interface state transitions: 1 Hardware is TenGigE, address is 28af.fdba.400d (bia 28af.fdba.400d) Description: RU6 Internet address is Unknown MTU 8400 bytes, BW 10000000 Kbit (Max: 10000000 Kbit) reliability 255/255, txload 1/255, rxload 8/255 Encapsulation ARPA, Full-duplex, 10000Mb/s, 10GBASE-LR, link type is force-up output flow control is off, input flow control is off loopback not set, Last link flapped 02:29:54 Last input 00:00:00, output 00:00:00 Last clearing of "show interface" counters never 30 second input rate 337445000 bits/sec, 57217 packets/sec 30 second output rate 49160000 bits/sec, 13705 packets/sec 453400008 packets input, 334246569274 bytes, 0 total input drops 0 drops for unrecognized upper-level protocol Received 65 broadcast packets, 140720 multicast packets 0 runts, 0 giants, 0 throttles, 0 parity 0 input errors, 0 CRC, 0 frame, 0 overrun, 0 ignored, 0 abort 111519890 packets output, 51763548075 bytes, 0 total output drops Output 209 broadcast packets, 358937 multicast packets 0 output errors, 0 underruns, 0 applique, 0 resets 0 output buffer failures, 0 output buffers swapped out 1 carrier transitions |
The telemetry sensor stays the same as in Sections 2.5.1 and 2.5.3. We will look at this new leaf/KPI by running the command below.
| {"node_id_str":"<<router>>","subscription_id_str":"app_TEST_200000001","encoding_path":"Cisco-IOS-XR-pfi-im-cmd-oper:interfaces/interface-xr/interface","collection_id":"67","collection_start_time":"1707677583943","msg_ timestamp":"1707677583985","data_json":[{"timestamp":"1707677583983","keys":[{"interface-name":"TenGigE0/0/0/9"}],"content":{"data-rates":{"input-data-rate":"337448","input-packet-rate":"57217","output-data-rate":"49177","output-packet-rate":"13707","peak-input-data-rate":"0","peak-input-packet-rate":"0","peak-output-data-rate":"0","peak-output-packet-rate":"0","bandwidth":"10000000","load-interval":0,"output-load":1,"input-load":8,"reliability":255}}}],"collection_end_time":"1707677583985"} |
From what we learned with the exercise we did for Section 2.5.5; this data is 49177 x 1000 bps or 49,177,000 bps or ~49 Mbps.
2.5.7. Interface ingress bandwidth utilization
Interface ingress bandwidth utilization: This is a composite KPI that won’t be streamed from the platform; we will build it outside the network. We will use two KPIs to derive the interface ingress bandwidth utilization.
The CLI command to verify the two KPIs on the platform is:
| <<router>>#sh interfaces tenGigE 0/0/0/8 TenGigE0/0/0/8 is up, line protocol is up Interface state transitions: 11 Hardware is TenGigE, address is 3473.2d86.3f0c (bia 3473.2d86.3f0c) Description: RU5 Internet address is Unknown MTU 8400 bytes, BW 10000000 Kbit (Max: 10000000 Kbit) reliability 255/255, txload 1/255, rxload 8/255 Encapsulation ARPA, Full-duplex, 10000Mb/s, 10GBASE-LR, link type is force-up output flow control is off, input flow control is off loopback not set, Last link flapped 6d16h Last input 00:00:00, output 00:00:00 Last clearing of "show interface" counters never 30 second input rate 337453000 bits/sec, 57219 packets/sec 30 second output rate 41986000 bits/sec, 13997 packets/sec 476001609646 packets input, 350912969723422 bytes, 0 total input drops 0 drops for unrecognized upper-level protocol Received 54 broadcast packets, 141847443 multicast packets 0 runts, 0 giants, 0 throttles, 0 parity 0 input errors, 0 CRC, 0 frame, 0 overrun, 0 ignored, 0 abort 119700917505 packets output, 45404468451208 bytes, 0 total output drops Output 546 broadcast packets, 344201640 multicast packets 0 output errors, 0 underruns, 0 applique, 0 resets 0 output buffer failures, 0 output buffers swapped out 11 carrier transitions |
The telemetry sensor for both KPIs/leaves with the data model and the container information can be found with this command:
| <<router>>#yang-describe operational show interfaces tenGigE 0/0/0/8 YANG Paths: Cisco-IOS-XR-pfi-im-cmd-oper:interfaces/interface-xr/interface |
We will explore the two KPIs/leaves now as part of the JSON data:
| <<router>>#show yang operational pfi-im-cmd-oper:interfaces interfaces interface JSON { "Cisco-IOS-XR-pfi-im-cmd-oper:interfaces": { "interfaces": { "interface": [ { "interface-name": "TenGigE0/0/0/8", "interface-handle": "TenGigE0/0/0/8", "interface-type": "IFT_TENGETHERNET", "hardware-type-string": "TenGigE", "state": "im-state-up", "line-state": "im-state-up", "encapsulation": "ether", "encapsulation-type-string": "ARPA", "mtu": 8400, "is-l2-transport-enabled": false, "state-transition-count": 11, "last-state-transition-time": "1707102454646967921", "is-dampening-enabled": false, "speed": 10000000, "duplexity": "im-attr-duplex-full", "media-type": "im-attr-media-10gbase-lr", "link-type": "im-attr-link-type-force", "in-flow-control": "im-attr-flow-control-off", "out-flow-control": "im-attr-flow-control-off", "mac-address": { "address": "34:73:2d:86:3f:0c" }, "burned-in-address": { "address": "34:73:2d:86:3f:0c" }, "carrier-delay": { "carrier-delay-up": 0, "carrier-delay-down": 0 }, "bandwidth": "10000000", "max-bandwidth": "10000000", "is-l2-looped": false, "loopback-configuration": "no-loopback", "description": "RU5", "fast-shutdown": false, "data-rates": { "input-data-rate": "337457", "input-packet-rate": "57219", "output-data-rate": "41965", "output-packet-rate": "13987", "peak-input-data-rate": "0", "peak-input-packet-rate": "0", "peak-output-data-rate": "0", "peak-output-packet-rate": "0", "bandwidth": "10000000", "load-interval": 0, "output-load": 1, |
The first KPI is “bandwidth,” and the data type is defined in the data model as shown below:
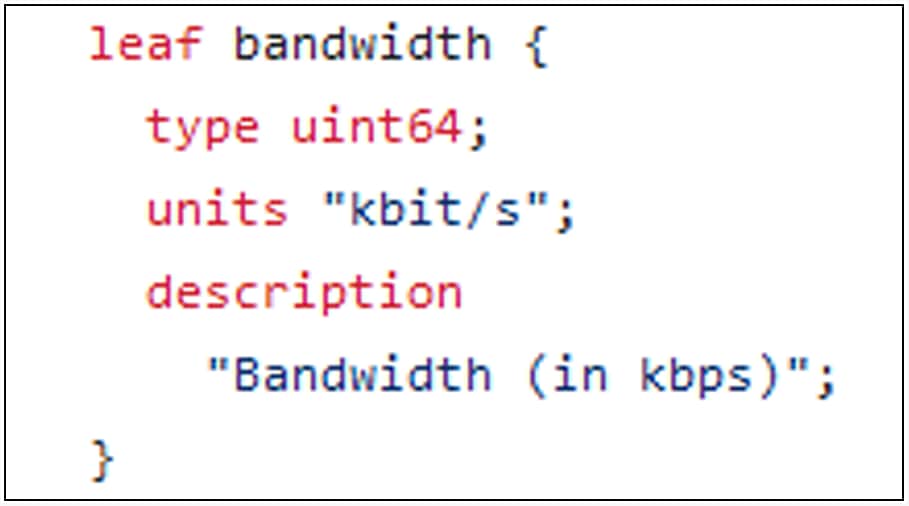
Data type of the bandwidth KPI
The second KPI is interface ingress traffic rate and is well captured in Section 2.5.5 along with the data type.
Now we will formulate the composite KPI by using the above two KPIs.
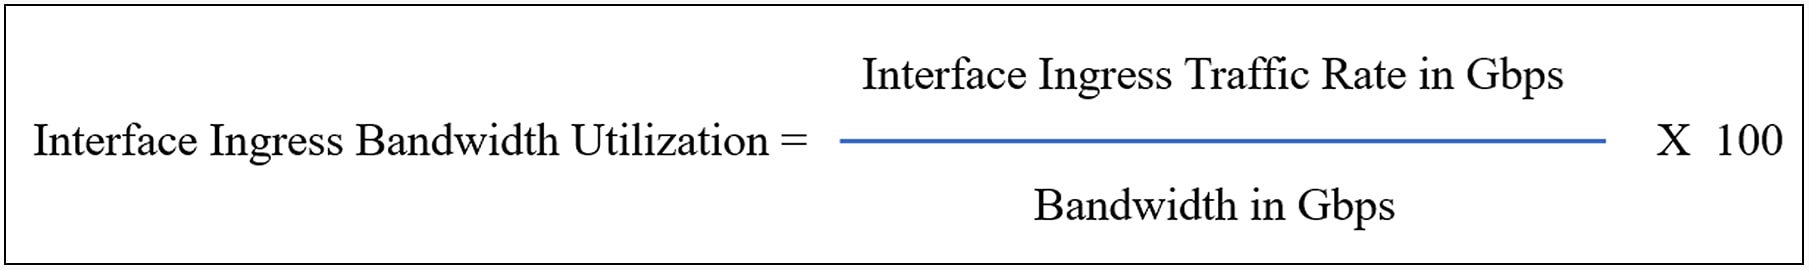
Composite KPI formula
From the above example, the interface ingress traffic rate in Gbps (KPI-1) is 0.34 Gbps. The bandwidth (KPI-2) in Gbps is 10. The composite KPI, interface ingress bandwidth utilization, is (0.34/10) x 100, or 3.4%.
2.5.8. Interface egress bandwidth utilization
Interface egress bandwidth utilization: This is a composite KPI that won’t be streamed from the platform; we will build it outside the network. We will use two KPIs to derive the interface egress bandwidth utilization.
The CLI command to verify the two KPIs on the platform is:
| <<router>>#sh interfaces tenGigE 0/0/0/8 TenGigE0/0/0/8 is up, line protocol is up Interface state transitions: 11 Hardware is TenGigE, address is 3473.2d86.3f0c (bia 3473.2d86.3f0c) Description: RU5 Internet address is Unknown MTU 8400 bytes, BW 10000000 Kbit (Max: 10000000 Kbit) reliability 255/255, txload 1/255, rxload 8/255 Encapsulation ARPA, Full-duplex, 10000Mb/s, 10GBASE-LR, link type is force-up output flow control is off, input flow control is off loopback not set, Last link flapped 6d16h Last input 00:00:00, output 00:00:00 Last clearing of "show interface" counters never 30 second input rate 337453000 bits/sec, 57219 packets/sec 30 second output rate 41986000 bits/sec, 13997 packets/sec 476001609646 packets input, 350912969723422 bytes, 0 total input drops 0 drops for unrecognized upper-level protocol Received 54 broadcast packets, 141847443 multicast packets 0 runts, 0 giants, 0 throttles, 0 parity 0 input errors, 0 CRC, 0 frame, 0 overrun, 0 ignored, 0 abort 119700917505 packets output, 45404468451208 bytes, 0 total output drops Output 546 broadcast packets, 344201640 multicast packets 0 output errors, 0 underruns, 0 applique, 0 resets 0 output buffer failures, 0 output buffers swapped out 11 carrier transitions |
The telemetry sensor for both KPIs/leaves with the data model and the container information can be found with this command:
| <<router>>#yang-describe operational show interfaces tenGigE 0/0/0/8 YANG Paths: Cisco-IOS-XR-pfi-im-cmd-oper:interfaces/interface-xr/interface |
We will explore the two KPIs/leaves now as part of the JSON data:
| <<router>>#show yang operational pfi-im-cmd-oper:interfaces interfaces interface JSON { "Cisco-IOS-XR-pfi-im-cmd-oper:interfaces": { "interfaces": { "interface": [ { "interface-name": "TenGigE0/0/0/8", "interface-handle": "TenGigE0/0/0/8", "interface-type": "IFT_TENGETHERNET", "hardware-type-string": "TenGigE", "state": "im-state-up", "line-state": "im-state-up", "encapsulation": "ether", "encapsulation-type-string": "ARPA", "mtu": 8400, "is-l2-transport-enabled": false, "state-transition-count": 11, "last-state-transition-time": "1707102454646967921", "is-dampening-enabled": false, "speed": 10000000, "duplexity": "im-attr-duplex-full", "media-type": "im-attr-media-10gbase-lr", "link-type": "im-attr-link-type-force", "in-flow-control": "im-attr-flow-control-off", "out-flow-control": "im-attr-flow-control-off", "mac-address": { "address": "34:73:2d:86:3f:0c" }, "burned-in-address": { "address": "34:73:2d:86:3f:0c" }, "carrier-delay": { "carrier-delay-up": 0, "carrier-delay-down": 0 }, "bandwidth": "10000000", "max-bandwidth": "10000000", "is-l2-looped": false, "loopback-configuration": "no-loopback", "description": "RU5", "fast-shutdown": false, "data-rates": { "input-data-rate": "337457", "input-packet-rate": "57219", "output-data-rate": "41965", "output-packet-rate": "13987", "peak-input-data-rate": "0", "peak-input-packet-rate": "0", "peak-output-data-rate": "0", "peak-output-packet-rate": "0", "bandwidth": "10000000", "load-interval": 0, "output-load": 1, |
The first KPI is “bandwidth,” like what we used in Section 2.5.7.
The second KPI is interface egress traffic rate and is well captured in Section 2.5.5, along with the data type.
Now we will formulate the composite KPI by using the above two KPIs.
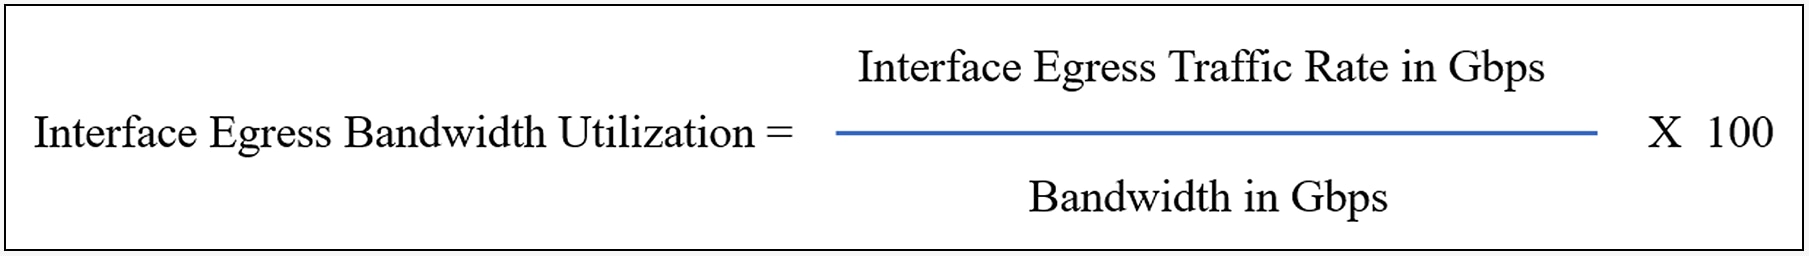
Composite KPI formula
From the above example, the interface egress traffic rate in Gbps (KPI-1) is 0.04 Gbps. The bandwidth (KPI-2) in Gbps is 10. The composite KPI, interface egress bandwidth utilization, is (0.04/10) x 100, or 0.4%.
2.5.9. Total device throughout
Total device throughput: This is another composite KPI that can be built by combining two individual KPIs (interface ingress traffic rate and interface egress traffic rate) and summing them across all interfaces in the device at the same timestamp. For example, if there are five interfaces on the router, the CLI command to fetch the input/output rate of those five interfaces is:
| <<router>>#show interfaces TengigE 0/0/0/4 | inc rate 30 second input rate 330814000 bits/sec, 56092 packets/sec 30 second output rate 43576000 bits/sec, 16996 packets/sec <<router>>##show interfaces TengigE 0/0/0/5 | inc rate 30 second input rate 1011671000 bits/sec, 111003 packets/sec 30 second output rate 50367000 bits/sec, 16551 packets/sec <<router>>##show interfaces TengigE 0/0/0/6 | inc rate 30 second input rate 337444000 bits/sec, 57217 packets/sec 30 second output rate 43014000 bits/sec, 15639 packets/sec <<router>>##show interfaces TengigE 0/0/0/7 | inc rate 30 second input rate 1031851000 bits/sec, 113217 packets/sec 30 second output rate 154045000 bits/sec, 25006 packets/sec <<router>>##show interfaces TengigE 0/0/0/8 | inc rate 30 second input rate 337455000 bits/sec, 57218 packets/sec 30 second output rate 42044000 bits/sec, 14036 packets/sec |
The telemetry sensor with the data model and the container information is mentioned in Sections 2.5.5 and 2.5.6, so we will not revisit that information.
The formula for this composite KPI is:
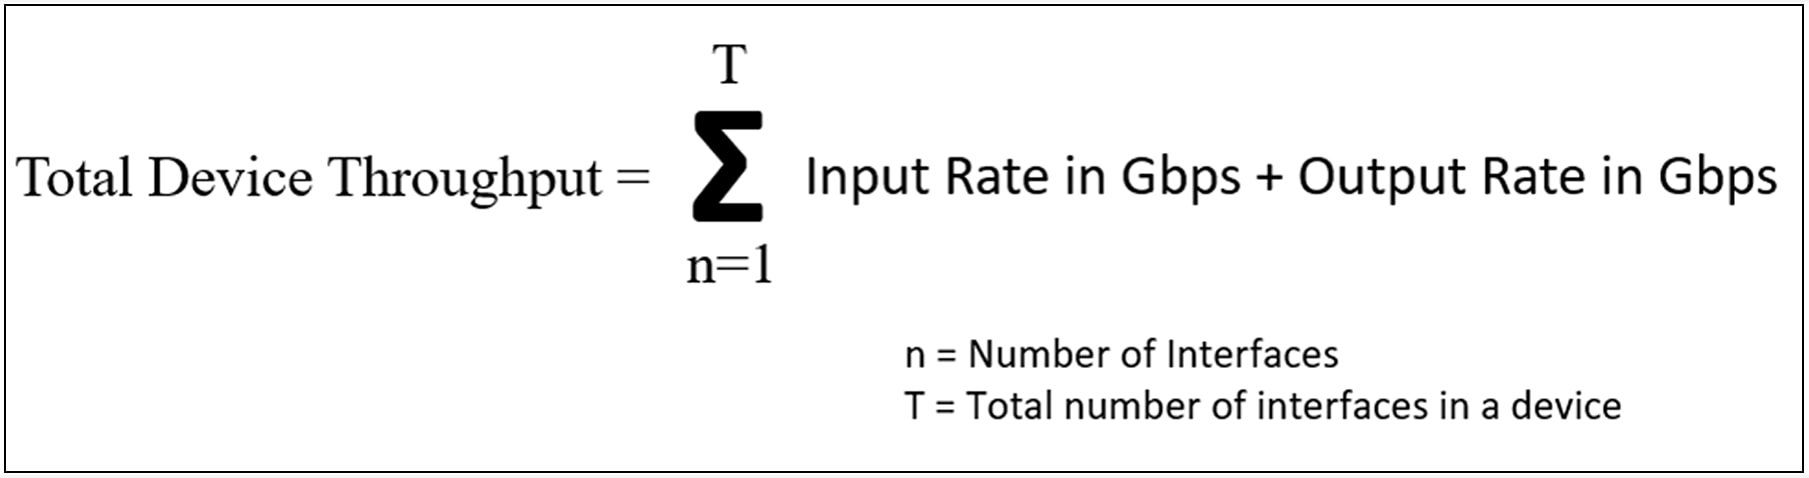
Composite KPI formula
From the above example, the total device throughput in Gbps is: total input rate of 5 interfaces in Gbps + total output rate of 5 interfaces in Gbps in the same timestamp, which is 1.21 Gbps + 0.18 Gbps = 1.39 Gbps.
Interface flaps: This is a performance monitoring KPI and is determined by the “carrier transitions” output on an interface in a router. The CLI command to display this KPI is:
| <<router>>#sh interfaces tenGigE 0/0/0/6 TenGigE0/0/0/6 is up, line protocol is up Interface state transitions: 7 Hardware is TenGigE, address is 74ad.9802.4a0a (bia 74ad.9802.4a0a) Description: RU3 Internet address is Unknown MTU 8400 bytes, BW 10000000 Kbit (Max: 10000000 Kbit) reliability 255/255, txload 1/255, rxload 8/255 Encapsulation ARPA, Full-duplex, 10000Mb/s, 10GBASE-LR, link type is force-up output flow control is off, input flow control is off loopback not set, Last link flapped 2w3d Last input 00:00:00, output 00:00:00 Last clearing of "show interface" counters never 30 second input rate 337447000 bits/sec, 57217 packets/sec 30 second output rate 42556000 bits/sec, 15591 packets/sec 444276630851 packets input, 327525276136221 bytes, 0 total input drops 0 drops for unrecognized upper-level protocol Received 14 broadcast packets, 132014762 multicast packets 0 runts, 0 giants, 0 throttles, 0 parity 0 input errors, 0 CRC, 0 frame, 0 overrun, 0 ignored, 0 abort 121741665264 packets output, 41812047144034 bytes, 0 total output drops Output 796 broadcast packets, 320342411 multicast packets 0 output errors, 0 underruns, 0 applique, 0 resets 0 output buffer failures, 0 output buffers swapped out 8 carrier transitions |
The telemetry sensor stays the same as in Section 2.5.1. We will look at this new leaf/KPI on Cisco’s YANG explorer.
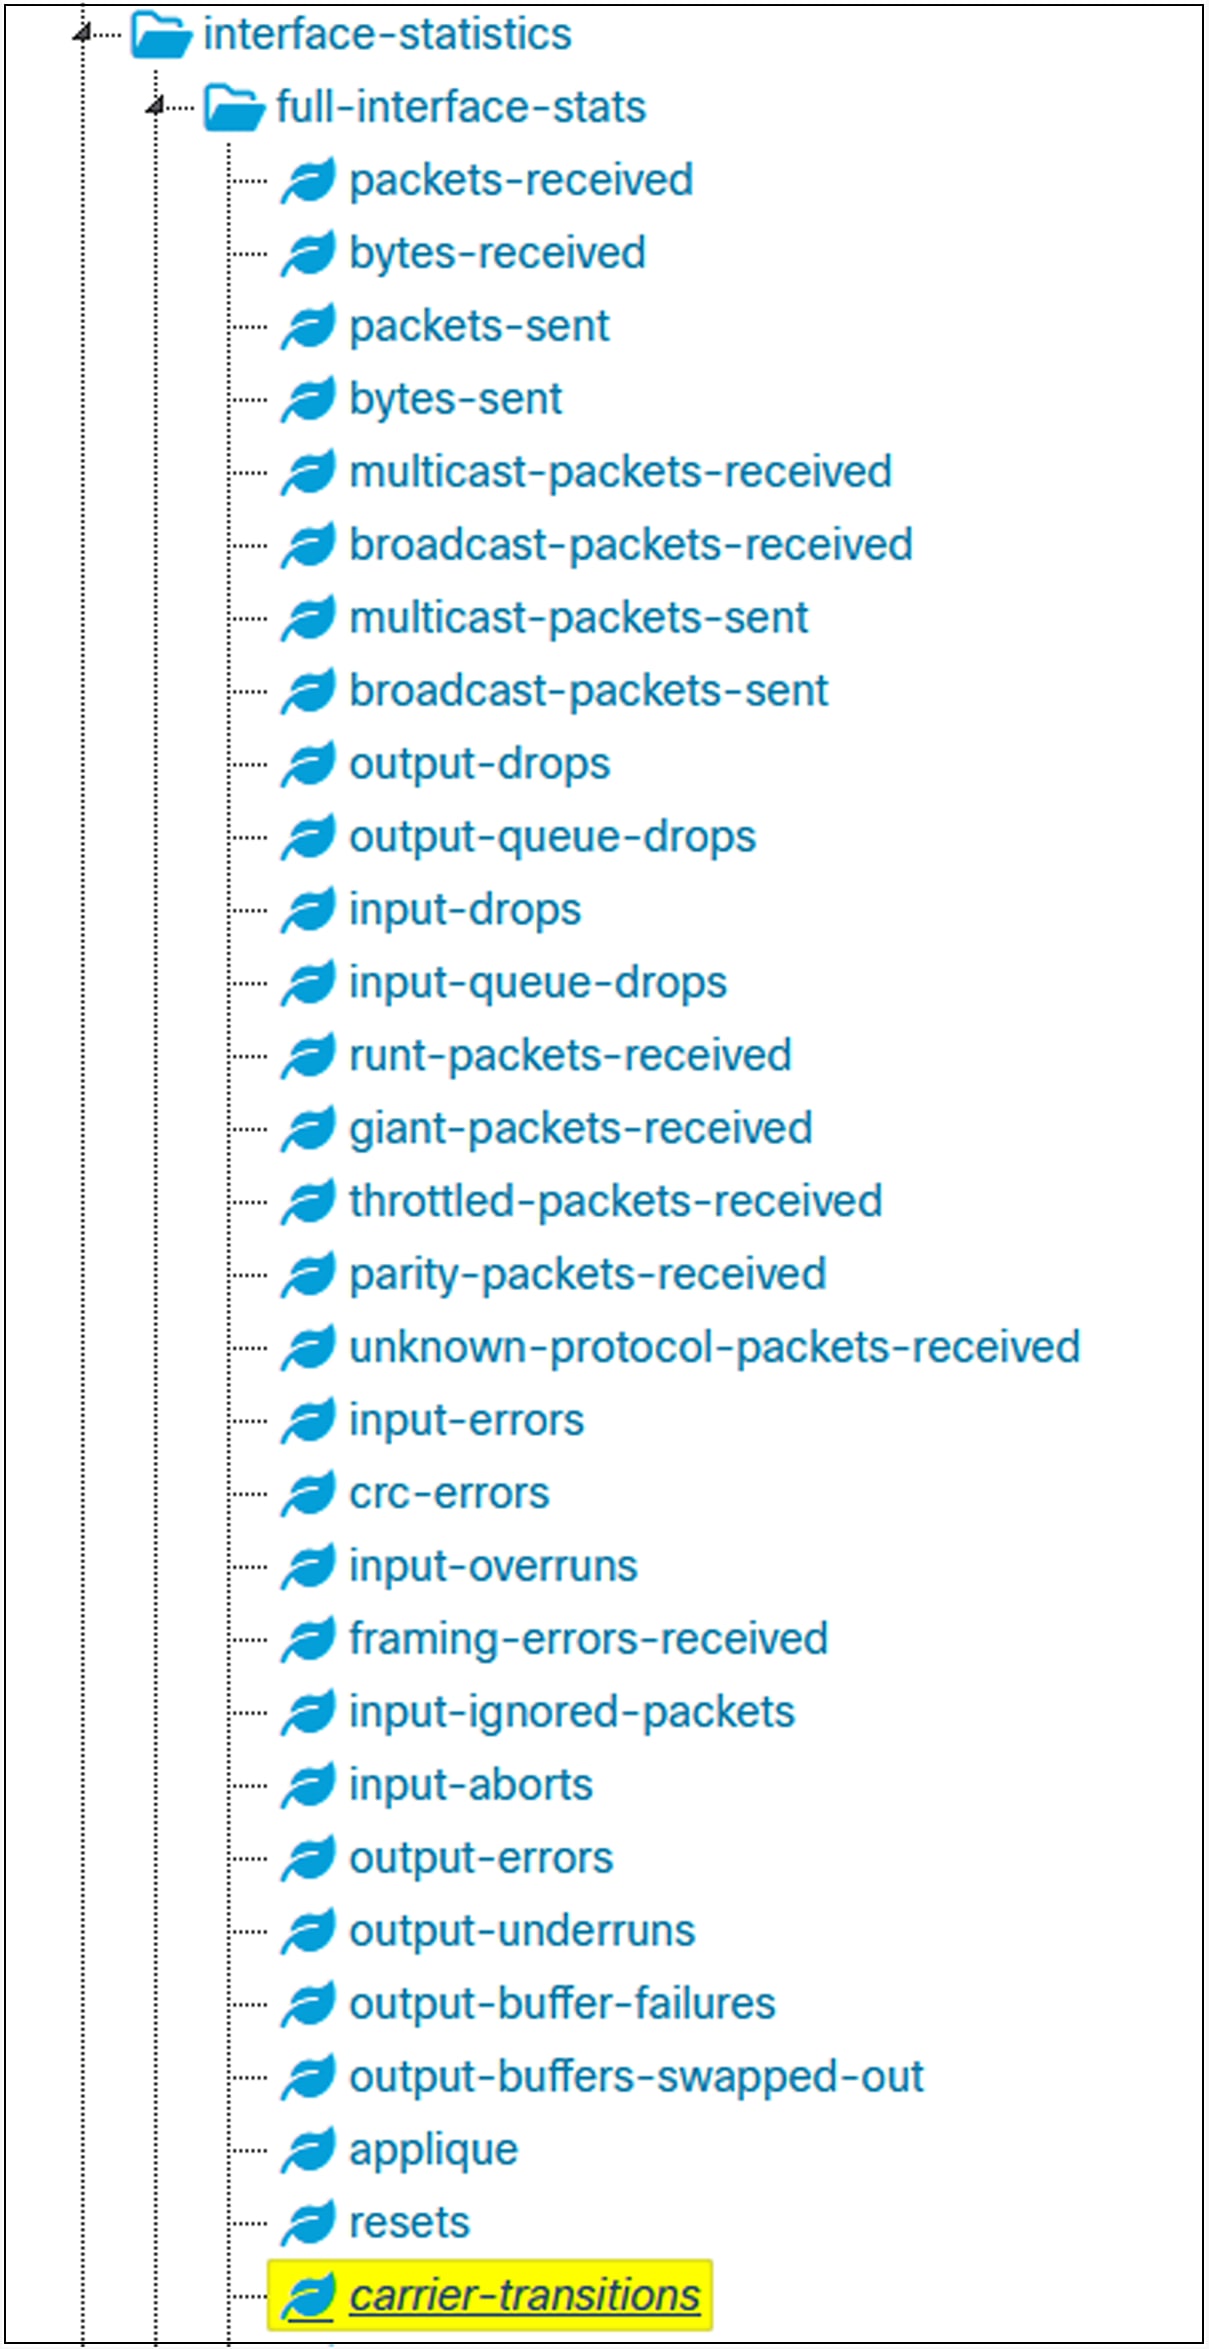
carrier-transitions KPI
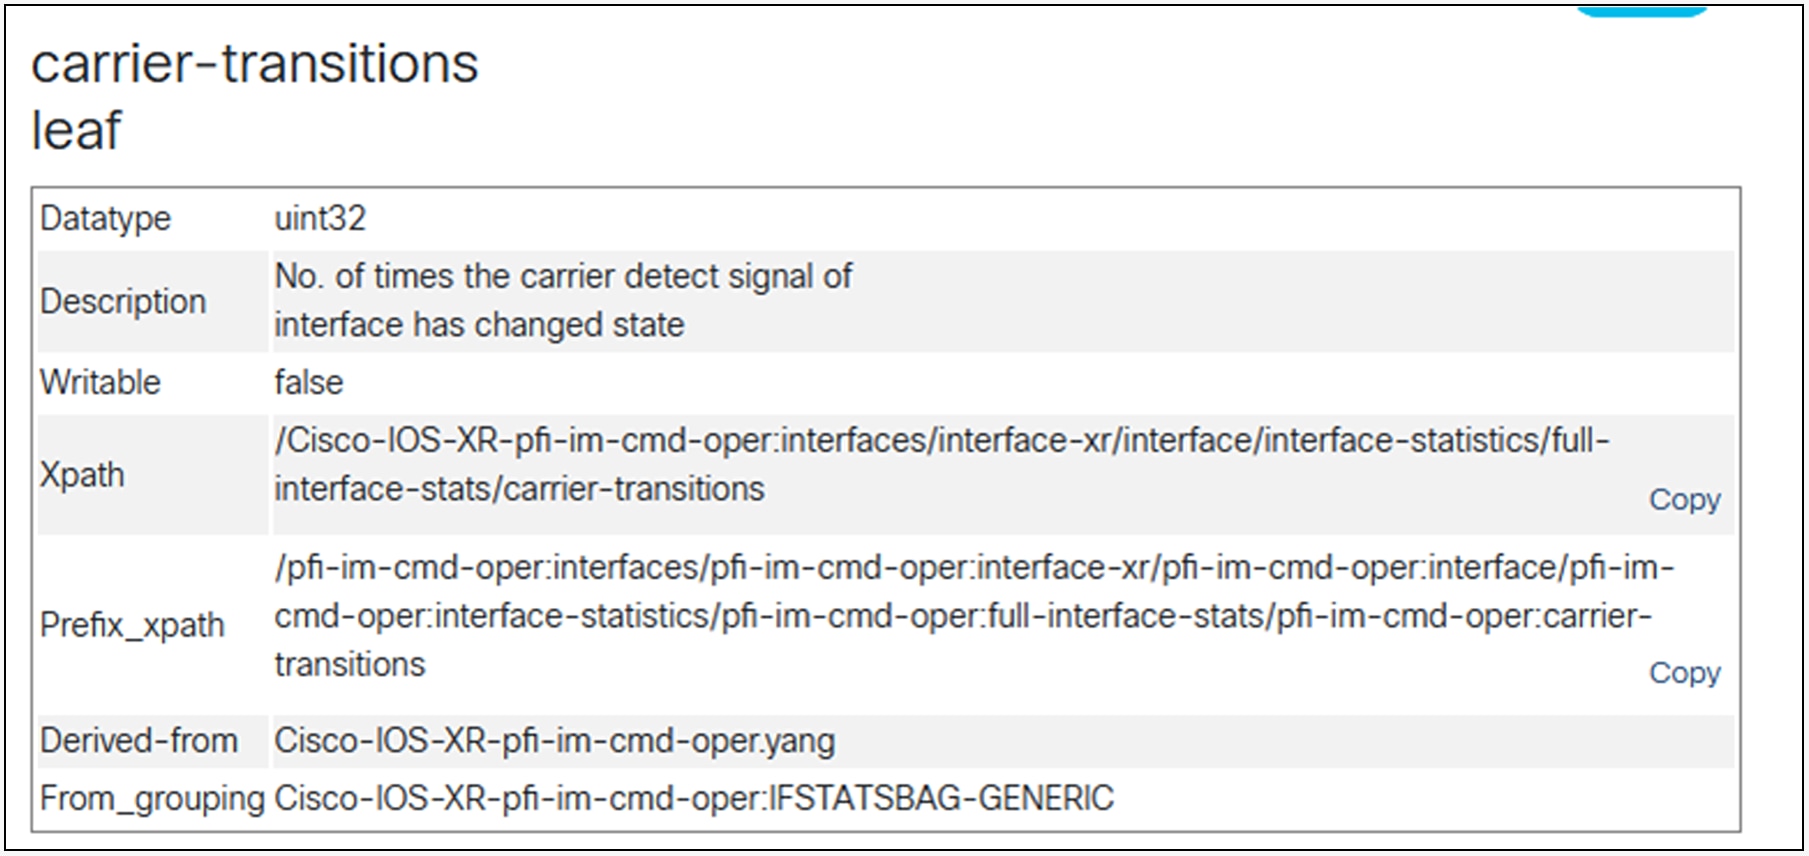
Description and Xpath for this KPI
Now we need to understand that this KPI streamed from the router is not an accurate representation of cumulative interface flaps on the router. For that, we need to build a customized KPI definition on our monitoring system by studying data from subsequent samples (at regular sample intervals).
For example, the value of carrier transitions at 07:00 hours is 8 (as shown in the above CLI command), and it might be 12 at 08:00 hours. This means that the interface flapped four times in the last hour. So it is better to track interface flaps as a customized KPI rather than monitoring carrier transitions. Another reason for implementing this customized KPI is to circumvent the effect of a router reboot. When the router comes back up (let us say, at 11:00 hours on the same day), the carrier transitions KPI value will show 0, which doesn’t mean that the interface hasn’t flapped at all the entire day. This is when the customized interface flaps KPI provides the correct value to a network operator, as the value becomes 4 (4 – 0) and is the correct indication of the number of times the interface flapped in the day.
A flap is an admin state transition of an interface from up to down and back to up.
Interface errors: This is a performance monitoring KPI that helps you understand if your “network” traffic, which is a mix of user plane, control plane, management plane, and synchronization plane for 5G networks, is free of errors and drops. The CLI command to display this KPI is:
| <<router>>#sh controllers tenGigE0/0/0/19 stats | inc error Input error giant = 0 Input error runt = 0 Input error jabbers = 0 Input error fragments = 0 Input error CRC = 0 Input error collisions = 0 Input error symbol = 0 Input error other = 0 Output error other = 0 |
The telemetry sensor and the container to pull this data out of the router are as follows:
| <<router>>#yang-describe operational sh controllers tenGigE0/0/0/19 stats YANG Paths: Cisco-IOS-XR-drivers-media-eth-oper:ethernet-interface/statistics/statistic |
It is important to note that this telemetry sensor is applicable only to physical routers where “ethernet” is a valid media type. For virtual routers, this sensor won’t work.
Now let us look at this data from the above sensor/data model/container hierarchy:
| <<router>>#show yang operational drivers-media-eth-oper:ethernet-interface statistics statistic JSON { "Cisco-IOS-XR-drivers-media-eth-oper:ethernet-interface": { "statistics": { "statistic": [ { "interface-name": "TenGigE0/0/0/19",
// Output truncated for relevance //
"number-of-buffer-overrun-packets-dropped": "0", "number-of-aborted-packets-dropped": "0", "numberof-invalid-vlan-id-packets-dropped": "0", "invalid-dest-mac-drop-packets": "0", "invalid-encap-drop-packets": "0", "number-of-miscellaneous-packets-dropped": "0", "dropped-giant-packets-greaterthan-mru": "0", "dropped-ether-stats-undersize-pkts": "0", "dropped-jabbers-packets-greaterthan-mru": "0", "dropped-ether-stats-fragments": "0", "dropped-packets-with-crc-align-errors": "0", "ether-stats-collisions": "0", "symbol-errors": "0", "dropped-miscellaneous-error-packets": "0", "rfc2819-ether-stats-oversized-pkts": "0", "rfc2819-ether-stats-jabbers": "0", "rfc2819-ether-stats-crc-align-errors": "0", "rfc3635dot3-stats-alignment-errors": "0", "buffer-underrun-packet-drops": "0", "aborted-packet-drops": "0", "uncounted-dropped-frames": "0", "miscellaneous-output-errors": "0" }, // Output truncated for relevance // |
You must be wondering, how are these “JSON” variables mapped to our initially observed KPIs on the CLI output, right?
Well, there is no documented mapping between the JSON variable and the CLI output, but here is the data for your benefit.
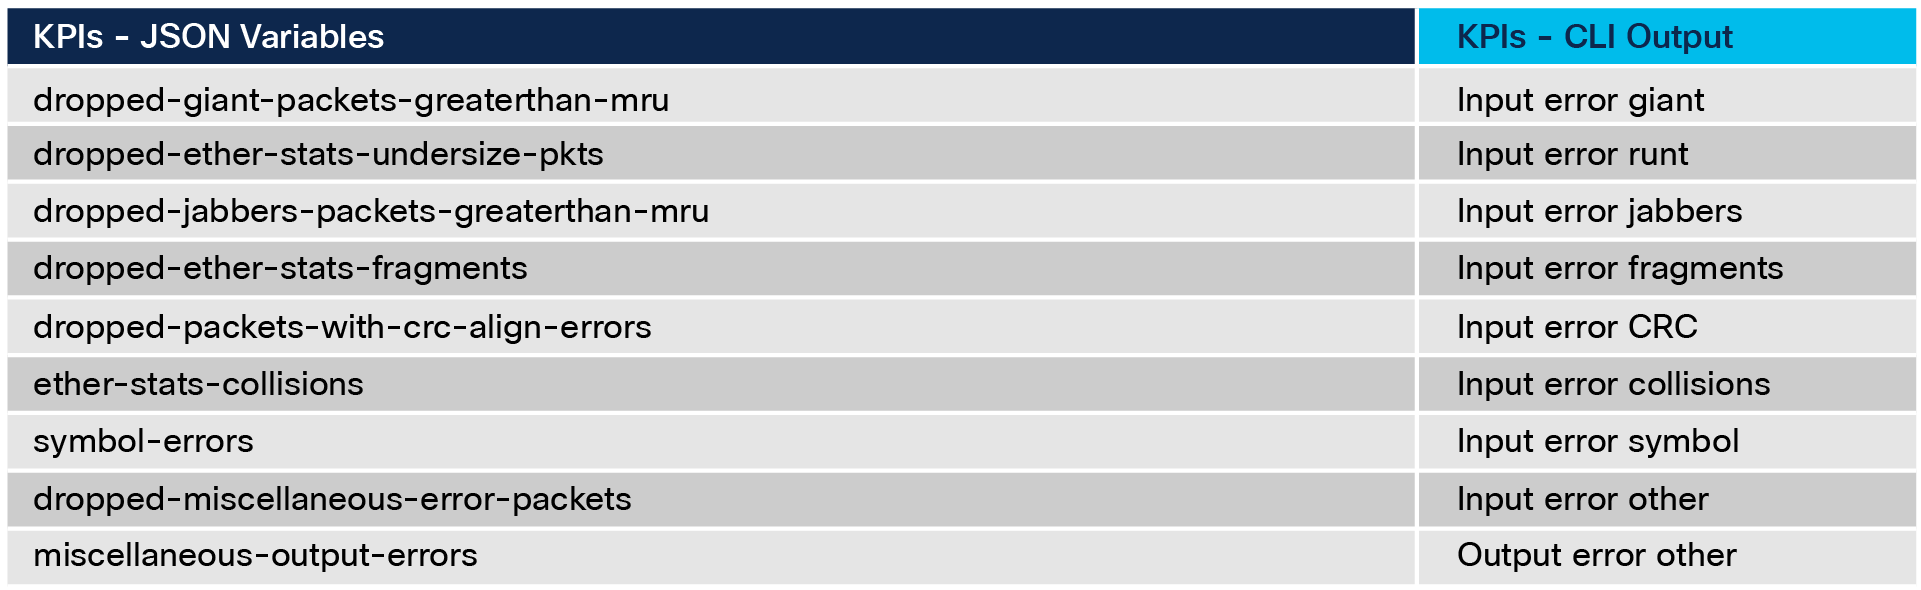
JSON to CLI mapping – interface errors
Interface input drops: This KPI gives the traffic drops at the ingress or input of an interface.
The CLI command to verify input drops on an interface of a cell site router is as follows:
| <<router>>#sh controllers tenGigE0/0/0/19 stats | inc “Input drop” Input drop overrun = 0 Input drop abort = 0 Input drop invalid VLAN = 0 Input drop invalid DMAC = 0 Input drop invalid encap = 0 Input drop other = 0 |
The telemetry sensor and the container information are the same as in Section 2.5.11. Let us jump into the JSON to CLI mapping instead.
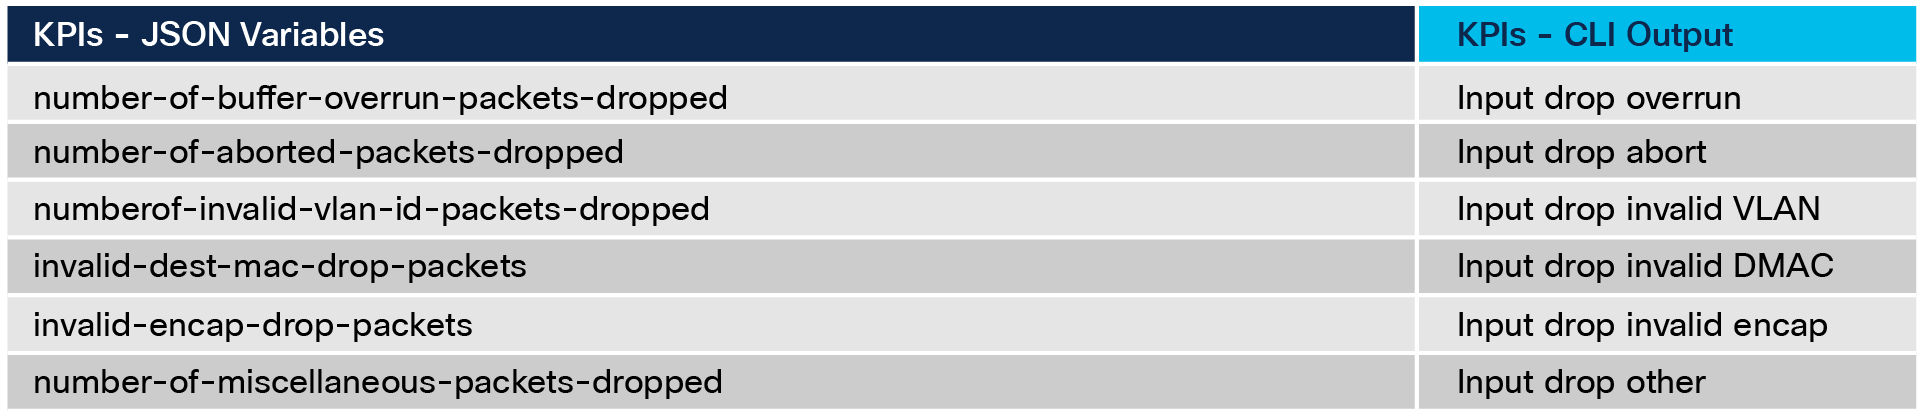
Interface input drops
2.5.13. Interface output drops
Interface output drops: This KPI gives the traffic drops at the egress or output of an interface.
The CLI command to verify output drops on an interface of a cell site router is:
| <<router>>#sh controllers tenGigE0/0/0/19 stats | inc “Output drop” Output drop underrun = 0 Output drop abort = 0 Output drop other = 0 |
The telemetry sensor and the container information are the same as in Section 2.5.11. Let us jump into the JSON to CLI mapping instead.
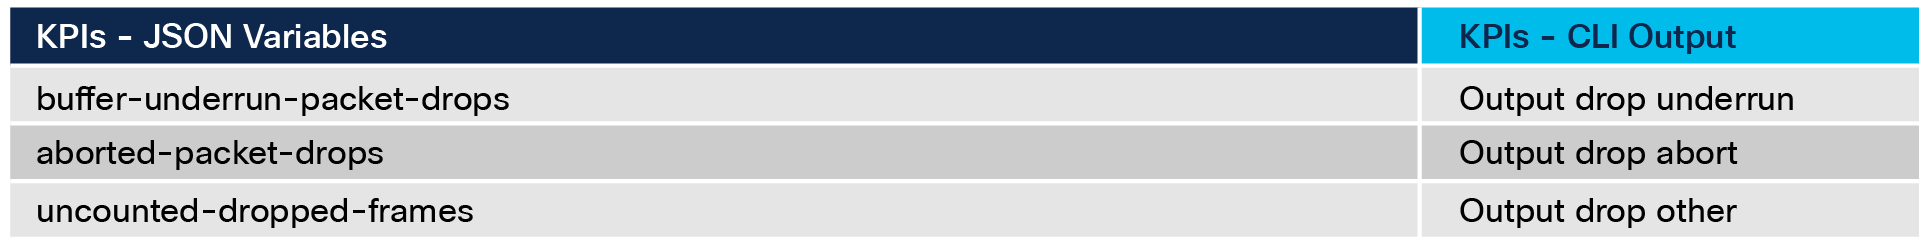
Interface output drops
MTU profiling: This KPI gives the Maximum Transmission Unit (MTU) size of traffic in the network. It is a great architecture definition KPI to use to implement a networkwide MTU based on the traffic MTU size.
The CLI command to verify the MTU profile on an interface of a cell site router is:
| <<router>>#sh controllers tenGigE0/0/0/19 stats | inc bytes
Input pkts 64 bytes = 713302 Input pkts 65-127 bytes = 529268013 Input pkts 128-255 bytes = 38564710 Input pkts 256-511 bytes = 10340175 Input pkts 512-1023 bytes = 9449514 Input pkts 1024-1518 bytes = 56371663 Input pkts 1519-Max bytes = 68092873 Output pkts 64 bytes = 1252 Output pkts 65-127 bytes = 513115440 Output pkts 128-255 bytes = 46377526 Output pkts 256-511 bytes = 112456235 Output pkts 512-1023 bytes = 4172493 Output pkts 1024-1518 bytes = 6525201 Output pkts 1519-Max bytes = 398528777 |
The telemetry sensor and the container information are the same as in Section 2.5.11:
| <<router>>#show yang operational drivers-media-eth-oper:ethernet-interface statistics statistic JSON { "Cisco-IOS-XR-drivers-media-eth-oper:ethernet-interface": { "statistics": { "statistic": [ { "interface-name": "TenGigE0/0/0/19", "received-total64-octet-frames": "0", "received-total-octet-frames-from65-to127": "0", "received-total-octet-frames-from128-to255": "185317", "received-total-octet-frames-from256-to511": "0", "received-total-octet-frames-from512-to1023": "0", "received-total-octet-frames-from1024-to1518": "0", "received-total-octet-frames-from1519-to-max": "0",
// Output truncated for relevance //
"transmitted-total64-octet-frames": "0", "transmitted-total-octet-frames-from65-to127": "0", "transmitted-total-octet-frames-from128-to255": "185317", "transmitted-total-octet-frames-from256-to511": "0", "transmitted-total-octet-frames-from512-to1023": "0", "transmitted-total-octet-frames-from1024-to1518": "0", "transmitted-total-octet-frames-from1518-to-max": "0",
// Output truncated for relevance //
}, |
Now you can pull this data for all interfaces of all devices in the network and build your MTU profiling characterization. This will help you recommend the MTU size of the end-to-end network.
BGP connection state: This is a critical transport KPI that monitors the state of the Border Gateway Protocol (BGP) connections of the cell site routers with either provider edge routers or route reflectors. The CLI command used to verify this KPI is:
| <<router>>#sh bgp neighbor brief
Neighbor Spk AS Description Up/Down NBRState 10.112.13.230 0 398378 <<router-1>> 3w6d Established 10.112.13.232 0 398378 <<router-2>> 3w6d Established |
The telemetry sensor with the data model and the container information can be found with this command:
| <<router>>#yang-describe operational show bgp neighbor brief YANG Paths: Cisco-IOS-XR-ipv4-bgp-oper:bgp/bpm-instances-table/bpm-instances Cisco-IOS-XR-ipv4-bgp-oper:bgp/instances/instance/instance-active/default-vrf/sessions/session Cisco-IOS-XR-ipv4-bgp-oper:bgp/instances/instance/instance-active/vrfs/vrf/sessions/session |
Let us have a look at the exact “string” value of this KPI on the router.
| <<router>>#show yang operational ipv4-bgp-oper:bgp instances instance instance-active default-vrf neighbors JSON Tue Feb 20 19:04:24.621 UTC { "Cisco-IOS-XR-ipv4-bgp-oper:bgp": { "instances": { "instance": [ { "instance-name": "default", "instance-active": { "default-vrf": { "neighbors": { "neighbor": [ { "neighbor-address": "10.112.13.230", "speaker-id": 0, "description": "<<router>>", "local-as": 398378, "remote-as": 398378, "has-internal-link": true, "is-external-neighbor-not-directly-connected": false, "messages-received": 49062, "messages-sent": 40162, "update-messages-in": 9603, "update-messages-out": 47, "messages-queued-in": 0, "messages-queued-out": 0, "connection-established-time": 2406884, "connection-state": "bgp-st-estab", "previous-connection-state": 1, "connection-admin-status": 0, "open-check-error-code": "none", "connection-local-address": { "afi": "ipv4", "ipv4-address": "10.112.12.20" } // Output truncated for brevity // |
This is specific to the global routing table. If you want to monitor VRF tables, this is where you read the data from (the example below is from a non-cell site router, as we do not have BGP neighbors in the VRF routing tables):
| <<router>>#show yang operational ipv4-bgp-oper:bgp instances instance instance-active vrfs vrf neighbors JSON { "Cisco-IOS-XR-ipv4-bgp-oper:bgp": { "instances": { "instance": [ { "instance-name": "default", "instance-active": { "vrfs": { "vrf": [ { "vrf-name": "5GC-4G", "neighbors": { "neighbor": [ { "neighbor-address": "10.255.211.215", "speaker-id": 0, "description": "... To …", "local-as": 398378, "remote-as": 398378, "has-internal-link": true, "is-external-neighbor-not-directly-connected": false, "messages-received": 0, "messages-sent": 0, "update-messages-in": 0, "update-messages-out": 0, "messages-queued-in": 0, "messages-queued-out": 0, "connection-established-time": 0, "connection-state": "bgp-st-idle", "previous-connection-state": 1, "connection-admin-status": 0, "open-check-error-code": "update-source-interface-down", "connection-local-address": { "afi": "ipv4", "ipv4-address": "0.0.0.0" },
/// Output truncated for brevity /// |
So if you want to monitor this KPI for both routing tables, you will have to implement the telemetry sensors shown below:
| Cisco-IOS-XR-ipv4-bgp-oper:bgp/instances/instance/instance-active/default-vrf/neighbors/neighbor
Cisco-IOS-XR-ipv4-bgp-oper:bgp/instances/instance/instance-active/vrfs/vrf/neighbors/neighbor |
As you will implement this KPI on your monitoring application, it is essential for you to build an anomaly logic with the help of all possible values of this KPI. You can find that here:
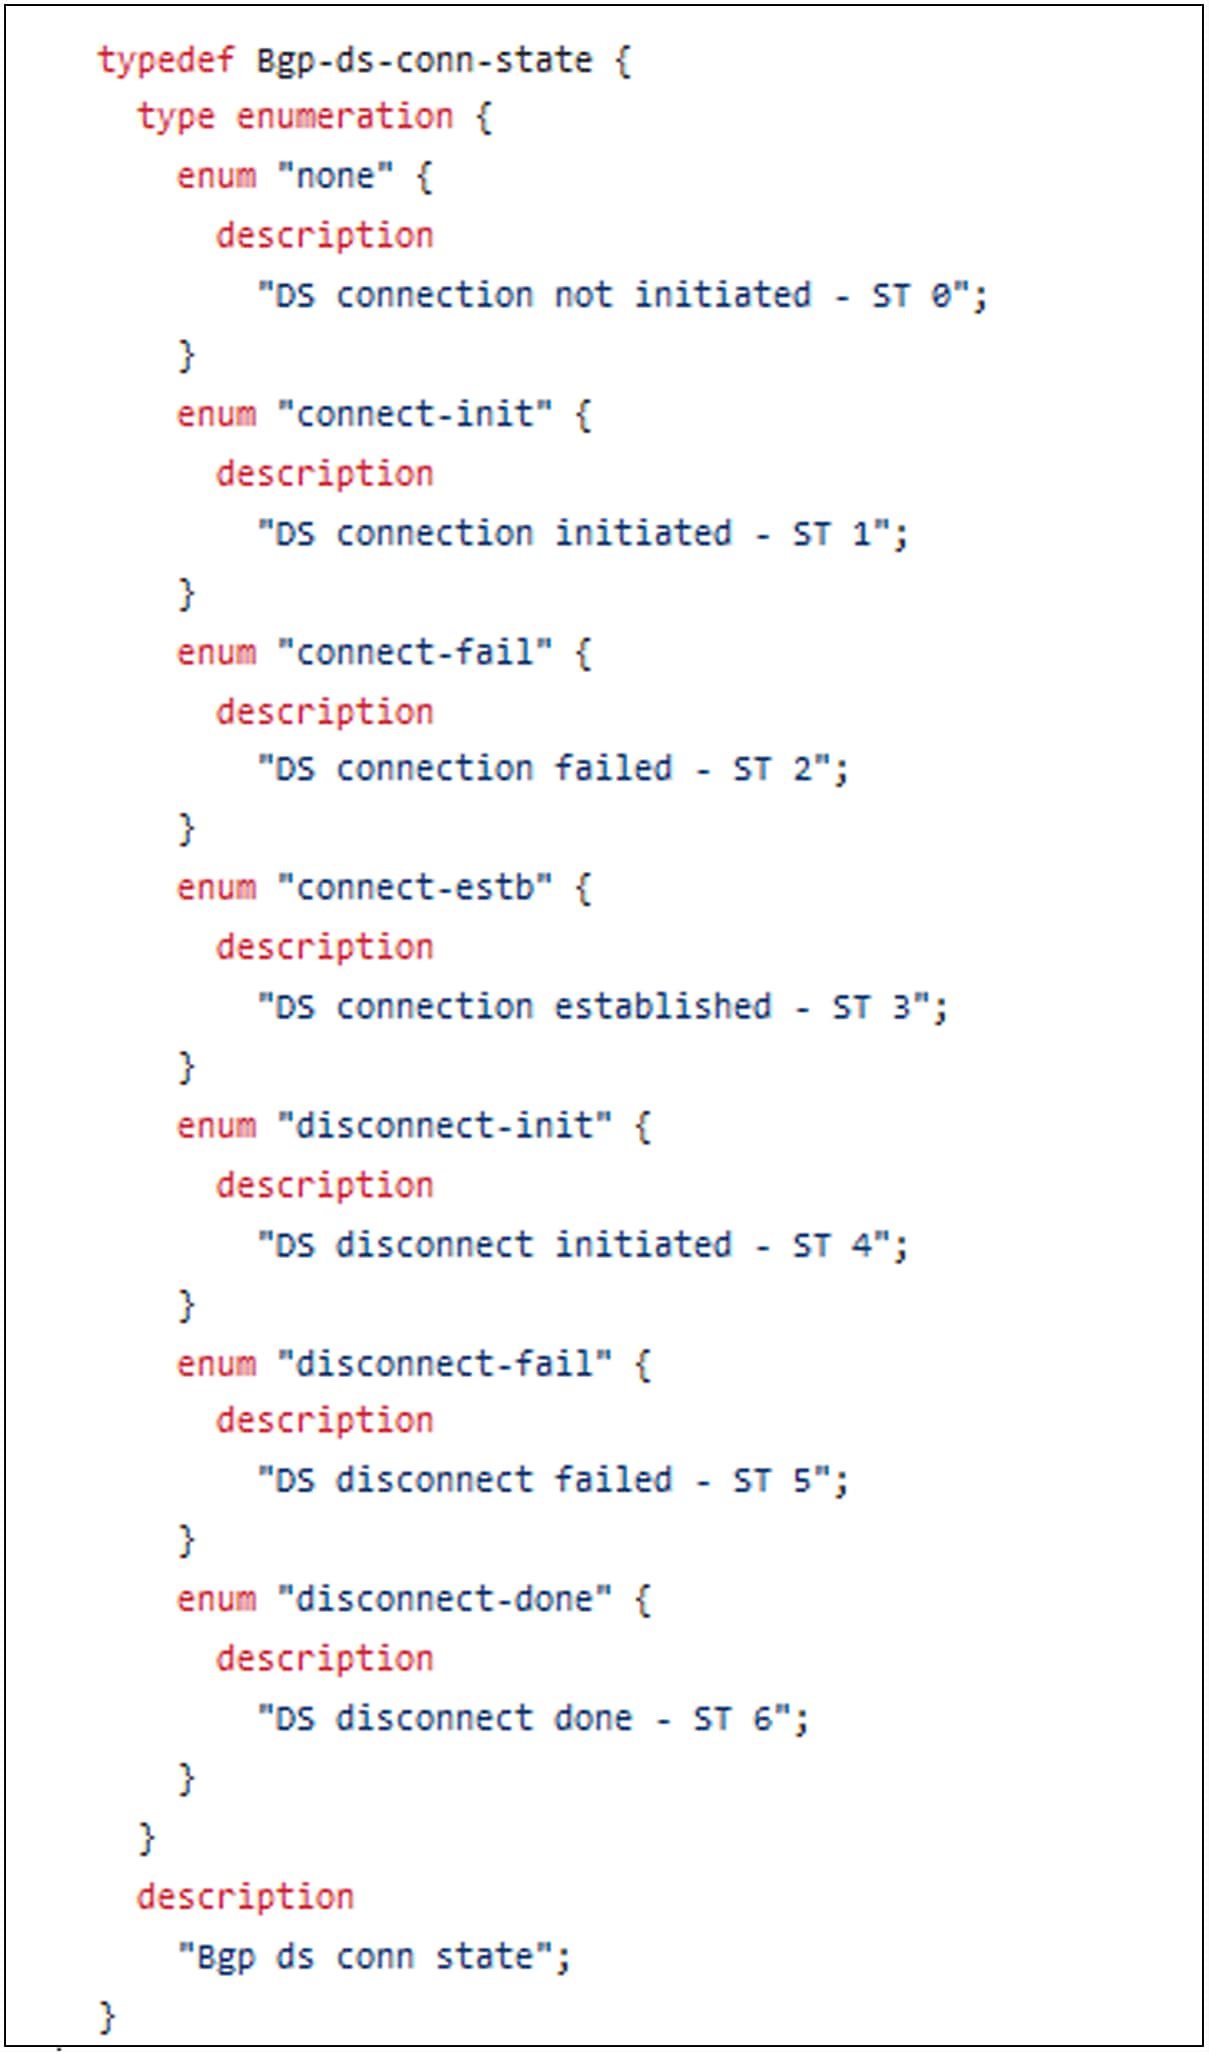
BGP connection state possible values
BGP neighbor count: This is a performance monitoring KPI and will give you a count of your BGP neighbors that are in the “established” state. We don’t really have a CLI command to get this data without using our utility too, so let us instead focus on the data model where this KPI is stored:
| <<router>>#show yang operational ipv4-bgp-oper:bgp instances instance instance-active default-vrf process-info global established-neighbors-count-total JSON { "Cisco-IOS-XR-ipv4-bgp-oper:bgp": { "instances": { "instance": [ { "instance-name": "default", "instance-active": { "default-vrf": { "process-info": { "global": { "established-neighbors-count-total": 2 } } } } } ] } } } |
The telemetry sensor to pull this KPI data is as follows:
| Sensor Group Id:GNMI__3047795260018525609_9 Sensor Path: Cisco-IOS-XR-ipv4-bgp-oper:bgp/instances/instance/instance-active/default-vrf/process-info/global/established-neighbors-count-total Sensor Path State: Resolved |
If you want to verify that the router is streaming this data properly, you can use the mdt_exec command:
| <<router>>#run mdt_exec -s Cisco-IOS-XR-ipv4-bgp-oper:bgp/instances/instance/instance-active/default-vrf/process-info/global/established-neighbors-count-tota$
{"node_id_str":"<<router>>","subscription_id_str":"app_TEST_200000001","encoding_path":"Cisco-IOS-XR-ipv4-bgp-oper:bgp/instances/instance/instance-active/default-vrf/process-info","collection_id":"125111","collection_start_time":"1708458256883","msg_timestamp":"1708458256894","data_json":[{"timestamp":"1708458256892","keys":[{"instance-name":"default"}],"content":{"global":{"established-neighbors-count-total":2}}}],"collection_end_time":"1708458256894"} |
IS-IS adjacency state: This is a performance monitoring KPI and will indicate your intermediate system-to-intermediate system (IS-IS) adjacency state with other cell site routers and/or physical edge routers. The CLI command to validate this KPI is:
| <<router>>#sh isis adjacency
IS-IS ACCESS Level-1 adjacencies: System Id Interface SNPA State Hold Changed NSF IPv4 IPv6 BFD BFD <<router-1>> Te0/0/0/19.2030 *PtoP* Up 197 3w6d Yes Up None <<router-2>> Te0/0/0/19.3030 *PtoP* Up 231 3w6d Yes Up None |
The telemetry sensor with the data model and the container information can be found with this command (if you don’t get an output, try schema-describe instead):
| <<router>>#yang-describe operational show isis adjacency
<<router>>#schema-describe show isis adjacency
Action: get_children Path: RootOper.ISIS.Instances
Action: get_children Path: RootOper.ISIS.Instances.Instance({'InstanceName': 'ACCESS'}).MIB.MIBLevel
Action: get Path: RootOper.ISIS.Instances.Instance({'InstanceName': 'ACCESS'}).Hostname
Action: get Path: RootOper.ISIS.Instances.Instance({'InstanceName': 'ACCESS'}).Level({'Level': 'Level1'}).Adjacency |
The above doesn’t really help us with the identity of our IS-IS data model, which means we will have to dig deeper and probably parse through our data model local inventory. Don’t forget to take clues from the schema-describe, which helps with your container hierarchy:
| sounmukh@<<PYANG-DESKTOP>>:~/yang/vendor/cisco/xr/781$ ls -lrt | grep clns-isis -rwxrwxrwx 1 sounmukh sounmukh 169947 Oct 26 09:11 Cisco-IOS-XR-clns-isis-cfg.yang -rwxrwxrwx 1 sounmukh sounmukh 3920 Oct 26 09:11 Cisco-IOS-XR-clns-isis-datatypes.yang -rwxrwxrwx 1 sounmukh sounmukh 253578 Oct 26 09:11 Cisco-IOS-XR-clns-isis-oper-sub1.yang -rwxrwxrwx 1 sounmukh sounmukh 6880 Oct 26 09:11 Cisco-IOS-XR-clns-isis-oper-sub2.yang -rwxrwxrwx 1 sounmukh sounmukh 42897 Oct 26 09:11 Cisco-IOS-XR-clns-isis-oper.yang
sounmukh@<<PYANG-DESKTOP>>yang/vendor/cisco/xr/781$ pyang -f tree Cisco-IOS-XR-clns-isis-oper.yang --tree-path isis/instances/instance/levels/level/adjacencies --tree-depth 8 module: Cisco-IOS-XR-clns-isis-oper +--ro isis +--ro instances +--ro instance* [instance-name] +--ro levels +--ro level* [level] +--ro adjacencies +--ro adjacency* [] +--ro system-id? xr:Osi-system-id +--ro interface-name? xr:Interface-name +--ro adjacency-system-id? xr:Osi-system-id +--ro adjacency-snpa? xr:Isis-snpa +--ro adjacency-interface? xr:Interface-name +--ro adjacency-media-type? Isis-media-class +--ro adjacency-state? Isis-adj-state +--ro adjacency-bfd-state? Isis-adj-bfd-state +--ro adjacency-ipv6bfd-state? Isis-adj-bfd-state +--ro adj-ipv4bfd-retry-running? boolean +--ro adj-ipv6bfd-retry-running? boolean +--ro adj-ipv4bfd-retry-exp? uint32 +--ro adj-ipv6bfd-retry-exp? uint32 |
Let us build our telemetry sensor and stream our data to validate that it is working as expected.
| Cisco-IOS-XR-clns-isis-oper:isis/instances/instance/levels/level/adjacencies/adjacency <<router>>#run mdt_exec -s Cisco-IOS-XR-clns-isis-oper:isis/instances/instance/levels/level/adjacencies/adjacency -c 10000
{"node_id_str":"<<router>>","subscription_id_str":"app_TEST_200000001","encoding_path":"Cisco-IOS-XR-clns-isis-oper:isis/instances/instance/levels/level/adjacencies/adjacency","collection_id":"125142","collection_start_time":"1708459143091","msg_timestamp":"1708459143102","data_json":[{"timestamp":"1708459143100","keys":[{"instance-name":"ACCESS"},{"level":"level1"},{"system-id":"0101.1201.3178"},{"interface-name":"TenGigE0/0/0/19.2030"}],"content":{"adjacency-system-id":"0101.1201.3178","adjacency-snpa":"8c84.4292.d13c","adjacency-interface":"TenGigE0/0/0/19.2030","adjacency-media-type":"isis-media-class-p2p","adjacency-state":"isis-adj-up-state","adjacency-bfd-state":"isis-adj-bfd-up-state","adjacency-ipv6bfd-state":"isis-adj-bfd-no-state","adj-ipv4bfd-retry-running":false,"adj-ipv6bfd-retry-running":false,"adj-ipv4bfd-retry-
// Output truncated for relevance //
mtu":8983}},{"timestamp":"1708459143100","keys":[{"instance-name":"ACCESS"},{"level":"level1"},{"system-id":"0101.1201.3177"},{"interface-name":"TenGigE0/0/0/19.3030"}],"content":{"adjacency-system-id":"0101.1201.3177","adjacency-snpa":"8c84.4292.d2cc","adjacency-interface":"TenGigE0/0/0/19.3030","adjacency-media-type":"isis-media-class-p2p","adjacency-state":"isis-adj-up-state","adjacency-bfd-state":"isis-adj-bfd-up-state","adjacency-ipv6bfd-state":"isis-adj-bfd-no-state","adj-ipv4bfd-retry-running":false,"adj-ipv6bfd-retry-running":false,"adj-ipv4bfd-retry-exp":0,"adj-ipv6bfd-retry-exp":0,"adj-ipv4bfd-retry-count":0,"adj-ipv6bfd-
// Output truncated for relevance // |
IS-IS adjacency count: This is a performance monitoring KPI and will count the total number of IS-IS adjacencies across IS-IS levels. The CLI command to validate this KPI is:
| <<router>>#sh isis adjacency
IS-IS ACCESS Level-1 adjacencies: System Id Interface SNPA State Hold Changed NSF IPv4 IPv6 BFD BFD <<router-1>> Te0/0/0/19.2030 *PtoP* Up 186 3w6d Yes Up None <<router-2>> Te0/0/0/19.3030 *PtoP* Up 216 3w6d Yes Up None
Total adjacency count: 2 |
The previous telemetry sensor mentioned in Section 2.6.3 won’t give us data for this KPI, so we will have to implement a completely different sensor.
| <<router>>#show yang operational clns-isis-oper:isis instances instance nbr-summ-stats JSON Tue Feb 20 21:01:07.212 UTC { "Cisco-IOS-XR-clns-isis-oper:isis": { "instances": { "instance": [ { "instance-name": "ACCESS", "nbr-summ-stats": { "level-1-nbr-count": 2, "level-2-nbr-count": 0, "level12-nbr-count": 0 } } ] } } } |
| Cisco-IOS-XR-clns-isis-oper:isis/instances/instance/nbr-summ-stats |
If you want to stream the data out of this router to validate that correct data is being streamed, this is what you need to do:
| <<router>>#run mdt_exec -s Cisco-IOS-XR-clns-isis-oper:isis/instances/instance/nbr-summ-stats -c 10000
{"node_id_str":"<<router>>subscription_id_str":"app_TEST_200000001","encoding_path":"Cisco-IOS-XR-clns-isis-oper:isis/instances/instance/nbr-summ-stats","collection_id":"125318","collection_start_time":"1708463876315","msg_timestamp":"1708463876322","data_json":[{"timestamp":"1708463876320","keys":[{"instance-name":"ACCESS"}],"content":{"level-1-nbr-count":2,"level-2-nbr-count":0,"level12-nbr-count":0}}],"collection_end_time":"1708463876322"} |
OSPF neighbor state: The Open Shortest Path First (OSPF) neighbor state is quite like our IS-IS adjacency state KPI, but the data model will be different. Let us search through the same and expose the containers and our relevant leaf:
| sounmukh@<<PYANG-DESKTOP:~/yang/vendor/cisco/xr/781$ pyang -f tree Cisco-IOS-XR-ipv4-ospf-oper.yang --tree-path ospf/processes/process/default-vrf/adjacency-information --tree-depth 8 module: Cisco-IOS-XR-ipv4-ospf-oper +--ro ospf +--ro processes +--ro process* [process-name] +--ro default-vrf +--ro adjacency-information +--ro neighbors | +--ro neighbor* [] | +--ro interface-name? xr:Interface-name | +--ro neighbor-address? inet:ipv4-address-no-zone | +--ro neighbor-bfd-information | | ... | +--ro neighbor-id? inet:ipv4-address | +--ro neighbor-ip-address? inet:ipv4-address | +--ro neighbor-interface-name? xr:Interface-name | +--ro neighbor-sham-link-virtual-link-name? string | +--ro neighbor-dr-priority? uint8 | +--ro neighbor-state? Neighbor-state | +--ro dr-bdr-state? Dr-bdr-state | +--ro neighbor-dead-timer? uint32 | +--ro neighbor-up-time? uint32 | +--ro neighbor-madj-interface? boolean |
The telemetry sensor with the data model and the container information should look like this:
| Cisco-IOS-XR-ipv4-ospf-oper:ospf/processes/process/default-vrf/adjacency-information/neighbors/neighbor |
OSPF adjacency count: This is, again, quite like the IS-IS adjacency count, but you will have to analyze a different data model to fetch this KPI:
| sounmukh@<<PYANG-DESKTOP>>yang/vendor/cisco/xr/781$ pyang -f tree Cisco-IOS-XR-ipv4-ospf-oper.yang --tree-path ospf/processes/process/default-vrf/process-information/process-summary --tree-depth 7 module: Cisco-IOS-XR-ipv4-ospf-oper +--ro ospf +--ro processes +--ro process* [process-name] +--ro default-vrf +--ro process-information +--ro process-summary +--ro domain-id | ... +--ro vrf-active? boolean +--ro role-standby? boolean +--ro if-flood-pacing-interval? uint16 +--ro if-retrans-pacing-interval? uint16 +--ro adj-stag-init-num-nbr? uint16 +--ro adj-stag-max-num-nbr? uint16 +--ro adj-stagger-enabled? boolean +--ro adj-stag-num-nbr-forming? uint16 +--ro number-nbrs-full? uint16 +--ro as-lsa-count? uint32 +--ro as-lsa-checksum? uint32 +--ro opaque-lsa-count? uint32 +--ro opaque-lsa-checksum? uint32 |
The telemetry sensor with the data model and the container information should look like this:
| Cisco-IOS-XR-ipv4-ospf-oper:ospf/processes/process/default-vrf/process-information/process-summary |
This is technically not a control plane KPI, as Bidirectional Forwarding Detection (BFD) runs in the data or forwarding plane. But we will still have a look at it, as OSPF and IS-IS are considered clients of BFD.
BFD session state: This is a performance monitoring KPI and will give us the state of the BFD sessions on the cell site router. The CLI command to validate this KPI is:
| <<router>>#sh bfd session
Interface Dest Addr Local det time(int*mult) State Echo Async H/W NPU ------------------- --------------- ---------------- ---------------- ---------- Te0/0/0/19.2006 10.36.18.13 0s(0s*0) 150ms(50ms*3) UP Yes 0/RP0/CPU0 Te0/0/0/19.3006 10.36.18.9 0s(0s*0) 150ms(50ms*3) UP Yes 0/RP0/CPU0 |
The telemetry sensor with the data model and the container information can be found with this command:
| <router>>#yang-describe operational show bfd session YANG Paths: Cisco-IOS-XR-ip-bfd-oper:bfd/ipv4-multi-hop-session-briefs/ipv4-multi-hop-session-brief Cisco-IOS-XR-ip-bfd-oper:bfd/ipv4-single-hop-session-briefs/ipv4-single-hop-session-brief Cisco-IOS-XR-ip-bfd-oper:bfd/ipv4bf-do-mplste-tail-session-briefs/ipv4bf-do-mplste-tail-session-brief Cisco-IOS-XR-ip-bfd-oper:bfd/session-briefs/session-brief |
The above output has all the possible container information for each client type, like IPv4 Single Hop, IPv4 Multi Hop, etc. If you want to monitor session states irrespective of clients, you should use the following sensor.
| Cisco-IOS-XR-ip-bfd-oper:bfd/session-briefs/session-brief |
Now, let us equate the CLI command with the actual JSON value on the router:
| <<router>>#sh yang operational ip-bfd-oper:bfd session-briefs session-brief state JSON { "Cisco-IOS-XR-ip-bfd-oper:bfd": { "session-briefs": { "session-brief": [ { "interface-name": "TenGigE0/0/0/19.2006", "destination-address": "10.36.18.13", "location": "0/RP0/CPU0", "local-discriminator": 2147487748, "state": "bfd-mgmt-session-state-up" }, { "interface-name": "TenGigE0/0/0/19.3006", "destination-address": "10.36.18.9", "location": "0/RP0/CPU0", "local-discriminator": 2147487750, "state": "bfd-mgmt-session-state-up" } ] } } } |
BFD session count: This is a performance monitoring KPI that counts the number of BFD sessions on the router. The telemetry sensor to fetch this information is:
| Sensor Path: Cisco-IOS-XR-ip-bfd-oper:bfd/summary Sensor Path State: Resolved |
Let us validate that we are streaming the correct count.
| RP/0/RP0/CPU0:SESEA00408E-CS000-CSR001#run mdt_exec -s Cisco-IOS-XR-ip-bfd-oper:bfd/summary -c 10000
{"node_id_str":"<<router>>","subscription_id_str":"app_TEST_200000001","encoding_path":"Cisco-IOS-XR-ip-bfd-oper:bfd/summary","collection_id":"287288","collection_start_time":"1708466659485","msg_timestamp":"1708466659489","data_json":[{"timestamp":"1708466659487","content":{"session-state":{"total-count":2,"down-count":0,"up-count":2,"unknown-count":0}}}],"collection_end_time":"1708466659489"} |
IS-IS routes count: This is a performance monitoring KPI and will track the routes learned from the IS-IS protocol. It is an important baseline KPI because your architecture design is based on the software recommendation, and you cannot go over it. The CLI command to validate this KPI is:
| RP/0/RP0/CPU0:KNTYS00193A-CS000-CSR001#sh route summary Thu Feb 22 17:19:09.346 UTC Route Source Routes Backup Deleted Memory(bytes) connected 1 2 0 648 local 3 0 0 648 local LSPV 1 0 0 216 application fib_mgr 0 0 0 0 isis isis 0 0 0 0 isis ACCESS 2639 1 0 570240 te-client 0 0 0 0 dagr 0 0 0 0 Total 2644 3 0 571752 |
Let us have a look at the data model and the JSON data for this KPI/leaf on the router:
| <<router>>#sh yang operational ip-rib-ipv4-oper:rib vrfs vrf afs af safs saf ip-rib-route-table-names ip-rib-route-table-name protocol isis as information J$ { "Cisco-IOS-XR-ip-rib-ipv4-oper:rib": { "vrfs": { "vrf": [ { "vrf-name": "default", "afs": { "af": [ { "af-name": "IPv4", "safs": { "saf": [ { "saf-name": "Unicast", "ip-rib-route-table-names": { "ip-rib-route-table-name": [ { "route-table-name": "default", "protocol": { "isis": { "as": [ { "as": "isis", "information": { "protocol-names": "isis", "instance": "isis", "version": 0, "redistribution-client-count": 1, "protocol-clients-count": 1, "routes-counts": 0, "active-routes-count": 0, "deleted-routes-count": 0, "paths-count": 0, "protocol-route-memory": 0, "backup-routes-count": 0 } }, { "as": "ACCESS", "information": { "protocol-names": "isis", "instance": "ACCESS", "version": 0, "redistribution-client-count": 1, "protocol-clients-count": 1, "routes-counts": 2639, "active-routes-count": 2638, "deleted-routes-count": 0, "paths-count": 2639, "protocol-route-memory": 570024, "backup-routes-count": 1 } } ] } } } |
The numbers match, which means we are probably looking at the correct data model and leaf. So your telemetry sensor will look like this:
| Cisco-IOS-XR-ip-rib-ipv4-oper:rib/vrfs/vrf/afs/af/safs/saf/ip-rib-route-table-names/ip-rib-route-table-name/protocol/isis/as/information |
Are we streaming data for every collection? Let us have a look at that (with 4 packets per collection, we have sent 264 packets in 66 collections of data):
| <<router>>#show telemetry model-driven internal subscription Subscription: GNMI__3047795260018525609 ------------- State: ACTIVE Sensor groups:
///
Id: 140192 Sample Interval: 3600000 ms Heartbeat Interval: NA Heartbeat always: False Encoding: gnmi-json Num of collection: 66 Incremental updates: 0 Collection time: Min: 266 ms Max: 413 ms Total time: Min: 370 ms Avg: 475 ms Max: 590 ms Total Deferred: 0 Total Send Errors: 0 Total Send Drops: 0 Total Other Errors: 0 No data Instances: 66 Last Collection Start:2024-02-22 17:18:55.2741186628 +0000 Last Collection End: 2024-02-22 17:18:56.2741626628 +0000 Sensor Path: Cisco-IOS-XR-ip-rib-ipv4-oper:rib/vrfs/vrf/afs/af/safs/saf/ip-rib-route-table-names/ip-rib-route-table-name/protocol/isis/as/information
Sysdb Path: /oper/ipv4-rib/gl/vrf/*/afi/*/safi/*/table/*/proto/isis/*/info Count: 66 Method: FINDDATA Min: 266 ms Avg: 337 ms Max: 413 ms Item Count: 264 Status: Active Missed Collections:0 send bytes: 147180 packets: 264 dropped bytes: 0 Missed Heartbeats: 0 Filtered Item Count: 0 success errors deferred/drops Gets 264 0 List 1782 0 Datalist 0 0 Finddata 0 0 GetBulk 0 0 Encode 0 0 Send 0 0 |
OSPF routes count: This is a performance monitoring KPI and is very similar to the one in Section 2.6.9.
| <<router>>#sh yang operational ip-rib-ipv4-oper:rib vrfs vrf afs af safs saf ip-rib-route-table-names ip-rib-route-table-name protocol ospf as information ? JSON Output in JSON format. XML Output in XML format. active-routes-count backup-routes-count deleted-routes-count instance paths-count protocol-clients-count protocol-names protocol-route-memory redistribution-client-count routes-counts version | Output Modifiers <cr> |
The telemetry sensor for this OSPF KPI will be:
| Cisco-IOS-XR-ip-rib-ipv4-oper:rib/vrfs/vrf/afs/af/safs/saf/ip-rib-route-table-names/ip-rib-route-table-name/protocol/ospf/as/information |
BGP routes count: This is a performance monitoring KPI and will, again, be like the one in Section 2.6.9. The CLI command to get us “global” BGP routes is:
| <<router>>#sh route summary Route Source Routes Backup Deleted Memory(bytes) connected 2 2 0 864 local 4 0 0 864 local LSPV 1 0 0 216 application fib_mgr 0 0 0 0 isis ACCESS 3015 0 0 651360 bgp 398378 1229 10 0 267624 te-client 0 0 0 0 dagr 0 0 0 0 Total 4251 12 0 920928 |
Let us have a look at the data model and the JSON data for this KPI/leaf on the router:
| <<router>>#show yang operational ip-rib-ipv4-oper:rib vrfs vrf afs af safs saf ip-rib-route-table-names ip-rib-route-table-name protocol bgp as information routes-count JSON { "Cisco-IOS-XR-ip-rib-ipv4-oper:rib": { "vrfs": { "vrf": [ { "vrf-name": "default", "afs": { "af": [ { "af-name": "IPv4", "safs": { "saf": [ { "saf-name": "Unicast", "ip-rib-route-table-names": { "ip-rib-route-table-name": [ { "route-table-name": "default", "protocol": { "bgp": { "as": [ { "as": "398378", "information": { "routes-counts": 1239 } } ] } } } ] } } ] } } ] } },
// truncated the Output for brevity // |
The numbers match, which means we are probably looking at the correct data model and leaf. The truncated output doesn’t show us BGP routes in VRFs, so let us look at that via the CLI first:
| <<router>>#show route vrf all summary Thu Feb 22 17:48:53.892 UTC
VRF: RAN-F1C
Route Source Routes Backup Deleted Memory(bytes) local 1 0 0 216 connected 1 0 0 216 bgp 398378 1 0 0 216 dagr 0 0 0 0 Total 3 0 0 648
VRF: RAN-F1U
Route Source Routes Backup Deleted Memory(bytes) local 1 0 0 216 connected 1 0 0 216 bgp 398378 1 0 0 216 dagr 0 0 0 0 Total 3 0 0 648
VRF: RAN-OAM
Route Source Routes Backup Deleted Memory(bytes) connected 1 0 0 216 local 1 0 0 216 bgp 398378 1 0 0 216 dagr 0 0 0 0 Total 3 0 0 648
VRF: SERVICE-MGMT
Route Source Routes Backup Deleted Memory(bytes) connected 3 1 0 864 local 4 0 0 864 bgp 398378 1 0 0 216 dagr 0 0 0 0 Total 8 1 0 1944
VRF: **iid
Route Source Routes Backup Deleted Memory(bytes) connected 0 0 0 0 local 0 0 0 0 Total 0 0 0 0 |
Now we will jump back to the same data model and container (information) to match this data/leaf:
| <<router>>#show yang operational ip-rib-ipv4-oper:rib vrfs vrf afs af safs saf ip-rib-route-table-names ip-rib-route-table-name protocol bgp as information routes-count JSON { "Cisco-IOS-XR-ip-rib-ipv4-oper:rib": { "vrfs": { "vrf": [ { "vrf-name": "RAN-F1C", "afs": { "af": [ { "af-name": "IPv4", "safs": { "saf": [ { "saf-name": "Unicast", "ip-rib-route-table-names": { "ip-rib-route-table-name": [ { "route-table-name": "default", "protocol": { "bgp": { "as": [ { "as": "398378", "information": { "routes-counts": 1 } } ] } } } ] } } ] } } ] } }, { "vrf-name": "RAN-F1U", "afs": { "af": [ { "af-name": "IPv4", "safs": { "saf": [ { "saf-name": "Unicast", "ip-rib-route-table-names": { "ip-rib-route-table-name": [ { "route-table-name": "default", "protocol": { "bgp": { "as": [ { "as": "398378", "information": { "routes-counts": 1 } } ] } } } ] } } ] } } ] } },, /// Output truncated for brevity /// |
This also means that we don’t need to create two different telemetry sensors for the default routing table and the VRF routing table. The telemetry sensor for both KPIs is:
| Sensor Path: Cisco-IOS-XR-ip-rib-ipv4-oper:rib/vrfs/vrf/afs/af/safs/saf/ip-rib-route-table-names/ip-rib-route-table-name/protocol/bgp/as/information Sensor Path State: Resolved |
Static routes count: This is a performance monitoring KPI and is very similar to the one in Section 2.6.9.
| <<router>>#sh yang operational ip-rib-ipv4-oper:rib vrfs vrf afs af safs saf ip-rib-route-table-names ip-rib-route-table-name protocol static ? JSON Output in JSON format. XML Output in XML format. non-as | Output Modifiers <cr> |
The telemetry sensor for the static routes count KPI will be:
| Cisco-IOS-XR-ip-rib-ipv4-oper:rib/vrfs/vrf/afs/af/safs/saf/ip-rib-route-table-names/ip-rib-route-table-name/protocol/static |
CEF drops: This is a performance monitoring KPI and is a composite KPI for all the Cisco Express Forwarding drops on the system, such as “No route drops,” “No adjacency drops,” etc. The CLI command to validate this KPI is:
| <<router>>#show cef drops CEF Drop Statistics Node: 0/RP0/CPU0 Unresolved drops packets : 0 Unsupported drops packets : 3 Null0 drops packets : 0 No route drops packets : 11946 No Adjacency drops packets : 687 Checksum error drops packets : 0 RPF drops packets : 0 RPF suppressed drops packets : 0 RP destined drops packets : 0 Discard drops packets : 2 GRE lookup drops packets : 0 GRE processing drops packets : 0 LISP punt drops packets : 0 LISP encap err drops packets : 0 LISP decap err drops packets : 0 |
Let us try to build the telemetry sensor from the yang-describe and schema-describe information we have for this CLI command:
| <<router>>#yang-describe operational show cef drops
<<router>>#schema-describe show cef drops Action: get_children Path: RootOper.FIBStatistics.Node
Action: get Path: RootOper.FIBStatistics.Node({'NodeName': '0/RP0/CPU0'}).Drops |
Even though we didn’t get information about the data model itself, we have good indicators about the containers that will help us find our leaf/KPIs. I am searching for fib-common below, as I have a fair understanding of the model that will fetch us the above data.
| sounmukh@<<PYANG-DESKTOP>>yang/vendor/cisco/xr/781$ ls -lrt | grep fib-common -rwxrwxrwx 1 sounmukh sounmukh 5029 Oct 26 09:11 Cisco-IOS-XR-fib-common-cfg.yang -rwxrwxrwx 1 sounmukh sounmukh 11893 Oct 26 09:11 Cisco-IOS-XR-fib-common-oper-sub1.yang -rwxrwxrwx 1 sounmukh sounmukh 20337 Oct 26 09:11 Cisco-IOS-XR-fib-common-oper-sub2.yang -rwxrwxrwx 1 sounmukh sounmukh 6665 Oct 26 09:11 Cisco-IOS-XR-fib-common-oper-sub3.yang -rwxrwxrwx 1 sounmukh sounmukh 148928 Oct 26 09:11 Cisco-IOS-XR-fib-common-oper-sub4.yang -rwxrwxrwx 1 sounmukh sounmukh 17022 Oct 26 09:11 Cisco-IOS-XR-fib-common-oper-sub5.yang -rwxrwxrwx 1 sounmukh sounmukh 8382 Oct 26 09:11 Cisco-IOS-XR-fib-common-oper-sub6.yang -rwxrwxrwx 1 sounmukh sounmukh 6848 Oct 26 09:11 Cisco-IOS-XR-fib-common-oper-sub7.yang -rwxrwxrwx 1 sounmukh sounmukh 115511 Oct 26 09:11 Cisco-IOS-XR-fib-common-oper.yang
sounmukh@<<PYANG-DESKTOP>>yang/vendor/cisco/xr/781$ pyang -f tree Cisco-IOS-XR-fib-common-oper.yang --tree-depth 2 module: Cisco-IOS-XR-fib-common-oper +--ro fib-statistics | +--ro nodes | ... +--ro fib | +--ro nodes | ... +--ro oc-aft-l3 | +--ro vrfs | | ... | +--ro protocol | ... +--ro mpls-forwarding +--ro nodes ...
sounmukh@<<PYANG-DESKTOP>>yang/vendor/cisco/xr/781$ pyang -f tree Cisco-IOS-XR-fib-common-oper.yang --tree-path fib-statistics/nodes/node --tree-depth 5 module: Cisco-IOS-XR-fib-common-oper +--ro fib-statistics +--ro nodes +--ro node* [node-name] +--ro drops | +--ro no-route-packets? uint64 | +--ro punt-unreachable-packets? uint64 | +--ro df-unreachable-packets? uint64 | +--ro encapsulation-failure-packets? uint64 | +--ro incomplete-adjacency-packets? uint64 | +--ro unresolved-prefix-packets? uint64 | +--ro unsupported-feature-packets? uint64 | +--ro discard-packets? uint64 | +--ro checksum-error-packets? uint64 | +--ro fragmenation-consumed-packets? uint64 | +--ro fragmenation-failure-packets? uint64 | +--ro null-packets? uint64 | +--ro rpf-check-failure-packets? uint64 | +--ro acl-in-rpf-packets? uint64 | +--ro rp-destination-drop-packets? uint64 | +--ro total-number-of-drop-packets? uint64 | +--ro mpls-disabled-interface? uint64 | +--ro gre-lookup-failed-drop? uint64 | +--ro gre-error-drop? uint64 | +--ro lisp-punt-drops? uint64 | +--ro lisp-encap-error-drops? uint64 | +--ro lisp-decap-error-drops? uint64 | +--ro multi-label-drops? uint64 | +--ro unreachable-sr-label-drops? uint64 | +--ro ttl-expired-sr-label-drops? uint64 +--ro node-name xr:Node-id |
Now that we know where to find our data, let us build our telemetry sensor for CEF drops.
| Sensor Path: Cisco-IOS-XR-fib-common-oper:fib-statistics/nodes/node/drops Sensor Path State: Resolved |
You can either aggregate all the different leaves below “drops” and monitor the CEF drops or monitor a specific leaf if you have a requirement matching that. Before we leave this section, let us quickly validate the data present in this YANG model; it should ideally stream out if asked to:
| <<router>>#show yang operational fib-common-oper:fib-statistics nodes node drops JSON { "Cisco-IOS-XR-fib-common-oper:fib-statistics": { "nodes": { "node": [ { "node-name": "0/RP0/CPU0", "drops": { "no-route-packets": "11946", "punt-unreachable-packets": "0", "df-unreachable-packets": "0", "encapsulation-failure-packets": "0", "incomplete-adjacency-packets": "687", "unresolved-prefix-packets": "0", "unsupported-feature-packets": "3", "discard-packets": "2", "checksum-error-packets": "0", "fragmenation-consumed-packets": "0", "fragmenation-failure-packets": "0", "null-packets": "0", "rpf-check-failure-packets": "0", "acl-in-rpf-packets": "0", "rp-destination-drop-packets": "0", "total-number-of-drop-packets": "0", "mpls-disabled-interface": "0", "gre-lookup-failed-drop": "0", "gre-error-drop": "0", "lisp-punt-drops": "0", "lisp-encap-error-drops": "0", "lisp-decap-error-drops": "0", "multi-label-drops": "0", "unreachable-sr-label-drops": "0", "ttl-expired-sr-label-drops": "0" } } ] } } } |
The above values match the CLI output that we saw at the beginning of this section.
2.7.2. QoS input transmit packets
QoS input transmit packets: This is a performance monitoring KPI and will indicate the ingress packets transmitted into a Quality-of-Service (QoS) policy. The CLI command to validate this KPI is:
| <<router>>#show policy-map interface TenGigE0/0/0/4.206 input
TenGigE0/0/0/4.206 input: Radio_Interface_Xhaul
Class class-default Classification statistics (packets/bytes) (rate - kbps) Matched : 693265623800/792615713806441 1031443 Transmitted : 693265510512/792615584334695 1031443 Total Dropped : 113288/129471746 0 Policy Bag Stats time: 1708915752661 [Local Time: 02/26/24 02:49:12.661]
|
The telemetry sensor to pull the data for the above KPI is:
| Sensor Path: Cisco-IOS-XR-qos-ma-oper:qos/interface-table/interface/input/service-policy-names/service-policy-instance/statistics Sensor Path State: Resolved |
Let us validate the data on the system as fetched from the YANG model.
| <<router>>#show yang operational qos-ma-oper:qos interface-table interface input service-policy-names service-policy-instance statistics JSON { "Cisco-IOS-XR-qos-ma-oper:qos": { "interface-table": { "interface": [ { "interface-name": "TenGigE0/0/0/4.206", "input": { "service-policy-names": { "service-policy-instance": [ { "service-policy-name": "Radio_Interface_Xhaul", "statistics": { "policy-name": "Radio_Interface_Xhaul", "state": "active", "class-stats": [ { "counter-validity-bitmask": "7872512", "class-name": "class-default", "cac-state": "unknown", "general-stats": { "transmit-packets": "1043251238916", "transmit-bytes": "1052671645686444", "total-drop-packets": "172838", "total-drop-bytes": "174440666", "total-drop-rate": 0, "match-data-rate": 1368878, "total-transmit-rate": 1368878, "pre-policy-matched-packets": "1043251411754", "pre-policy-matched-bytes": "1052671820127110" }, |
2.7.3. QoS input total drop packets
QoS input total drop packets: This is a performance monitoring KPI and will indicate the total ingress dropped on a QoS policy. The CLI command to validate this KPI is:
| <<router>>#show policy-map interface TenGigE0/0/0/4.206 input
TenGigE0/0/0/4.206 input: Radio_Interface_Xhaul
Class class-default Classification statistics (packets/bytes) (rate - kbps) Matched : 693265623800/792615713806441 1031443 Transmitted : 693265510512/792615584334695 1031443 Total Dropped : 113288/129471746 0 Policy Bag Stats time: 1708915752661 [Local Time: 02/26/24 02:49:12.661] |
The telemetry sensor to pull the data for the above KPI is:
| Sensor Path: Cisco-IOS-XR-qos-ma-oper:qos/interface-table/interface/input/service-policy-names/service-policy-instance/statistics Sensor Path State: Resolved |
Let us validate the data on the system as fetched from the YANG model.
| <<router>>#show yang operational qos-ma-oper:qos interface-table interface input service-policy-names service-policy-instance statistics JSON { "Cisco-IOS-XR-qos-ma-oper:qos": { "interface-table": { "interface": [ { "interface-name": "TenGigE0/0/0/4.206", "input": { "service-policy-names": { "service-policy-instance": [ { "service-policy-name": "Radio_Interface_Xhaul", "statistics": { "policy-name": "Radio_Interface_Xhaul", "state": "active", "class-stats": [ { "counter-validity-bitmask": "7872512", "class-name": "class-default", "cac-state": "unknown", "general-stats": { "transmit-packets": "1043251238916", "transmit-bytes": "1052671645686444", "total-drop-packets": "172838", "total-drop-bytes": "174440666", "total-drop-rate": 0, "match-data-rate": 1368878, "total-transmit-rate": 1368878, "pre-policy-matched-packets": "1043251411754", "pre-policy-matched-bytes": "1052671820127110" }, |
QOS input tail drops: This is a performance monitoring KPI and is part of the same data model/container hierarchy discussed in Sections 2.7.2 and 2.7.3.
| <<router>>#show yang operational qos-ma-oper:qos interface-table interface input service-policy-names service-policy-instance statistics JSON { "Cisco-IOS-XR-qos-ma-oper:qos": { "interface-table": { "interface": [ { "interface-name": "TenGigE0/0/0/4.206", "input": { "service-policy-names": { "service-policy-instance": [ { "service-policy-name": "Radio_Interface_Xhaul", "statistics": { "policy-name": "Radio_Interface_Xhaul", "state": "active",
/// Output truncated for relevance ///
"queue-stats-array": [ { "queue-id": 4294967295, "tail-drop-packets": "0", "tail-drop-bytes": "0", |
The telemetry sensor to pull the data for the above KPI is:
| Sensor Path: Cisco-IOS-XR-qos-ma-oper:qos/interface-table/interface/input/service-policy-names/service-policy-instance/statistics Sensor Path State: Resolved |
2.7.5. QoS input conform packets
QoS input conform packets: This is a performance monitoring KPI and is part of the same data model/container hierarchy discussed in Sections 2.7.2, 2.7.3, and 2.7.4.
| <<router>>#show yang operational qos-ma-oper:qos interface-table interface input service-policy-names service-policy-instance statistics JSON { "Cisco-IOS-XR-qos-ma-oper:qos": { "interface-table": { "interface": [ { "interface-name": "TenGigE0/0/0/4.206", "input": { "service-policy-names": { "service-policy-instance": [ { "service-policy-name": "Radio_Interface_Xhaul", "statistics": { "policy-name": "Radio_Interface_Xhaul", "state": "active",
/// Output truncated for relevance ///
"queue-drop-threshold": 0, "forced-wred-stats-display": false, "random-drop-packets": "0", "random-drop-bytes": "0", "max-threshold-packets": "0", "max-threshold-bytes": "0", "conform-packets": "0", "conform-bytes": "0", "exceed-packets": "0", "exceed-bytes": "0", "conform-rate": 0, "exceed-rate": 0 |
The telemetry sensor to pull the data for the above KPI is:
| Sensor Path: Cisco-IOS-XR-qos-ma-oper:qos/interface-table/interface/input/service-policy-names/service-policy-instance/statistics Sensor Path State: Resolved |
2.7.6. QoS input exceed packets
QoS input exceed packets: This is a performance monitoring KPI and is part of the same data model/container hierarchy discussed in Sections 2.7.2, 2.7.3, 2.7.4, and 2.7.5.
| <<router>>#show yang operational qos-ma-oper:qos interface-table interface input service-policy-names service-policy-instance statistics JSON { "Cisco-IOS-XR-qos-ma-oper:qos": { "interface-table": { "interface": [ { "interface-name": "TenGigE0/0/0/4.206", "input": { "service-policy-names": { "service-policy-instance": [ { "service-policy-name": "Radio_Interface_Xhaul", "statistics": { "policy-name": "Radio_Interface_Xhaul", "state": "active",
/// Output truncated for relevance ///
"queue-drop-threshold": 0, "forced-wred-stats-display": false, "random-drop-packets": "0", "random-drop-bytes": "0", "max-threshold-packets": "0", "max-threshold-bytes": "0", "conform-packets": "0", "conform-bytes": "0", "exceed-packets": "0", "exceed-bytes": "0", "conform-rate": 0, "exceed-rate": 0 |
The telemetry sensor to pull the data for the above KPI is:
| Sensor Path: Cisco-IOS-XR-qos-ma-oper:qos/interface-table/interface/input/service-policy-names/service-policy-instance/statistics Sensor Path State: Resolved |
2.7.7. QoS output transmit packets
QoS output transmit packets: This is a performance monitoring KPI and will indicate the egress packets transmitted into a QoS policy. The CLI command to validate this KPI is:
| <<router>>#show policy-map interface TenGigE0/0/0/19.2027 output
TenGigE0/0/0/19.2027 output: CSR-SHAPER-1G
Class class-default Classification statistics (packets/bytes) (rate - kbps) Matched : 0/0 0 Transmitted : 0/0 0 Total Dropped : 0/0 0
Policy CSR-EGRESS Class NETWORK-CONTROL-Q Classification statistics (packets/bytes) (rate - kbps) Matched : 0/0 0 Transmitted : 0/0 0 Total Dropped : 0/0 0 Queueing statistics Queue ID : 1190 Taildropped(packets/bytes) : 0/0
/// Output truncated for brevity /// |
The telemetry sensor to pull the data for the above KPI is:
| Sensor Path: Cisco-IOS-XR-qos-ma-oper:qos/interface-table/interface/output/service-policy-names/service-policy-instance/statistics Sensor Path State: Resolved |
Let us validate the data on the system as fetched from the YANG model.
| <<router>>#show yang operational qos-ma-oper:qos interface-table interface output service-policy-names service-policy-instance statistics JSON { "Cisco-IOS-XR-qos-ma-oper:qos": { "interface-table": { "interface": [ { "interface-name": "TenGigE0/0/0/19.2027", "output": { "service-policy-names": { "service-policy-instance": [ {
/// Output truncated for relevance ///
"child-policy": { "policy-name": "CSR-EGRESS", "state": "active", "class-stats": [ { "counter-validity-bitmask": "7864320", "class-name": "NETWORK-CONTROL-Q", "cac-state": "unknown", "general-stats": { "transmit-packets": "0", "transmit-bytes": "0", "total-drop-packets": "0", "total-drop-bytes": "0", "total-drop-rate": 0, "match-data-rate": 0, "total-transmit-rate": 0, "pre-policy-matched-packets": "0", "pre-policy-matched-bytes": "0" }, |
The hierarchy of the data model is interface followed by the policy name followed by the class name followed by the “general-stats” container, which stores our KPI and its value.
2.7.8. QoS output total drop packets
QoS output total drop packets: This is a performance monitoring KPI and will indicate the total egress packets dropped on a QoS policy. The CLI command to validate this KPI is:
| <<router>>#show policy-map interface TenGigE0/0/0/19.2027 output
TenGigE0/0/0/19.2027 output: CSR-SHAPER-1G
Class class-default Classification statistics (packets/bytes) (rate - kbps) Matched : 0/0 0 Transmitted : 0/0 0 Total Dropped : 0/0 0
Policy CSR-EGRESS Class NETWORK-CONTROL-Q Classification statistics (packets/bytes) (rate - kbps) Matched : 0/0 0 Transmitted : 0/0 0 Total Dropped : 0/0 0 Queueing statistics Queue ID : 1190 Taildropped(packets/bytes) : 0/0
/// Output truncated for brevity /// |
The telemetry sensor to pull the data for the above KPI is:
| Sensor Path: Cisco-IOS-XR-qos-ma-oper:qos/interface-table/interface/output/service-policy-names/service-policy-instance/statistics Sensor Path State: Resolved |
Let us validate the data on the system as fetched from the YANG model.
| <<router>>#show yang operational qos-ma-oper:qos interface-table interface output service-policy-names service-policy-instance statistics JSON { "Cisco-IOS-XR-qos-ma-oper:qos": { "interface-table": { "interface": [ { "interface-name": "TenGigE0/0/0/19.2027", "output": { "service-policy-names": { "service-policy-instance": [ { "service-policy-name": "CSR-SHAPER-1G", "statistics": { "policy-name": "CSR-SHAPER-1G", "state": "active", "class-stats": [ { "counter-validity-bitmask": "7864320", "class-name": "class-default", "cac-state": "unknown", "general-stats": { "transmit-packets": "0", "transmit-bytes": "0", "total-drop-packets": "0", "total-drop-bytes": "0", "total-drop-rate": 0, "match-data-rate": 0, "total-transmit-rate": 0, "pre-policy-matched-packets": "0", "pre-policy-matched-bytes": "0" }, |
QoS output tail drops: This is a performance monitoring KPI and is part of the same data model/container hierarchy discussed in Sections 2.7.7 and 2.7.8.
| <<router>>#show yang operational qos-ma-oper:qos interface-table interface output service-policy-names service-policy-instance statistics JSON { "Cisco-IOS-XR-qos-ma-oper:qos": { "interface-table": { "interface": [ { "interface-name": "TenGigE0/0/0/19.2027", "output": { "service-policy-names": { "service-policy-instance": [ { "service-policy-name": "CSR-SHAPER-1G", "statistics": { "policy-name": "CSR-SHAPER-1G", "state": "active", "class-stats": [ {
/// Output truncated for relevance ///
"queue-stats-array": [ { "queue-id": 0, "tail-drop-packets": "0", "tail-drop-bytes": "0", |
The telemetry sensor to pull the data for the above KPI is:
| Sensor Path: Cisco-IOS-XR-qos-ma-oper:qos/interface-table/interface/output/service-policy-names/service-policy-instance/statistics Sensor Path State: Resolved |
2.7.10. QoS output conform packets
QoS output conform packets: This is a performance monitoring KPI and is part of the same data model/container hierarchy discussed in Sections 2.7.7, 2.7.8, and 2.7.9.
| <<router>>#show yang operational qos-ma-oper:qos interface-table interface output service-policy-names service-policy-instance statistics JSON { "Cisco-IOS-XR-qos-ma-oper:qos": { "interface-table": { "interface": [ { "interface-name": "TenGigE0/0/0/19.2027", "output": { "service-policy-names": { "service-policy-instance": [ { "service-policy-name": "CSR-SHAPER-1G", "statistics": { "policy-name": "CSR-SHAPER-1G", "state": "active", "class-stats": [ {
/// Output truncated for relevance ///
"queue-drop-threshold": 0, "forced-wred-stats-display": false, "random-drop-packets": "0", "random-drop-bytes": "0", "max-threshold-packets": "0", "max-threshold-bytes": "0", "conform-packets": "0", "conform-bytes": "0", "exceed-packets": "0", "exceed-bytes": "0", "conform-rate": 0, "exceed-rate": 0 } |
The telemetry sensor to pull the data for the above KPI is:
| Sensor Path: Cisco-IOS-XR-qos-ma-oper:qos/interface-table/interface/output/service-policy-names/service-policy-instance/statistics Sensor Path State: Resolved |
2.7.11. QoS output exceed packets
QoS output exceed packets: This is a performance monitoring KPI and is part of the same data model/container hierarchy discussed in Sections 2.7.7, 2.7.8, 2.7.9, and 2.7.10.
| <<router>>#show yang operational qos-ma-oper:qos interface-table interface output service-policy-names service-policy-instance statistics JSON { "Cisco-IOS-XR-qos-ma-oper:qos": { "interface-table": { "interface": [ { "interface-name": "TenGigE0/0/0/19.2027", "output": { "service-policy-names": { "service-policy-instance": [ { "service-policy-name": "CSR-SHAPER-1G", "statistics": { "policy-name": "CSR-SHAPER-1G", "state": "active", "class-stats": [ {
/// Output truncated for relevance ///
"queue-drop-threshold": 0, "forced-wred-stats-display": false, "random-drop-packets": "0", "random-drop-bytes": "0", "max-threshold-packets": "0", "max-threshold-bytes": "0", "conform-packets": "0", "conform-bytes": "0", "exceed-packets": "0", "exceed-bytes": "0", "conform-rate": 0, "exceed-rate": 0 } |
The telemetry sensor to pull the data for the above KPI is:
| Sensor Path: Cisco-IOS-XR-qos-ma-oper:qos/interface-table/interface/output/service-policy-names/service-policy-instance/statistics Sensor Path State: Resolved |
2.7.12. IP SLA – RTT average latency
IP SLA ‒ RTT average latency: This is a performance monitoring or service assurance KPI and either will be part of your performance monitoring solution or will be delivered through an integration with a service assurance solution. This section has a prerequisite, which is to enable the IP Service-Level Agreement (SLA) UDP jitter function on the device, with the health probes initiated toward devices on which the responder function sits, so that they can respond to the probes and provide us with the service assurance data. The CLI command on the device where the health probe is initiated is:
| <<router>>#show ipsla statistics 20 Entry number: 20 Modification time: 06:01:02.212 UTC Wed Jan 17 2024 Start time : 06:01:02.219 UTC Wed Jan 17 2024 Number of operations attempted: 12219 Number of operations skipped : 0 Current seconds left in Life : Forever Operational state of entry : Active Operational frequency(seconds): 300 Connection loss occurred : FALSE Timeout occurred : FALSE Latest RTT (milliseconds) : 4 Latest operation start time : 16:11:03.223 UTC Wed Feb 28 2024 Next operation start time : 16:16:03.223 UTC Wed Feb 28 2024 Latest operation return code : OK RTT Values: RTTAvg : 4 RTTMin: 3 RTTMax : 5 NumOfRTT: 30 RTTSum: 120 RTTSum2: 486 Packet Loss Values: PacketLossSD : 0 PacketLossDS : 0 PacketOutOfSequence: 0 PacketMIA : 0 PacketLateArrival : 0 PacketSkipped: 0 Errors : 0 Busies : 0 InvalidTimestamp : 0 Jitter Values : MinOfPositivesSD: 1 MaxOfPositivesSD: 1 NumOfPositivesSD: 3 SumOfPositivesSD: 3 Sum2PositivesSD : 3 MinOfNegativesSD: 1 MaxOfNegativesSD: 1 NumOfNegativesSD: 3 SumOfNegativesSD: 3 Sum2NegativesSD : 3 MinOfPositivesDS: 1 MaxOfPositivesDS: 1 NumOfPositivesDS: 4 SumOfPositivesDS: 4 Sum2PositivesDS : 4 MinOfNegativesDS: 1 MaxOfNegativesDS: 1 NumOfNegativesDS: 3 SumOfNegativesDS: 3 Sum2NegativesDS : 3 JitterAve: 1 JitterSDAve: 1 JitterDSAve: 1 Interarrival jitterout: 0 Interarrival jitterin: 0 One Way Values : NumOfOW: 30 OWMinSD : 2 OWMaxSD: 3 OWSumSD: 64 OWSum2SD: 140 OWAveSD: 2 OWMinDS : 1 OWMaxDS: 2 OWSumDS: 56 OWSum2DS: 108 OWAveDS: 1 |
Our KPI is marked in green above; it is an average of all the values reported by the probes, which are sent out at certain intervals.
We will try to look at the “describe” options available to us on IOS XR to pull out the telemetry sensor or the container/leaf information to build the telemetry sensor:
| <<router>>#yang-describe operational show ipsla statistics 20
<<router>>#schema-describe show ipsla statistics 20 Action: get Path: RootOper.IPSLA.OperationData.Operation({'OperationID': 20}).Statistics.Latest.Target
Action: get Path: RootOper.IPSLA.OperationData.Operation({'OperationID': 20}).Common.OperationalState |
As we don’t have direct information about the sensor, we will have to go back to the drawing board (which is our YANG repository) and build the sensor with the help of the “schema” clues provided above:
| sounmukh@<<PYANG-DESKTOP>>/yang/vendor/cisco/xr/782$ ls -lrt | grep ipsla -rwxrwxrwx 1 sounmukh sounmukh 77494 Oct 26 09:11 Cisco-IOS-XR-man-ipsla-cfg.yang -rwxrwxrwx 1 sounmukh sounmukh 3208 Oct 26 09:11 Cisco-IOS-XR-man-ipsla-oper-sub1.yang -rwxrwxrwx 1 sounmukh sounmukh 40748 Oct 26 09:11 Cisco-IOS-XR-man-ipsla-oper-sub2.yang -rwxrwxrwx 1 sounmukh sounmukh 3076 Oct 26 09:11 Cisco-IOS-XR-man-ipsla-oper-sub3.yang -rwxrwxrwx 1 sounmukh sounmukh 22687 Oct 26 09:11 Cisco-IOS-XR-man-ipsla-oper.yang -rwxrwxrwx 1 sounmukh sounmukh 175845 Oct 26 09:11 Cisco-IOS-XR-um-ipsla-cfg.yang -rwxrwxrwx 1 sounmukh sounmukh 1361 Oct 26 09:11 Cisco-IOS-XR-um-traps-ipsla-cfg.yang
sounmukh@<<PYANG-DESKTOP>>/yang/vendor/cisco/xr/782$ pyang -f tree Cisco-IOS-XR-man-ipsla-oper.yang --tree-path ipsla/operation-data --tree-depth 5 module: Cisco-IOS-XR-man-ipsla-oper +--ro ipsla +--ro operation-data +--ro operations +--ro operation* [operation-id] +--ro common | ... +--ro lpd | ... +--ro history | ... +--ro statistics | ... +--ro operation-id Ipsla-operation-id
sounmukh@<<PYANG-DESKTOP>>/yang/vendor/cisco/xr/782$ pyang -f tree Cisco-IOS-XR-man-ipsla-oper.yang --tree-path ipsla/operation-data/operations/operation/statistics/latest/target --tree-depth 10 module: Cisco-IOS-XR-man-ipsla-oper +--ro ipsla +--ro operation-data +--ro operations +--ro operation* [operation-id] +--ro statistics +--ro latest +--ro target +--ro common-stats | +--ro operation-time? uint64 | +--ro return-code? Ipsla-ret-code | +--ro response-time-count? uint32 | +--ro response-time? uint32 | +--ro min-response-time? uint32 | +--ro max-response-time? uint32 | +--ro sum-response-time? uint32 | +--ro sum2-response-time? uint64 | +--ro update-count? uint32 | +--ro ok-count? uint32 | +--ro disconnect-count? uint32 | +--ro timeout-count? uint32 | +--ro busy-count? uint32 | +--ro no-connection-count? uint32 | +--ro dropped-count? uint32 | +--ro internal-error-count? uint32
/// Output truncated for brevity /// |
Because we can locate our KPI/leaf in this containers hierarchy, we will be able to build our telemetry sensor to stream the relevant data:
| Sensor Path: Cisco-IOS-XR-man-ipsla-oper:ipsla/operation-data/operations/operation/statistics/latest/target Sensor Path State: Resolved |
If you want to validate the value of the data on the data model, this is how you can do it (match this value with what we saw when we ran the CLI command):
| <<router>>#show yang operational man-ipsla-oper:ipsla operation-data operations operation statistics latest target common-stats response-time JSON { "Cisco-IOS-XR-man-ipsla-oper:ipsla": { "operation-data": { "operations": { "operation": [ { "operation-id": 10, "statistics": { "latest": { "target": { "common-stats": { "response-time": 0 } } } } }, { "operation-id": 20, "statistics": { "latest": { "target": { "common-stats": { "response-time": 4 } } } } }, { "operation-id": 30, "statistics": { "latest": { "target": { "common-stats": { "response-time": 3 } } } } } ] } } } } |
Note: RTT is round-trip time. To get one-way latency, you can divide this value by 2 to get an approximate time.
If you are aware of the latency boundary of your application, you know what thresholds you need to set to alert the operations teams.
2.7.13. IP SLA – jitter ingress
IP SLA ‒ jitter ingress: This is a performance monitoring KPI and will (as the name indicates) let you know about the jitter incurred by the probes ingressing into the system. The CLI command to validate this KPI is:
| <<router>>#show ipsla statistics 20 Entry number: 20 Modification time: 06:01:02.212 UTC Wed Jan 17 2024 Start time : 06:01:02.219 UTC Wed Jan 17 2024 Number of operations attempted: 12219 Number of operations skipped : 0 Current seconds left in Life : Forever Operational state of entry : Active Operational frequency(seconds): 300 Connection loss occurred : FALSE Timeout occurred : FALSE Latest RTT (milliseconds) : 4 Latest operation start time : 16:11:03.223 UTC Wed Feb 28 2024 Next operation start time : 16:16:03.223 UTC Wed Feb 28 2024 Latest operation return code : OK RTT Values: RTTAvg : 4 RTTMin: 3 RTTMax : 5 NumOfRTT: 30 RTTSum: 120 RTTSum2: 486 Packet Loss Values: PacketLossSD : 0 PacketLossDS : 0 PacketOutOfSequence: 0 PacketMIA : 0 PacketLateArrival : 0 PacketSkipped: 0 Errors : 0 Busies : 0 InvalidTimestamp : 0 Jitter Values : MinOfPositivesSD: 1 MaxOfPositivesSD: 1 NumOfPositivesSD: 3 SumOfPositivesSD: 3 Sum2PositivesSD : 3 MinOfNegativesSD: 1 MaxOfNegativesSD: 1 NumOfNegativesSD: 3 SumOfNegativesSD: 3 Sum2NegativesSD : 3 MinOfPositivesDS: 1 MaxOfPositivesDS: 1 NumOfPositivesDS: 4 SumOfPositivesDS: 4 Sum2PositivesDS : 4 MinOfNegativesDS: 1 MaxOfNegativesDS: 1 NumOfNegativesDS: 3 SumOfNegativesDS: 3 Sum2NegativesDS : 3 JitterAve: 1 JitterSDAve: 1 JitterDSAve: 1 Interarrival jitterout: 0 Interarrival jitterin: 0 One Way Values : NumOfOW: 30 OWMinSD : 2 OWMaxSD: 3 OWSumSD: 64 OWSum2SD: 140 OWAveSD: 2 OWMinDS : 1 OWMaxDS: 2 OWSumDS: 56 OWSum2DS: 108 OWAveDS: 1 |
The telemetry sensor will be the same as in Section 2.7.12.
| Sensor Path: Cisco-IOS-XR-man-ipsla-oper:ipsla/operation-data/operations/operation/statistics/latest/target Sensor Path State: Resolved |
If you want to validate the value of the data on the data model, this is how you can do it (match this value with what we saw when we ran the CLI command):
| <<router>>#show yang operational man-ipsla-oper:ipsla operation-data operations operation statistics latest target specific-stats udp-jitter-stats jitter-in $ { "Cisco-IOS-XR-man-ipsla-oper:ipsla": { "operation-data": { "operations": { "operation": [ { "operation-id": 10, "statistics": { "latest": { "target": { "specific-stats": { "udp-jitter-stats": { "jitter-in": 0 } } } } } }, { "operation-id": 20, "statistics": { "latest": { "target": { "specific-stats": { "udp-jitter-stats": { "jitter-in": 0 } } } } } }, { "operation-id": 30, "statistics": { "latest": { "target": { "specific-stats": { "udp-jitter-stats": { "jitter-in": 0 } } } } } } ] } } } } |
2.7.14. IP SLA – jitter egress
IP SLA ‒ jitter egress: This is a performance monitoring KPI and will (as the name indicates) let you know about the jitter incurred by the probes egressing into the system. The CLI command to validate this KPI is:
| <<router>>#show ipsla statistics 20 Entry number: 20 Modification time: 06:01:02.212 UTC Wed Jan 17 2024 Start time : 06:01:02.219 UTC Wed Jan 17 2024 Number of operations attempted: 12219 Number of operations skipped : 0 Current seconds left in Life : Forever Operational state of entry : Active Operational frequency(seconds): 300 Connection loss occurred : FALSE Timeout occurred : FALSE Latest RTT (milliseconds) : 4 Latest operation start time : 16:11:03.223 UTC Wed Feb 28 2024 Next operation start time : 16:16:03.223 UTC Wed Feb 28 2024 Latest operation return code : OK RTT Values: RTTAvg : 4 RTTMin: 3 RTTMax : 5 NumOfRTT: 30 RTTSum: 120 RTTSum2: 486 Packet Loss Values: PacketLossSD : 0 PacketLossDS : 0 PacketOutOfSequence: 0 PacketMIA : 0 PacketLateArrival : 0 PacketSkipped: 0 Errors : 0 Busies : 0 InvalidTimestamp : 0 Jitter Values : MinOfPositivesSD: 1 MaxOfPositivesSD: 1 NumOfPositivesSD: 3 SumOfPositivesSD: 3 Sum2PositivesSD : 3 MinOfNegativesSD: 1 MaxOfNegativesSD: 1 NumOfNegativesSD: 3 SumOfNegativesSD: 3 Sum2NegativesSD : 3 MinOfPositivesDS: 1 MaxOfPositivesDS: 1 NumOfPositivesDS: 4 SumOfPositivesDS: 4 Sum2PositivesDS : 4 MinOfNegativesDS: 1 MaxOfNegativesDS: 1 NumOfNegativesDS: 3 SumOfNegativesDS: 3 Sum2NegativesDS : 3 JitterAve: 1 JitterSDAve: 1 JitterDSAve: 1 Interarrival jitterout: 0 Interarrival jitterin: 0 One Way Values : NumOfOW: 30 OWMinSD : 2 OWMaxSD: 3 OWSumSD: 64 OWSum2SD: 140 OWAveSD: 2 OWMinDS : 1 OWMaxDS: 2 OWSumDS: 56 OWSum2DS: 108 OWAveDS: 1 |
The telemetry sensor will be the same as in Section 2.7.12.
| Sensor Path: Cisco-IOS-XR-man-ipsla-oper:ipsla/operation-data/operations/operation/statistics/latest/target Sensor Path State: Resolved |
If you want to validate the value of the data on the data model, this is how you can do it (match this value with what we saw when we ran the CLI command):
| <<router>># show yang operational man-ipsla-oper:ipsla operation-data operations operation statistics latest target specific-stats udp-jitter-stats jitter-out$ { "Cisco-IOS-XR-man-ipsla-oper:ipsla": { "operation-data": { "operations": { "operation": [ { "operation-id": 10, "statistics": { "latest": { "target": { "specific-stats": { "udp-jitter-stats": { "jitter-out": 0 } } } } } }, { "operation-id": 20, "statistics": { "latest": { "target": { "specific-stats": { "udp-jitter-stats": { "jitter-out": 0 } } } } } }, { "operation-id": 30, "statistics": { "latest": { "target": { "specific-stats": { "udp-jitter-stats": { "jitter-out": 0 } } } } } } ] } } } } |
2.7.15. IP SLA – packet loss source to destination
IP SLA packet loss ‒ source to destination: This is a performance monitoring KPI and will (as the name indicates) let the operator know the packets lost from source to destination in the journey of the probes. The CLI command to validate this KPI is:
| <<router>>#show ipsla statistics 20 Entry number: 20 Modification time: 06:01:02.212 UTC Wed Jan 17 2024 Start time : 06:01:02.219 UTC Wed Jan 17 2024 Number of operations attempted: 12219 Number of operations skipped : 0 Current seconds left in Life : Forever Operational state of entry : Active Operational frequency(seconds): 300 Connection loss occurred : FALSE Timeout occurred : FALSE Latest RTT (milliseconds) : 4 Latest operation start time : 16:11:03.223 UTC Wed Feb 28 2024 Next operation start time : 16:16:03.223 UTC Wed Feb 28 2024 Latest operation return code : OK RTT Values: RTTAvg : 4 RTTMin: 3 RTTMax : 5 NumOfRTT: 30 RTTSum: 120 RTTSum2: 486 Packet Loss Values: PacketLossSD : 0 PacketLossDS : 0 PacketOutOfSequence: 0 PacketMIA : 0 PacketLateArrival : 0 PacketSkipped: 0 Errors : 0 Busies : 0 InvalidTimestamp : 0 Jitter Values : MinOfPositivesSD: 1 MaxOfPositivesSD: 1 NumOfPositivesSD: 3 SumOfPositivesSD: 3 Sum2PositivesSD : 3 MinOfNegativesSD: 1 MaxOfNegativesSD: 1 NumOfNegativesSD: 3 SumOfNegativesSD: 3 Sum2NegativesSD : 3 MinOfPositivesDS: 1 MaxOfPositivesDS: 1 NumOfPositivesDS: 4 SumOfPositivesDS: 4 Sum2PositivesDS : 4 MinOfNegativesDS: 1 MaxOfNegativesDS: 1 NumOfNegativesDS: 3 SumOfNegativesDS: 3 Sum2NegativesDS : 3 JitterAve: 1 JitterSDAve: 1 JitterDSAve: 1 Interarrival jitterout: 0 Interarrival jitterin: 0 One Way Values : NumOfOW: 30 OWMinSD : 2 OWMaxSD: 3 OWSumSD: 64 OWSum2SD: 140 OWAveSD: 2 OWMinDS : 1 OWMaxDS: 2 OWSumDS: 56 OWSum2DS: 108 OWAveDS: 1 |
The telemetry sensor will be the same as in Section 2.7.12:
| Sensor Path: Cisco-IOS-XR-man-ipsla-oper:ipsla/operation-data/operations/operation/statistics/latest/target Sensor Path State: Resolved |
If you want to validate the value of the data on the data model, this is how you can do it (match this value with what we saw when we ran the CLI command):
| { "operation-id": 20, "statistics": { "latest": { "target": { "specific-stats": { "op-type": "udp-jitter", "udp-jitter-stats": { "jitter-in": 0, "jitter-out": 0, "packet-loss-sd": 0, "packet-loss-ds": 0, "packet-out-of-sequence": 0, "packet-mia": 0, "packet-skipped": 0, "packet-late-arrivals": 0, "packet-invalid-tstamp": 0, "internal-errors-count": 0, "busies-count": 0, "positive-sd-sum": 4, "positive-sd-sum2": "4", "positive-sd-min": 1, "positive-sd-max": 1, "positive-sd-count": 4, "negative-sd-sum": 4, "negative-sd-sum2": "4", "negative-sd-min": 1, "negative-sd-max": 1, "negative-sd-count": 4, "positive-ds-sum": 6, "positive-ds-sum2": "6", "positive-ds-min": 1, "positive-ds-max": 1, "positive-ds-count": 6, "negative-ds-sum": 6, "negative-ds-sum2": "6", "negative-ds-min": 1, "negative-ds-max": 1, "negative-ds-count": 6, "one-way-count": 30, "one-way-sd-min": 1, "one-way-sd-max": 2, "one-way-sd-sum": 54, "one-way-sd-sum2": "102", "one-way-ds-min": 2, "one-way-ds-max": 3, "one-way-ds-sum": 76, "one-way-ds-sum2": "200" } } } } } }, |
2.7.16. IP SLA – packet loss destination to source
IP SLA ‒ packet loss destination to source: This is a performance monitoring KPI and will (as the name indicates) let the operator know the packets lost from destination to source in the journey of the probes. The CLI command to validate this KPI is:
| <<router>>#show ipsla statistics 20 Entry number: 20 Modification time: 06:01:02.212 UTC Wed Jan 17 2024 Start time : 06:01:02.219 UTC Wed Jan 17 2024 Number of operations attempted: 12219 Number of operations skipped : 0 Current seconds left in Life : Forever Operational state of entry : Active Operational frequency(seconds): 300 Connection loss occurred : FALSE Timeout occurred : FALSE Latest RTT (milliseconds) : 4 Latest operation start time : 16:11:03.223 UTC Wed Feb 28 2024 Next operation start time : 16:16:03.223 UTC Wed Feb 28 2024 Latest operation return code : OK RTT Values: RTTAvg : 4 RTTMin: 3 RTTMax : 5 NumOfRTT: 30 RTTSum: 120 RTTSum2: 486 Packet Loss Values: PacketLossSD : 0 PacketLossDS : 0 PacketOutOfSequence: 0 PacketMIA : 0 PacketLateArrival : 0 PacketSkipped: 0 Errors : 0 Busies : 0 InvalidTimestamp : 0 Jitter Values : MinOfPositivesSD: 1 MaxOfPositivesSD: 1 NumOfPositivesSD: 3 SumOfPositivesSD: 3 Sum2PositivesSD : 3 MinOfNegativesSD: 1 MaxOfNegativesSD: 1 NumOfNegativesSD: 3 SumOfNegativesSD: 3 Sum2NegativesSD : 3 MinOfPositivesDS: 1 MaxOfPositivesDS: 1 NumOfPositivesDS: 4 SumOfPositivesDS: 4 Sum2PositivesDS : 4 MinOfNegativesDS: 1 MaxOfNegativesDS: 1 NumOfNegativesDS: 3 SumOfNegativesDS: 3 Sum2NegativesDS : 3 JitterAve: 1 JitterSDAve: 1 JitterDSAve: 1 Interarrival jitterout: 0 Interarrival jitterin: 0 One Way Values : NumOfOW: 30 OWMinSD : 2 OWMaxSD: 3 OWSumSD: 64 OWSum2SD: 140 OWAveSD: 2 OWMinDS : 1 OWMaxDS: 2 OWSumDS: 56 OWSum2DS: 108 OWAveDS: 1 |
The telemetry sensor will be the same as in Section 2.7.12:
| Sensor Path: Cisco-IOS-XR-man-ipsla-oper:ipsla/operation-data/operations/operation/statistics/latest/target Sensor Path State: Resolved |
If you want to validate the value of the data on the data model, this is how you can do it (match this value with what we saw when we ran the CLI command):
| { "operation-id": 20, "statistics": { "latest": { "target": { "specific-stats": { "op-type": "udp-jitter", "udp-jitter-stats": { "jitter-in": 0, "jitter-out": 0, "packet-loss-sd": 0, "packet-loss-ds": 0, "packet-out-of-sequence": 0, "packet-mia": 0, "packet-skipped": 0, "packet-late-arrivals": 0, "packet-invalid-tstamp": 0, "internal-errors-count": 0, "busies-count": 0, "positive-sd-sum": 4, "positive-sd-sum2": "4", "positive-sd-min": 1, "positive-sd-max": 1, "positive-sd-count": 4, "negative-sd-sum": 4, "negative-sd-sum2": "4", "negative-sd-min": 1, "negative-sd-max": 1, "negative-sd-count": 4, "positive-ds-sum": 6, "positive-ds-sum2": "6", "positive-ds-min": 1, "positive-ds-max": 1, "positive-ds-count": 6, "negative-ds-sum": 6, "negative-ds-sum2": "6", "negative-ds-min": 1, "negative-ds-max": 1, "negative-ds-count": 6, "one-way-count": 30, "one-way-sd-min": 1, "one-way-sd-max": 2, "one-way-sd-sum": 54, "one-way-sd-sum2": "102", "one-way-ds-min": 2, "one-way-ds-max": 3, "one-way-ds-sum": 76, "one-way-ds-sum2": "200" } } } } } }, |
2.7.17. IP SLA – responder probes count
IP SLA ‒ responder probes count: This is a performance monitoring KPI and will be implemented on the responder (of the initiated probe) to validate the count and health of the probes being sent. The CLI command to validate this KPI is:
| <<router>>#show ipsla responder statistics all ports
Local Address Port Port Type Probes Drops CtrlProbes Discard Protocol SendersCnt 10.152.84.121 9010 Dynamic 366900 0 12230 ON IPSLA 1 |
The telemetry sensor with the data model and the container information can be found with this command:
| <<router>>#yang-describe operational show ipsla responder statistics all ports YANG Paths: Cisco-IOS-XR-man-ipsla-oper:ipsla/responder/ports/port |
Let us have a look at the value of the data of this KPI (and validate it with our CLI output) on this router.
| <<router>>#show yang operational man-ipsla-oper:ipsla responder ports port num-probes JSON { "Cisco-IOS-XR-man-ipsla-oper:ipsla": { "responder": { "ports": { "port": [ { "port": 9010, "num-probes": 366930 } ] } } } } |
2.7.18. IP SLA – responder probes drops
IP SLA ‒ responder probes drops: This is a performance monitoring KPI and will be implemented on the responder (of the initiated probe) to validate the count and health of the probes being sent. The CLI command to validate this KPI is:
| <<router>>#show ipsla responder statistics all ports
Local Address Port Port Type Probes Drops CtrlProbes Discard Protocol SendersCnt 10.152.84.121 9010 Dynamic 366900 0 12230 ON IPSLA 1 |
The telemetry sensor with the data model and the container information can be found with this command:
| <<router>>#yang-describe operational show ipsla responder statistics all ports YANG Paths: Cisco-IOS-XR-man-ipsla-oper:ipsla/responder/ports/port |
Let us have a look at the value of the data of this KPI (and validate it with our CLI output) on this router.
| <<router>>#show yang operational man-ipsla-oper:ipsla responder ports port drop-counter JSON { "Cisco-IOS-XR-man-ipsla-oper:ipsla": { "responder": { "ports": { "port": [ { "port": 9010, "drop-counter": 0 } ] } } } } |
L2VPN Xconnect count: This is a performance monitoring KPI and will give you a count of Layer 2 VPN Xconnects deployed on the system. The CLI command to validate this KPI is:
| <<router>># show l2vpn xconnect summary Wed Feb 28 17:18:35.367 UTC Number of groups: 1 Number of xconnects: 2 Up: 2 Down: 0 Unresolved: 0 Partially-programmed: 0 AC-PW: 2 AC-AC: 0 PW-PW: 0 Monitor-Session-PW: 0 Number of Admin Down segments: 0 Number of MP2MP xconnects: 0 Up 0 Down 0 Advertised: 0 Non-Advertised: 0 Number of CE Connections: 0 Advertised: 0 Non-Advertised: 0 Backup PW: Configured : 0 UP : 0 Down : 0 Admin Down : 0 Unresolved : 0 Standby : 0 Standby Ready: 0 Backup Interface: Configured : 0 UP : 0 Down : 0 Admin Down : 0 Unresolved : 0 Standby : 0 |
The telemetry sensor with the data model and the container information can be found with this command:
| <<router>>#yang-describe operational show l2vpn xconnect summary YANG Paths: Cisco-IOS-XR-l2vpn-oper:l2vpnv2/active/xconnect-summary |
Now, we will dig deep into the data model and validate the value as stored on the system:
| <<router>>#show yang operational l2vpn-oper:l2vpnv2 active xconnect-summary number-xconnects JSON { "Cisco-IOS-XR-l2vpn-oper:l2vpnv2": { "active": { "xconnect-summary": { "number-xconnects": 2 } } } } |
2.7.20. L2VPN Xconnect up count
L2VPN Xconnect up count: This is a performance monitoring KPI and will give you a count of Layer 2 VPN Xconnects whose status is “up” on the system. The CLI command to validate this KPI is:
| <<router>># show l2vpn xconnect summary Wed Feb 28 17:18:35.367 UTC Number of groups: 1 Number of xconnects: 2 Up: 2 Down: 0 Unresolved: 0 Partially-programmed: 0 AC-PW: 2 AC-AC: 0 PW-PW: 0 Monitor-Session-PW: 0 Number of Admin Down segments: 0 Number of MP2MP xconnects: 0 Up 0 Down 0 Advertised: 0 Non-Advertised: 0 Number of CE Connections: 0 Advertised: 0 Non-Advertised: 0 Backup PW: Configured : 0 UP : 0 Down : 0 Admin Down : 0 Unresolved : 0 Standby : 0 Standby Ready: 0 Backup Interface: Configured : 0 UP : 0 Down : 0 Admin Down : 0 Unresolved : 0 Standby : 0 |
The telemetry sensor with the data model and the container information can be found with this command:
| <<router>>#yang-describe operational show l2vpn xconnect summary YANG Paths: Cisco-IOS-XR-l2vpn-oper:l2vpnv2/active/xconnect-summary |
Now, we will dig deep into the data model and validate the value as stored on the system:
| <<router>>#show yang operational l2vpn-oper:l2vpnv2 active xconnect-summary number-xconnects-up JSON { "Cisco-IOS-XR-l2vpn-oper:l2vpnv2": { "active": { "xconnect-summary": { "number-xconnects-up": 2 } } } } |
EVPN ‒ number of EVIs: This is a performance monitoring KPI and will give us a count of the Ethernet VPN instances (EVPN EVIs) active on the system. The CLI command to validate this KPI is:
| <<router>># show evpn summary ----------------------------- Global Information ----------------------------- Number of EVIs : 2 Number of TEPs : 12 Number of Local EAD Entries : 0 Number of Remote EAD Entries : 96 Number of Local MAC Routes : 6 MAC : 6 MAC-IPv4 : 0 MAC-IPv6 : 0 Number of Local ES:Global MAC : 1 Number of Remote MAC Routes : 71 MAC : 71 MAC-IPv4 : 0 MAC-IPv6 : 0 Number of Remote SYNC MAC Routes : 0 Number of Local IMCAST Routes : 1 Number of Remote IMCAST Routes : 12 Number of Internal Labels : 21 Number of single-home Internal IDs : 0 Number of multi-home Internal IDs : 0 Number of ES Entries : 6 Number of Neighbor Entries : 12 EVPN Router ID : 10.101.45.139 BGP ASN : 398378 PBB BSA MAC address : 482e.7299.b180 Global peering timer : 3 seconds Global recovery timer : 30 seconds Global carving timer : 0 seconds Global MAC postpone timer : 300 seconds [not running] Global core de-isolation timer : 60 seconds [not running] EVPN services costed out on node : No Startup-cost-in timer : Not configured EVPN manual cost-out : No EVPN Bundle Convergence : No |
The telemetry sensor with the data model and the container information can be found with this command:
| <<router>>#yang operational show evpn summary YANG Paths: Cisco-IOS-XR-evpn-oper:evpn/active/summary |
Now, we will study the data model and validate the value as stored in the system with that of the CLI output:
| <<router>>#show yang operational evpn-oper:evpn active summary ev-is JSON { "Cisco-IOS-XR-evpn-oper:evpn": { "active": { "summary": { "ev-is": 2 } } } } |
EVPN ‒ number of TEPs: This is a performance monitoring KPI and will give you a count of EVPN Tunnel EndPoints (TEPs) active on the system. The CLI command to validate this KPI is:
| <<router>># show evpn summary ----------------------------- Global Information ----------------------------- Number of EVIs : 2 Number of TEPs : 12 Number of Local EAD Entries : 0 Number of Remote EAD Entries : 96 Number of Local MAC Routes : 6 MAC : 6 MAC-IPv4 : 0 MAC-IPv6 : 0 Number of Local ES:Global MAC : 1 Number of Remote MAC Routes : 71 MAC : 71 MAC-IPv4 : 0 MAC-IPv6 : 0 Number of Remote SYNC MAC Routes : 0 Number of Local IMCAST Routes : 1 Number of Remote IMCAST Routes : 12 Number of Internal Labels : 21 Number of single-home Internal IDs : 0 Number of multi-home Internal IDs : 0 Number of ES Entries : 6 Number of Neighbor Entries : 12 EVPN Router ID : 10.101.45.139 BGP ASN : 398378 PBB BSA MAC address : 482e.7299.b180 Global peering timer : 3 seconds Global recovery timer : 30 seconds Global carving timer : 0 seconds Global MAC postpone timer : 300 seconds [not running] Global core de-isolation timer : 60 seconds [not running] EVPN services costed out on node : No Startup-cost-in timer : Not configured EVPN manual cost-out : No EVPN Bundle Convergence : No |
The telemetry sensor is the same as in Section 2.7.21.
Now, we will study the data model and validate the value as stored in the system with that of the CLI output:
| <<router>># show yang operational evpn-oper:evpn active summary tunnel-endpoints JSON { "Cisco-IOS-XR-evpn-oper:evpn": { "active": { "summary": { "tunnel-endpoints": 12 } } } } |
2.7.23. EVPN – number of Type 1 routes
EVPN: Number of Type 1 routes: This is a performance monitoring KPI and will give you a count of the remote Ethernet auto discovery routes OR number of EVPN Type 1 routes learned on this system. The CLI command to validate this KPI is:
| <<router>># show evpn summary ----------------------------- Global Information ----------------------------- Number of EVIs : 2 Number of TEPs : 12 Number of Local EAD Entries : 0 Number of Remote EAD Entries : 96 Number of Local MAC Routes : 6 MAC : 6 MAC-IPv4 : 0 MAC-IPv6 : 0 Number of Local ES:Global MAC : 1 Number of Remote MAC Routes : 71 MAC : 71 MAC-IPv4 : 0 MAC-IPv6 : 0 Number of Remote SYNC MAC Routes : 0 Number of Local IMCAST Routes : 1 Number of Remote IMCAST Routes : 12 Number of Internal Labels : 21 Number of single-home Internal IDs : 0 Number of multi-home Internal IDs : 0 Number of ES Entries : 6 Number of Neighbor Entries : 12 EVPN Router ID : 10.101.45.139 BGP ASN : 398378 PBB BSA MAC address : 482e.7299.b180 Global peering timer : 3 seconds Global recovery timer : 30 seconds Global carving timer : 0 seconds Global MAC postpone timer : 300 seconds [not running] Global core de-isolation timer : 60 seconds [not running] EVPN services costed out on node : No Startup-cost-in timer : Not configured EVPN manual cost-out : No EVPN Bundle Convergence : No |
The telemetry sensor is the same as in Section 2.7.21.
Now, we will study the data model and validate the value as stored in the system with that of the CLI output:
| <<router>>#show yang operational evpn-oper:evpn active summary remote-ead-routes JSON { "Cisco-IOS-XR-evpn-oper:evpn": { "active": { "summary": { "remote-ead-routes": 96 } } } } |
2.7.24. EVPN – number of Type 2 routes
EVPN: Number of Type 2 routes: This is a performance monitoring KPI and will give you a count of the remote MAC entries OR Type 2 routes on the system. The CLI command to validate this KPI is:
| <<router>># show evpn summary ----------------------------- Global Information ----------------------------- Number of EVIs : 2 Number of TEPs : 12 Number of Local EAD Entries : 0 Number of Remote EAD Entries : 96 Number of Local MAC Routes : 6 MAC : 6 MAC-IPv4 : 0 MAC-IPv6 : 0 Number of Local ES:Global MAC : 1 Number of Remote MAC Routes : 71 MAC : 71 MAC-IPv4 : 0 MAC-IPv6 : 0 Number of Remote SYNC MAC Routes : 0 Number of Local IMCAST Routes : 1 Number of Remote IMCAST Routes : 12 Number of Internal Labels : 21 Number of single-home Internal IDs : 0 Number of multi-home Internal IDs : 0 Number of ES Entries : 6 Number of Neighbor Entries : 12 EVPN Router ID : 10.101.45.139 BGP ASN : 398378 PBB BSA MAC address : 482e.7299.b180 Global peering timer : 3 seconds Global recovery timer : 30 seconds Global carving timer : 0 seconds Global MAC postpone timer : 300 seconds [not running] Global core de-isolation timer : 60 seconds [not running] EVPN services costed out on node : No Startup-cost-in timer : Not configured EVPN manual cost-out : No EVPN Bundle Convergence : No |
The telemetry sensor is the same as in Section 2.7.21.
Now, we will dig deep into the data model and validate the value as stored on the system:
| <<router>># show yang operational evpn-oper:evpn active summary remote-mac-routes JSON { "Cisco-IOS-XR-evpn-oper:evpn": { "active": { "summary": { "remote-mac-routes": 71 } } } } |
You can also monitor Type 3, Type 4, and Type 5 routes of EVPN if they are applicable to your network.
2.7.25. L3VPN – number of routes
This KPI (and telemetry sensor) is covered as part of Section 2.6.11.
2.7.26. L3VPN – number of VRFs
L3VPN ‒ number of VRFs: This is a performance monitoring KPI and will give you a count of number of Virtual Route Forwarding tables (VRFs) on the system. This is a composite KPI that needs to be built by the Observability application; it won’t be streaming out of the system. The JSON output (as read by the Observability application) will help you build this composite KPI.
| <<router>>#show yang operational ip-rib-ipv4-oper:rib vrfs vrf afs af safs saf ip-rib-route-table-names ip-rib-route-table-name protocol bgp as information routes-count JSON { "Cisco-IOS-XR-ip-rib-ipv4-oper:rib": { "vrfs": { "vrf": [ { "vrf-name": "RAN-F1C", "afs": { "af": [ { "af-name": "IPv4", "safs": { "saf": [ { "saf-name": "Unicast", "ip-rib-route-table-names": { "ip-rib-route-table-name": [ { "route-table-name": "default", "protocol": { "bgp": { "as": [ { "as": "398378", "information": { "routes-counts": 1 } } ] } } } ] } } ] } } ] } }, { "vrf-name": "RAN-F1U", "afs": { "af": [ { "af-name": "IPv4", "safs": { "saf": [ { "saf-name": "Unicast", "ip-rib-route-table-names": { "ip-rib-route-table-name": [ { "route-table-name": "default", "protocol": { "bgp": { "as": [ { "as": "398378", "information": { "routes-counts": 1 } } ] } } } ] } } ] } } ] } },, /// Output truncated for brevity /// |
SNMP traps drop count: This is a performance monitoring KPI and will indicate the drop count of a Simple Network Management Protocol (SNMP) trap Object Identifier (OID). The CLI command to validate this KPI is:
| <<router>>#show snmp traps details HOST:10.230.21.74, udp-port:1062 vrfname:default ------------------------------------------- TrapOID Sent DropInternal DropHost DropDelayTimer Last-sent Last-drop-internal Last-drop-host Last-drop-delaytimer bgp.0.1 1 0 0 2 Jan 15 24 06:18:31 ~ ~ Dec 18 23 21:40:28 bgp.0.2 1 0 0 0 Jan 15 24 06:18:08 ~ ~ ~ ciscoBgp4MIB.0.1 5 0 0 8 Jan 15 24 06:18:31 ~ ~ Dec 18 23 21:40:28 ciscoBgp4MIB.0.2 1 0 0 0 Jan 15 24 06:18:08 ~ ~ ~ ciscoBgp4MIB.0.5 1 0 0 2 Jan 15 24 06:18:31 ~ ~ Dec 18 23 21:40:28 ciscoBgp4MIB.0.6 1 0 0 0 Jan 15 24 06:18:08 ~ ~ ~ ciscoBgp4MIB.0.7 5 0 0 8 Jan 15 24 06:18:32 ~ ~ Dec 18 23 21:40:28 ciscoBgp4MIB.0.8 1 0 0 0 Jan 15 24 06:18:08 ~ ~ ~ ciscoConfigManMIB.2.0.1 3585 0 0 0 Feb 29 24 17:20:11 ~ ~ ~ ciscoEntityExtMIB.2.0.3 0 0 5 0 ~ ~ Dec 18 23 21:35:09 ~ ciscoEntityExtMIB.2.0.4 0 0 5 0 ~ ~ Dec 18 23 21:35:09 ~ ciscoIetfBfdMIB.0.1 31 0 0 1 Feb 16 24 12:02:39 ~ ~ Dec 18 23 21:40:28 ciscoIetfBfdMIB.0.2 51 0 0 0 Feb 16 24 12:01:48 ~ ~ ~ ciscoNetsyncMIB.0.1 524 0 1 0 Feb 29 24 07:49:08 ~ Dec 18 23 21:35:06 ~ ciscoNetsyncMIB.0.3 0 0 1 0 ~ ~ Dec 18 23 21:35:06 ~ ciscoNetsyncMIB.0.4 0 0 1 0 ~ ~ Dec 18 23 21:35:06 ~ ciscoNtpMIB.0.1 5 0 0 1 Dec 18 23 23:28:28 ~ ~ Dec 18 23 21:40:28 ciscoNtpMIB.0.2 3 0 0 0 Jan 15 24 22:27:24 ~ ~ ~ ciscoNtpMIB.0.3 4 0 0 0 Jan 15 24 23:53:45 ~ ~ ~ ciscoNtpMIB.0.4 2 0 0 0 Dec 18 23 23:23:54 ~ ~ ~ ciscoNtpMIB.0.5 3 0 0 0 Dec 18 23 23:28:29 ~ ~ ~ ciscoSyslogMIB.2.0.1 17282 0 308 76 Feb 29 24 07:49:23 ~ Jan 23 24 02:51:32 Dec 18 23 21:40:28 entConfigChange 0 0 1 0 ~ ~ Dec 18 23 21:35:09 ~ isisMIB.0.1 0 0 6 0 ~ ~ Dec 18 23 21:35:09 ~ isisMIB.0.15 35235 0 1 0 Feb 29 24 18:17:40 ~ Dec 18 23 21:35:20 ~ isisMIB.0.17 206 0 11 0 Feb 16 24 12:02:38 ~ Jan 23 24 02:51:32 ~ isisMIB.0.8 0 0 0 1 ~ ~ ~ Dec 18 23 21:40:28 snmpTraps.1 0 0 0 1 ~ ~ ~ Dec 18 23 21:40:28 snmpTraps.3 694 0 1 0 Feb 16 24 12:01:44 ~ Jan 23 24 02:51:32 ~ snmpTraps.4 694 0 27 0 Feb 16 24 12:01:45 ~ Jan 23 24 02:51:31 ~ transmission.166.11.0.1 3 0 2 0 Dec 20 23 20:00:47 ~ Dec 18 23 21:35:20 ~ transmission.166.11.0.2 3 0 0 0 Dec 20 23 19:59:58 ~ ~ ~ |
Let us try to build the telemetry sensor from the yang-describe information we have for this CLI command:
| <<router>># yang-describe operational show snmp traps details YANG Paths: Cisco-IOS-XR-snmp-agent-oper:snmp/information/trap-infos/trap-info |
Now we will have a look at the KPI/leaf based on the telemetry sensor/container information provided above:
| <<router>>show yang operational snmp-agent-oper:snmp information trap-infos trap-info JSON { "Cisco-IOS-XR-snmp-agent-oper:snmp": { "information": { "trap-infos": { "trap-info": [ { "trap-host": "10.230.21.74", "port": 1062, "host": "10.230.21.74", "port-xr": 1062, "vrf-name": "default", "time": 0, "trap-oid-count": 32, "trap-oi-dinfo": [ { "trap-oid": "bgp.0.1", "count": 1, "drop-count": 0, "drop-host-count": 0, "drop-delay-timer": 2, "retry-count": 0, "lastsent-time": "Jan 15 24 06:18:31", "lastdrop-time": "~", "last-hostdrop-time": "~", "last-host-delay-time": "Dec 18 23 21:40:28" }, { "trap-oid": "bgp.0.2", "count": 1, "drop-count": 0, "drop-host-count": 0, "drop-delay-timer": 0, "retry-count": 0, "lastsent-time": "Jan 15 24 06:18:08", "lastdrop-time": "~", "last-hostdrop-time": "~", "last-host-delay-time": "~" }, |
SRPM (segment routing performance measurement) – average latency: This is a performance monitoring KPI and will indicate the average latency incurred on a segment routing session as reported by probes. The telemetry sensor and leaf information are captured below:
| Sensor: Cisco-IOS-XR-perf-meas-oper:performance-measurement/nodes/node/sessions/session/session/interface-session/session/current-probe/probe-results
KPI: average (in Micro-Seconds) |
LPTS drops: This is a performance monitoring KPI and will indicate the drops on Local Packet Transport Services (LPTS) for each feature set on the system. It will help you design the flows better on the system as far as policing is concerned. The telemetry sensor and leaf information are captured below:
| Sensor: Cisco-IOS-XR-lpts-pre-ifib-oper:lpts-pifib/nodes/node/pifib-hw-flow-policer-stats/pifib-hw-flow-policer-stat
KPI: dropped |
VOQ drops: This is a performance monitoring KPI and will indicate the drops on Virtual Output Queuing (VOQ) for interface-handle and traffic-class on the system. The telemetry sensor and leaf information are captured below:
| Sensor: Cisco-IOS-XR-fretta-bcm-dpa-npu-stats-oper:dpa/stats/nodes/node/npu-numbers/npu-number/display/interface-handles/interface-handle
KPI: dropped-packets |
Interface reliability: This is a performance monitoring KPI and will indicate the reliability of an interface. If the reliability shows 255/255, it means the interface is currently 100% reliable. The telemetry sensor and leaf information are captured below:
| Sensor: Cisco-IOS-XR-pfi-im-cmd-oper:interfaces/interface-xr/interface/data-rates
KPI: reliability
JSON Data Value:
<<router>>#sh yang operational pfi-im-cmd-oper:interfaces interface-xr interface data-rates reliability JSON { "Cisco-IOS-XR-pfi-im-cmd-oper:interfaces": { "interface-xr": { "interface": [ { "interface-name": "BVI201", "data-rates": { "reliability": 255 } },
/// Output truncated for brevity /// |
MACs learned: This is a performance monitoring KPI and will indicate the MAC addresses learned on the system. There is no KPI for a MAC count, but your Observability application can build a MAC count KPI. The telemetry sensor and leaf information are captured below:
| Sensor: Cisco-IOS-XR-l2vpn-oper:l2vpn-forwarding/nodes/node/l2fib-mac-learning/l2fib-mac-learning-macs/l2fib-mac-learning-mac
KPI: mac-address
JSON Data Value:
<<router>>#show yang operational l2vpn-oper:l2vpn-forwarding nodes node l2fib-mac-learning l2fib-mac-learning-macs l2fib-mac-learning-mac JSON Fri Mar 1 17:15:38.051 UTC { "Cisco-IOS-XR-l2vpn-oper:l2vpn-forwarding": { "nodes": { "node": [ { "node-id": "0/RP0/CPU0", "l2fib-mac-learning": { "l2fib-mac-learning-macs": { "l2fib-mac-learning-mac": [ { "bdid": 0, "mac-address": "00:50:56:9d:b0:db", "element-type": 0, "attributes": { "node-id": "0/RP0/CPU0", "topology-id": 0, "mac-address": "00:50:56:9d:b0:db",
/// Output truncated for brevity /// |
NTP status stratum: This is a performance monitoring KPI and will indicate the status of the system stratum of Network Time Protocol (NTP), which also lets you know the distance between the device and the clock source. Stratum 0 is the GPS satellite itself. The telemetry sensor and leaf information are captured below:
| Sensor: Cisco-IOS-XR-ip-ntp-oper:ntp/nodes/node/status
KPI: sys-stratum
JSON Data Value:
<<router>># show yang operational ip-ntp-oper:ntp nodes node status sys-stratum JSON { "Cisco-IOS-XR-ip-ntp-oper:ntp": { "nodes": { "node": [ { "node": "0/RP0/CPU0", "status": { "sys-stratum": 3 } } ] } } }
/// Output truncated for brevity /// |
QoS – total class maps: This is a performance monitoring KPI and will indicate the total number of QoS class maps installed on the system. The telemetry sensor and leaf information are captured below:
| Sensor: Cisco-IOS-XR-infra-policymgr-oper:policy-manager/global/summary
KPI: total-class-maps
JSON Data Value:
<<router>># show yang operational infra-policymgr-oper:policy-manager global summary total-class-maps JSON Fri Mar 1 17:36:42.957 UTC { "Cisco-IOS-XR-infra-policymgr-oper:policy-manager": { "global": { "summary": { "total-class-maps": 15 } } } }
/// Output truncated for brevity /// |
2.8.9. QoS – total policy maps
QoS – total policy maps: This is a performance monitoring KPI and will indicate the total number of QoS policy maps installed on the system. The telemetry sensor and leaf information are captured below:
|
Sensor: Cisco-IOS-XR-infra-policymgr-oper:policy-manager/global/summary
KPI: total-policy-maps
JSON Data Value:
<<router>># show yang operational infra-policymgr-oper:policy-manager global summary total-policy-maps JSON Fri Mar 1 17:36:55.051 UTC { "Cisco-IOS-XR-infra-policymgr-oper:policy-manager": { "global": { "summary": { "total-policy-maps": 5 } } } } /// Output truncated for brevity /// |
ARP entries count: This is a performance monitoring KPI and will indicate the number of Address Resolution Protocol (ARP) entries on your cell site router. There is no direct KPI indicating the count, but your Observability application should be able to build the composite KPI to count the TCP session entries. The telemetry sensor and leaf information are captured below:
| Sensor: Cisco-IOS-XR-ipv4-arp-oper:nodes/node/adjacency-history-all
KPI: arp-entry
JSON Data Value:
<<router>>#show yang operational ipv4-arp-oper:arp nodes node adjacency-history-all arp-entry JSON { "Cisco-IOS-XR-ipv4-arp-oper:arp": { "nodes": { "node": [ { "node-name": "0/RP0/CPU0", "adjacency-history-all": { "arp-entry": [ { "idb-interface-name": "GigabitEthernet0/0/0/19.3002", "ipv4-address": "10.142.16.53", "mac-address": "04:bd:97:9e:c9:cc", "client-id": 0, "entry-state": -1073741823, "protocol": 12, "result": 0, "type": 1, "nsec-timestamp": "1697003274457896713" },
/// Output truncated for brevity /// |
TCP sessions count: This is a performance monitoring KPI and will indicate the number of Transmission Control Protocol (TCP) sessions active on a cell site router. There is no direct KPI indicating the count, but your Observability application should be able to build the composite KPI to count the TCP session entries. The telemetry sensor and leaf information are captured below:
| Sensor: Cisco-IOS-XR-ip-tcp-oper:tcp-connection/nodes/node/brief-informations/brief-information KPI: connection-state
JSON Data Value:
<<router>>#show yang operational ip-tcp-oper:tcp-connection nodes node brief-informations brief-information JSON { "Cisco-IOS-XR-ip-tcp-oper:tcp-connection": { "nodes": { "node": [ { "id": "0/RP0/CPU0", "brief-informations": { "brief-information": [ { "pcb-id": "558a64ab7fa0", "af-name": "ipv6", "pcb": "94052882808736", "connection-state": "listen", "local-pid": 9746, "local-address": { "af-name": "ipv6", "ipv6-address": "::" }, "foreign-address": { "af-name": "ipv6", "ipv6-address": "::" }, "local-port": 179, "foreign-port": 0, "current-receive-queue-size": 0, "current-send-queue-size": 0, "vrf-id": 1610612736 },
/// Output truncated for brevity /// |
2.9. Radio access network KPIs
If we have perfect interlock between the Radio Access Network (RAN) and the transport network, we should be able to monitor RAN KPIs and correlate them with transport KPIs. Here is a sample list of RAN KPIs that are useful for the transport team to monitor.
2.9.1. Radio unit clock status
The radio unit connected to the cell site router should be locked (in phase, time, and frequency) to the clock distributed by the cell site router, as discussed in Section 2.4.1. This is essential for the health of user plane data communication.
2.9.2. Distributed unit clock status
The distributed unit connected to the cell site router should be locked (in phase, time, and frequency) to the clock distributed by the cell site router, as discussed in Section 2.4.1. This is essential for the health of user plane data communication.
Cell status, or the health of the cells connected to a cell site, is another critical RAN KPI and can be correlated with transport KPIs like CSR “uplink” interface operational status and interface input/output drops.
Sector status, or the health of the sectors connected to a cell site, is another critical RAN KPI and can be correlated with transport KPIs like CSR “uplink” interface operational status.
The quality of the cells connected to a cell site is another critical RAN KPI and can be correlated with transport KPIs like CSR interface ingress/egress throughput, input/output drops, and interface errors.
| Serial |
Telemetry Sensor |
KPI/composite KPI |
| 1 |
Cisco-IOS-XR-install-augmented-oper:install/version/brief |
version |
| 2 |
Cisco-IOS-XR-install-augmented-oper:install/version/brief |
uptime |
| 3 |
Cisco-IOS-XR-linux-os-reboot-history-oper:reboot-history/node |
reboot-history |
| 4 |
Cisco-IOS-XR-alarmgr-server-oper:alarms/brief/brief-system/active |
alarm-info |
| 5 |
Cisco-IOS-XR-invmgr-oper:inventory/entities/entity/attributes/inv-basic-flag |
model-name |
| 6 |
Cisco-IOS-XR-wdsysmon-fd-oper: system-monitoring/cpu-utilization |
total-cpu-five-minute |
| 7 |
Cisco-IOS-XR-nto-misc-oper:memory-summary/nodes/node/detail |
free-physical-memory |
| 8 |
Cisco-IOS-XR-mediasvr-linux-oper:media-svr/nodes/node/partition |
used |
| 9 |
Cisco-IOS-XR-NCS-BDplatforms-npu-resources-oper:hw-resources-datas/hw-resources-data |
lem/total in-use |
| 10 |
Cisco-IOS-XR-NCS-BDplatforms-npu-resources-oper:hw-resources-datas/hw-resources-data |
lpm/total in-use |
| 11 |
Cisco-IOS-XR-NCS-BDplatforms-npu-resources-oper:hw-resources-datas/hw-resources-data |
fec/total in-use |
| 12 |
Cisco-IOS-XR-NCS-BDplatforms-npu-resources-oper:hw-resources-datas/hw-resources-data |
ecmp_fec/total in-use |
| 13 |
Cisco-IOS-XR-NCS-BDplatforms-npu-resources-oper:hw-resources-datas/hw-resources-data |
encap/total in-use |
| 14 |
Cisco-IOS-XR-envmon-oper:power-management/rack/chassis |
total-pwr-output |
| 15 |
Cisco-IOS-XR-envmon-oper:environmental-monitoring/rack/nodes/node/sensor-types/sensor-type/sensor-names/sensor-name |
temperature/sensor-value |
| 16 |
Cisco-IOS-XR-envmon-oper:environmental-monitoring/rack/nodes/node/sensor-types/sensor-type/sensor-names/sensor-name |
current/sensor-value |
| 17 |
Cisco-IOS-XR-envmon-oper:environmental-monitoring/rack/nodes/node/sensor-types/sensor-type/sensor-names/sensor-name |
voltage/sensor-value |
| 18 |
Cisco-IOS-XR-envmon-oper:environmental-monitoring/rack/nodes/node/sensor-types/sensor-type/sensor-names/sensor-name |
fan/sensor-value |
| 19 |
Cisco-IOS-XR-controller-optics-oper:optics-oper/optics-ports/optics-port/optics-info |
laser-state |
| 20 |
Cisco-IOS-XR-controller-optics-oper:optics-oper/optics-ports/optics-port/optics-info |
led-state |
| 21 |
Cisco-IOS-XR-controller-optics-oper:optics-oper/optics-ports/optics-port/optics-info |
controller-state |
| 22 |
Cisco-IOS-XR-controller-optics-oper:optics-oper/optics-ports/optics-port/optics-lanes |
transmit-power |
| 23 |
Cisco-IOS-XR-controller-optics-oper:optics-oper/optics-ports/optics-port/optics-lanes |
receive-power |
| 24 |
Cisco-IOS-XR-controller-optics-oper:optics-oper/optics-ports/optics-port/optics-lanes |
laser-bias-current-milli-amps |
| 25 |
Cisco-IOS-XR-gnss-oper:gnss-receiver/nodes/node/receivers/receiver |
lock-status |
| 26 |
Cisco-IOS-XR-gnss-oper:gnss-receiver/nodes/node/receivers/receiver |
major-alarm |
| 27 |
Cisco-IOS-XR-gnss-oper:gnss-receiver/nodes/node/receivers/receiver |
satellite |
| 28 |
Cisco-IOS-XR-gnss-oper:gnss-receiver/nodes/node/receivers/receiver |
Signal-strength |
| 29 |
Cisco-IOS-XR-ptp-oper:ptp/advertised-clock |
class |
| 30 |
Cisco-IOS-XR-ptp-oper:ptp/interfaces/interface |
line-state |
| 31 |
Cisco-IOS-XR-ptp-oper:ptp/interfaces/interface |
port-state |
| 32 |
Cisco-IOS-XR-freqsync-oper:frequency-synchronization/nodes/node/selection-point-inputs/selection-point-input[selection-point=3] |
platform-status |
| 33 |
Cisco-IOS-XR-pfi-im-cmd-oper:interfaces/interface-xr/interface |
state |
| 34 |
Cisco-IOS-XR-pfi-im-cmd-oper:interfaces/interface-xr/interface |
line-state |
| 35 |
Cisco-IOS-XR-pfi-im-cmd-oper:interfaces/interface-xr/interface |
input-packet-rate |
| 36 |
Cisco-IOS-XR-pfi-im-cmd-oper:interfaces/interface-xr/interface |
output-packet-rate |
| 37 |
Cisco-IOS-XR-pfi-im-cmd-oper:interfaces/interface-xr/interface |
input-data-rate |
| 38 |
Cisco-IOS-XR-pfi-im-cmd-oper:interfaces/interface-xr/interface |
output-data-rate |
| 39 |
Cisco-IOS-XR-pfi-im-cmd-oper:interfaces/interface-xr/interface |
ingress bandwidth utilization |
| 40 |
Cisco-IOS-XR-pfi-im-cmd-oper:interfaces/interface-xr/interface |
egress bandwidth utilization |
| 41 |
Cisco-IOS-XR-pfi-im-cmd-oper:interfaces/interface-xr/interface |
total device throughput |
| 42 |
Cisco-IOS-XR-pfi-im-cmd-oper:interfaces/interface-xr/interface |
carrier-transitions |
| 43 |
Cisco-IOS-XR-drivers-media-eth-oper:ethernet-interface/statistics/statistic |
interface errors |
| 44 |
Cisco-IOS-XR-drivers-media-eth-oper:ethernet-interface/statistics/statistic |
interface input drops |
| 45 |
Cisco-IOS-XR-drivers-media-eth-oper:ethernet-interface/statistics/statistic |
interface output drops |
| 46 |
Cisco-IOS-XR-drivers-media-eth-oper:ethernet-interface/statistics/statistic |
MTU profile |
| 47 |
Cisco-IOS-XR-ipv4-bgp-oper:bgp/instances/instance/instance-active/default-vrf/sessions/session
Cisco-IOS-XR-ipv4-bgp-oper:bgp/instances/instance/instance-active/vrfs/vrf/sessions/session |
connection-state |
| 48 |
Cisco-IOS-XR-ipv4-bgp-oper:bgp/instances/instance/instance-active/default-vrf/process-info/global |
established-neighbors-count-total
|
| 49 |
Cisco-IOS-XR-clns-isis-oper:isis/instances/instance/levels/level/adjacencies/adjacency |
adjacency-state |
| 50 |
Cisco-IOS-XR-clns-isis-oper:isis/instances/instance/nbr-summ-stats |
nbr-summ-stats |
| 51 |
Cisco-IOS-XR-ipv4-ospf-oper:ospf/processes/process/default-vrf/adjacency-information/neighbors/neighbor |
neighbor-state |
| 52 |
Cisco-IOS-XR-ipv4-ospf-oper:ospf/processes/process/default-vrf/process-information/process-summary |
number-nbrs-full |
| 53 |
Cisco-IOS-XR-ip-bfd-oper:bfd/session-briefs/session-brief |
state |
| 54 |
Cisco-IOS-XR-ip-bfd-oper:bfd/summary |
up-count |
| 55 |
Cisco-IOS-XR-ip-rib-ipv4-oper:rib/vrfs/vrf/afs/af/safs/saf/ip-rib-route-table-names/ip-rib-route-table-name/protocol/isis/as/information |
routes-counts |
| 56 |
Cisco-IOS-XR-ip-rib-ipv4-oper:rib/vrfs/vrf/afs/af/safs/saf/ip-rib-route-table-names/ip-rib-route-table-name/protocol/ospf/as/information |
routes-counts |
| 57 |
Cisco-IOS-XR-ip-rib-ipv4-oper:rib/vrfs/vrf/afs/af/safs/saf/ip-rib-route-table-names/ip-rib-route-table-name/protocol/bgp/as/information |
routes-counts |
| 58 |
Cisco-IOS-XR-ip-rib-ipv4-oper:rib/vrfs/vrf/afs/af/safs/saf/ip-rib-route-table-names/ip-rib-route-table-name/protocol/static |
routes-counts |
| 59 |
Cisco-IOS-XR-fib-common-oper:fib-statistics/nodes/node/drops |
CEF drops |
| 60 |
Cisco-IOS-XR-qos-ma-oper:qos/interface-table/interface/input/service-policy-names/service-policy-instance/statistics |
transmit-packets
|
| 61 |
Cisco-IOS-XR-qos-ma-oper:qos/interface-table/interface/input/service-policy-names/service-policy-instance/statistics |
total-drop-packets |
| 62 |
Cisco-IOS-XR-qos-ma-oper:qos/interface-table/interface/input/service-policy-names/service-policy-instance/statistics |
tail-drop-packets |
| 63 |
Cisco-IOS-XR-qos-ma-oper:qos/interface-table/interface/input/service-policy-names/service-policy-instance/statistics |
conform-packets |
| 64 |
Cisco-IOS-XR-qos-ma-oper:qos/interface-table/interface/input/service-policy-names/service-policy-instance/statistics |
exceed-packets |
| 65 |
Cisco-IOS-XR-qos-ma-oper:qos/interface-table/interface/output/service-policy-names/service-policy-instance/statistics |
transmit-packets
|
| 66 |
Cisco-IOS-XR-qos-ma-oper:qos/interface-table/interface/output/service-policy-names/service-policy-instance/statistics |
total-drop-packets |
| 67 |
Cisco-IOS-XR-qos-ma-oper:qos/interface-table/interface/output/service-policy-names/service-policy-instance/statistics |
tail-drop-packets |
| 68 |
Cisco-IOS-XR-qos-ma-oper:qos/interface-table/interface/output/service-policy-names/service-policy-instance/statistics |
conform-packets |
| 69 |
Cisco-IOS-XR-qos-ma-oper:qos/interface-table/interface/output/service-policy-names/service-policy-instance/statistics |
exceed-packets |
| 70 |
Cisco-IOS-XR-man-ipsla-oper:ipsla/operation-data/operations/operation/statistics/latest/target |
response-time |
| 71 |
Cisco-IOS-XR-man-ipsla-oper:ipsla/operation-data/operations/operation/statistics/latest/target |
jitter-in |
| 72 |
Cisco-IOS-XR-man-ipsla-oper:ipsla/operation-data/operations/operation/statistics/latest/target |
jitter-out |
| 73 |
Cisco-IOS-XR-man-ipsla-oper:ipsla/operation-data/operations/operation/statistics/latest/target |
packet-loss-sd |
| 74 |
Cisco-IOS-XR-man-ipsla-oper:ipsla/operation-data/operations/operation/statistics/latest/target |
packet-loss-ds |
| 75 |
Cisco-IOS-XR-man-ipsla-oper:ipsla/responder/ports/port |
num-probes |
| 76 |
Cisco-IOS-XR-man-ipsla-oper:ipsla/responder/ports/port |
drops-counter |
| 77 |
Cisco-IOS-XR-l2vpn-oper:l2vpnv2/active/xconnect-summary |
number-xconnects |
| 78 |
Cisco-IOS-XR-l2vpn-oper:l2vpnv2/active/xconnect-summary |
number-xconnects-up |
| 79 |
Cisco-IOS-XR-evpn-oper:evpn/active/summary |
ev-is |
| 80 |
Cisco-IOS-XR-evpn-oper:evpn/active/summary |
tunnel-endpoints |
| 81 |
Cisco-IOS-XR-evpn-oper:evpn/active/summary |
remote-ead-routes |
| 82 |
Cisco-IOS-XR-evpn-oper:evpn/active/summary |
remote-mac-routes |
| 83 |
Cisco-IOS-XR-ip-rib-ipv4-oper:rib/vrfs/vrf/afs/af/safs/saf/ip-rib-route-table-names/ip-rib-route-table-name/protocol/bgp/as/information |
VRF/routes-counts |
| 84 |
Cisco-IOS-XR-ip-rib-ipv4-oper:rib/vrfs/vrf/afs/af/safs/saf/ip-rib-route-table-names/ip-rib-route-table-name/protocol/bgp/as/information |
VRF count |
| 85 |
Cisco-IOS-XR-snmp-agent-oper:snmp/information/trap-infos/trap-info |
drop-count |
| 86 |
Cisco-IOS-XR-perf-meas-oper:performance-measurement/nodes/node/sessions/session/session/interface-session/session/current-probe/probe-results |
average |
| 87 |
Cisco-IOS-XR-lpts-pre-ifib-oper:lpts-pifib/nodes/node/pifib-hw-flow-policer-stats/pifib-hw-flow-policer-stat |
dropped |
| 88 |
Cisco-IOS-XR-fretta-bcm-dpa-npu-stats-oper:dpa/stats/nodes/node/npu-numbers/npu-number/display/interface-handles/interface-handle |
dropped-packets |
| 89 |
Cisco-IOS-XR-pfi-im-cmd-oper:interfaces/interface-xr/interface/data-rates |
reliability |
| 90 |
Cisco-IOS-XR-l2vpn-oper:l2vpn-forwarding/nodes/node/l2fib-mac-learning/l2fib-mac-learning-macs/l2fib-mac-learning-mac |
MACs learned |
| 91 |
Cisco-IOS-XR-ip-ntp-oper:ntp/nodes/node/status |
sys-stratum |
| 92 |
Cisco-IOS-XR-infra-policymgr-oper:policy-manager/global/summary |
total-class-maps |
| 93 |
Cisco-IOS-XR-infra-policymgr-oper:policy-manager/global/summary |
total-policy-maps |
| 94 |
Cisco-IOS-XR-ipv4-arp-oper:nodes/node/adjacency-history-all |
ARP entries count |
| 95 |
Cisco-IOS-XR-ip-tcp-oper:tcp-connection/nodes/node/brief-informations/brief-information |
TCP sessions count |
| 96 |
--- Contact your RAN Vendor --- |
RU clock status |
| 97 |
--- Contact your RAN Vendor --- |
DU clock status |
| 98 |
--- Contact your RAN Vendor --- |
Cell status |
| 99 |
--- Contact your RAN Vendor --- |
Sector status |
| 100 |
--- Contact your RAN Vendor --- |
Cell quality |
4. Data sizing: What do you need to monitor?
The amount of data that you can monitor depends on the “data sizing” homework that you do before implementing all these critical KPIs of a 5G cell site router. Let us try to understand what calculations can be done in a lab before implementing this huge list of KPIs. We will take three examples from a cell site router:
● 1 collection – 1 packet
● 1 collection – 2 packets
● 1 collection – Many packets
| show telemetry model-driven internal subscription
Collection Groups: ------------------ Id: 142 Sample Interval: 300000 ms Heartbeat Interval: NA Heartbeat always: False Encoding: gnmi-json Num of collection: 1280 Incremental updates: 0 Collection time: Min: 3 ms Max: 26 ms Total time: Min: 3 ms Avg: 7 ms Max: 26 ms Total Deferred: 0 Total Send Errors: 0 Total Send Drops: 0 Total Other Errors: 0 No data Instances: 0 Last Collection Start:2024-03-05 18:31:11.199278457 +0000 Last Collection End: 2024-03-05 18:31:11.199284457 +0000 Sensor Path: Cisco-IOS-XR-gnss-oper:gnss-receiver/nodes/node/receivers/receiver Sysdb Path: /oper/gnss-receiver/node/*/number/* Count: 1280 Method: DATALIST Min: 3 ms Avg: 7 ms Max: 26 ms Item Count: 1280 Status: Active Missed Collections:0 send bytes: 2882497 packets: 1280 dropped bytes: 0 Missed Heartbeats: 0 Filtered Item Count: 0 success errors deferred/drops Gets 0 0 List 1280 0 Datalist 1280 0 Finddata 1280 0 GetBulk 0 0 Encode 0 0 Send 0 0 /// Output truncated for brevity /// |
This is an example of 1 packet sent (which is a gNMI response in this case) for 1 collection of data. This is the GNSS receiver telemetry sensor as defined in Section 2.4.1. The sample interval defined is 5 minutes. So there are 288 (24 x 12) packets sent for GNSS receiver KPIs in a day. If you look at “send bytes,” you can calculate that we send 2.2 Kb of data per packet. If we send 288 packets, that’s a sizing of about 633 Kb of data per router for GNSS receiver KPIs.
| show telemetry model-driven internal subscription
Id: 158 Sample Interval: 3600000 ms Heartbeat Interval: NA Heartbeat always: False Encoding: gnmi-json Num of collection: 107 Incremental updates: 0 Collection time: Min: 239 ms Max: 373 ms Total time: Min: 376 ms Avg: 435 ms Max: 513 ms Total Deferred: 0 Total Send Errors: 0 Total Send Drops: 0 Total Other Errors: 0 No data Instances: 107 Last Collection Start:2024-03-05 17:56:11.2394248753 +0000 Last Collection End: 2024-03-05 17:56:11.2394645753 +0000 Sensor Path: Cisco-IOS-XR-ip-rib-ipv4-oper:rib/vrfs/vrf/afs/af/safs/saf/ip-rib-route-table-names/ip-rib-route-table-name/protocol/isis/as/information
Sysdb Path: /oper/ipv4-rib/gl/vrf/*/afi/*/safi/*/table/*/proto/isis/*/info Count: 107 Method: FINDDATA Min: 239 ms Avg: 306 ms Max: 373 ms Item Count: 214 Status: Active Missed Collections:0 send bytes: 120482 packets: 214 dropped bytes: 0 Missed Heartbeats: 0 Filtered Item Count: 0 success errors deferred/drops Gets 214 0 List 2889 0 Datalist 0 0 Finddata 0 0 GetBulk 0 0 Encode 0 0 Send 0 0 /// Output truncated for brevity /// |
This is an example of 2 packets sent for 1 collection of data. This is the IPv4 RIB IS-IS telemetry sensor as defined in Section 2.6.9. The sample interval defined is 60 minutes. So there are 48 (24 x 2) packets sent for IPv4 RIB IS-IS KPIs in a day. If you look at “send bytes,” you can calculate that we send 0.5 Kb of data per packet. If we send 48 packets, that’s a sizing of about 24 Kb of data per router for IPv4 RIB IS-IS KPIs.
| show telemetry model-driven internal subscription
Id: 161 Sample Interval: 3600000 ms Heartbeat Interval: NA Heartbeat always: False Encoding: gnmi-json Num of collection: 107 Incremental updates: 0 Collection time: Min: 43 ms Max: 70 ms Total time: Min: 43 ms Avg: 57 ms Max: 74 ms Total Deferred: 0 Total Send Errors: 0 Total Send Drops: 0 Total Other Errors: 0 No data Instances: 0 Last Collection Start:2024-03-05 17:56:11.2394291753 +0000 Last Collection End: 2024-03-05 17:56:11.2394348753 +0000 Sensor Path: Cisco-IOS-XR-drivers-media-eth-oper:ethernet-interface/statistics/statistic
Sysdb Path: /oper/ethernet_drvr/stats/ifg/* Count: 107 Method: DATALIST Min: 43 ms Avg: 55 ms Max: 70 ms Item Count: 2889 Status: Active Missed Collections:0 send bytes: 6830392 packets: 2889 dropped bytes: 0 Missed Heartbeats: 0 Filtered Item Count: 0 success errors deferred/drops Gets 0 0 List 0 0 Datalist 107 0 Finddata 0 0 GetBulk 0 0 Encode 0 0 Send 0 0 /// Output truncated for brevity /// |
This is an example of 27 packets sent for 1 collection of data. This is the media Ethernet statistics telemetry sensor as defined in Section 2.5.12. The sample interval defined is 60 minutes. So there are 648 (24 x 27) packets sent for media Ethernet statistics in a day. If we send 648 packets, that’s a sizing of about 1.5 Mb of data per router for media Ethernet statistics KPIs.
Based on the above sizing analysis, you can decide how many KPIs you want to implement on your network.
5. Analysis of KPIs: Univariate profiling
Classification, analysis, and correlation are essential capabilities of an Observability platform beyond the mundane data collection and visualization.
In the example below, you can observe that CPU utilization increases every night at 1:00 a.m. UTC on this cell site router.

Univariate KPI profiling: CPU utilization
Similarly, the cell site environmental temperature increases at 22:00 UTC every day for this cell site router.
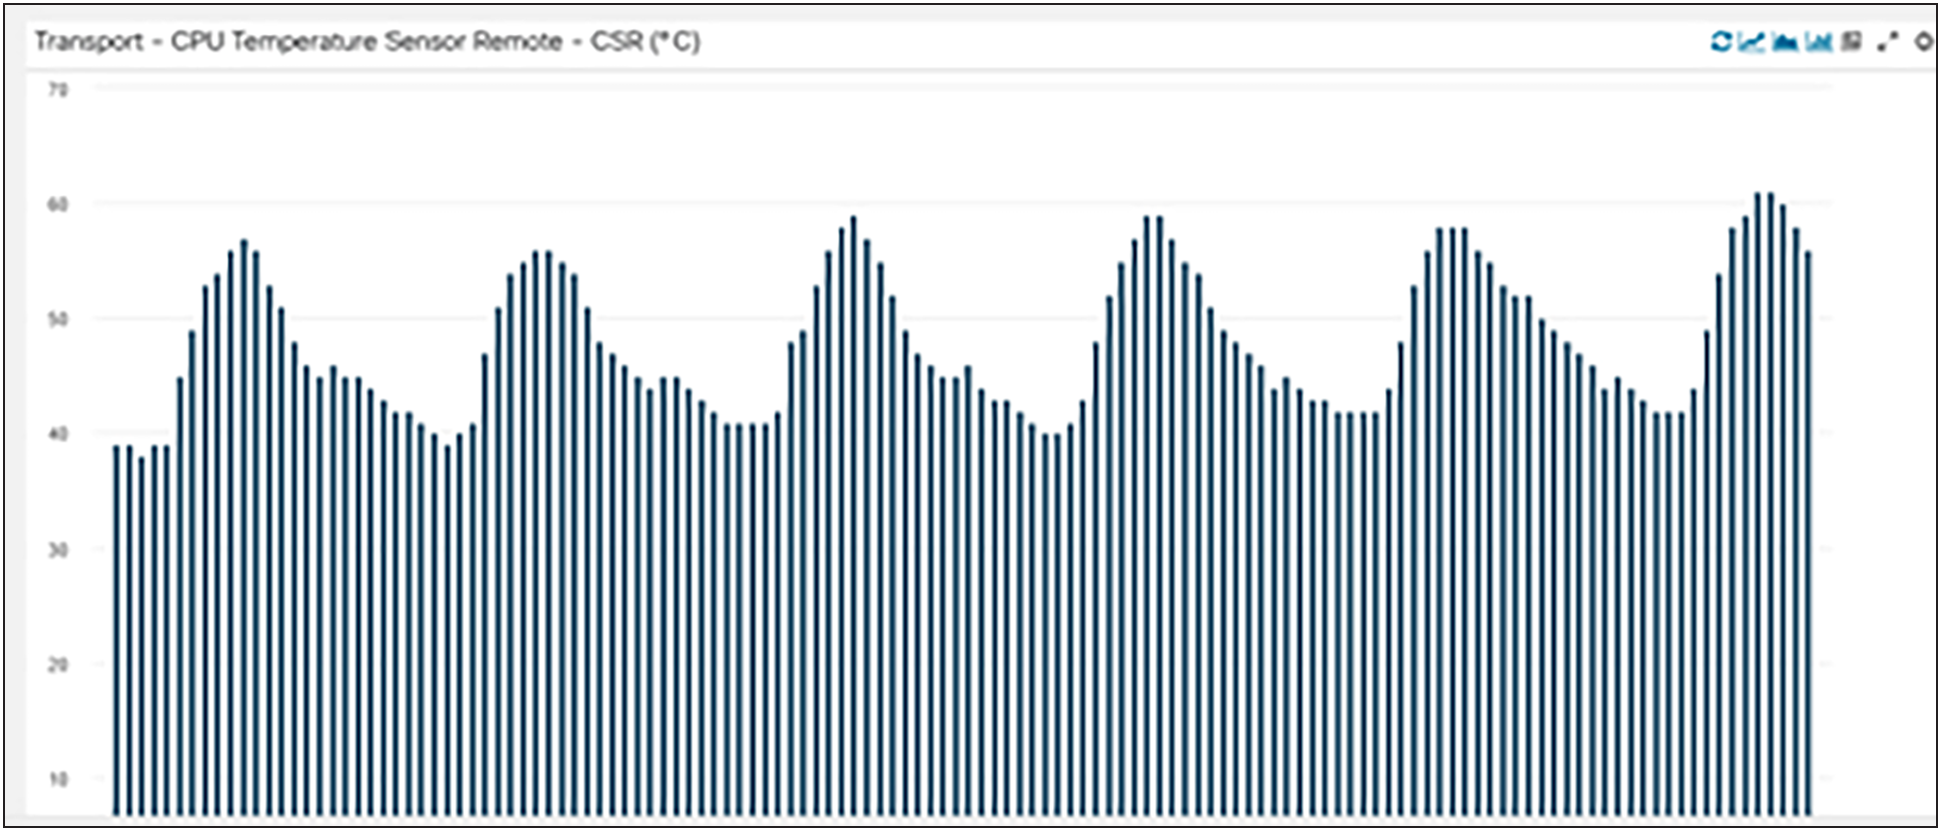
Univariate KPI profiling: Temperature
If we are collecting KPIs like CPU utilization and CSR environmental temperature, we should be able to classify the data using parameters like days of the week and time of day to analyze it better and predict future trends and anomalies.
Collecting data is not enough, however; we should be able to predict trends, make intelligent conclusions, and forecast anomalies.
6. Analysis of KPIs: Multivariate profiling
While Section 5 talks about univariate KPI profiling, it is also essential to be able to “profile” multiple KPIs. What is the correlation between interface throughput and CPU utilization? What is the correlation between CPU utilization and power consumed at a cell site router? The Observability platform should have the capability to analyze multiple KPIs on:
● A single cell site router
● Multiple cell site routers
● All cell site routers in a certain market
● All cell site routers in a service provider transport network
7. Conclusion: Future of KPI analysis
There are two schools of thought as far as KPI analysis is concerned.
● Build a lean cell site router. Build “intelligence” into the Observability platform/software-defined controller. The controller is the source of truth for the performance health of the network.
● Build the “intelligence” into the cell site router. The cell site router is the source of truth for the performance health of the network.
Regardless of the school of thought you fall within, you still need to understand and implement the KPIs (or a subset of them) defined in this white paper. If you want to automate this process through machine learning models, there should be a capability built through these models to be able to deploy relevant KPIs with either approach mentioned above.
KPI – Key Performance Indicator
RAN – Radio Access Network
CSR – Cell Site Router
CPU – Central Processing Unit
NPU – Network Processing Unit
MTU – Maximum Transmission Unit
BGP – Border Gateway Protocol
QoS – Quality of Service
IS-IS – Intermediate System-to-Intermediate System Protocol
OSPF – Open Shortest Path First Protocol
CEF – Cisco Express Forwarding
LEM – Large Exact Match
LPM – Longest Prefix Match
FEC – Forwarding Equivalence Class
ECMP – Equal Cost Multipath
VOQ – Virtual Output queuing
ARP – Address Resolution Protocol
NTP – Network Time Protocol
TCP – Transmission Control Protocol
EVPN – Ethernet Virtual Private Network
L2VPN – Layer 2 Virtual Private Network
L3VPN – Layer 3 Virtual Private Network
SR – Segment Routing
PM – Performance Measurement
IP SLA – Internet Protocol Service-l Level Agreement
RTT – Round Trip Time
SFP – Small Form-Factor Pluggable
● 5G Performance Monitoring of a Hybrid Cloud Network White Paper
● Vendor GitHub repository for YANG data models
● Cisco Feature Navigator – YANG Explorer
● gNMI specification on OpenConfig Forum
● Cisco NCS 540 medium-density router data sheet
Author
Sounak Mukherjee
Customer Delivery Architect
Cisco Systems (Customer Experience)