Service Provider Network Observability White Paper
Available Languages
Bias-Free Language
The documentation set for this product strives to use bias-free language. For the purposes of this documentation set, bias-free is defined as language that does not imply discrimination based on age, disability, gender, racial identity, ethnic identity, sexual orientation, socioeconomic status, and intersectionality. Exceptions may be present in the documentation due to language that is hardcoded in the user interfaces of the product software, language used based on RFP documentation, or language that is used by a referenced third-party product. Learn more about how Cisco is using Inclusive Language.
Network observability has become a cornerstone of modern network management, especially for service providers operating complex, distributed networks. These networks underpin the delivery of services to a diverse customer base, making their health, performance, and security paramount.
By leveraging network observability, service providers can gain comprehensive insights into their networks, enabling them to proactively identify and resolve issues, optimize resource allocation, and deliver consistently high-quality services. This capability not only enhances operational efficiency but also provides a competitive advantage by fostering exceptional service quality and strong customer relationships.
The rapid adoption of cloud-native architectures, 5G, and IoT has dramatically increased network complexity. Even minor disruptions can now escalate into major service issues, while customer demand for seamless, high-performance services continues to grow. In this challenging landscape, network observability is essential, empowering service providers to navigate complexity, minimize downtime, and uphold customer trust. Beyond simple monitoring, it enables a deeper understanding of network behavior—no longer a luxury but a necessity in today’s competitive market.
This white paper delves into three key areas of network observability:
● Common challenges: The primary obstacles service providers face in adopting and implementing network observability.
● FSO solution components: The critical elements of a robust Full-Stack Observability (FSO) framework designed to tackle these challenges effectively.
● Real-world benefits: The transformative impact of an FSO solution on network management and customer experience.
By the end of this white paper, you will:
● Understand the essential role of network observability in service delivery.
● Be aware of the challenges service providers face in achieving full observability.
● Be familiar with the key components of an effective FSO solution.
● Know how to align observability strategies with business goals for maximum impact.
Most service providers going through a digital transformation are looking at increasing their operational efficiency and improving service quality. To do so, they need to make an informed and data-driven decision. They can do this by embracing observability.
Service providers are focusing on enhancing observability as they transform toward service assurance, incorporating AIOps into their network transformation strategy.
Observability in a heterogeneous, multi-tech environment presents significant challenges due to the diverse nature of technologies and systems involved. The key challenges for these environments are:
● Data fragmentation and inconsistency
● Tool complexity and integration
● End-to-end visibility
● Data volume and velocity
● Service assurance and SLA management
● Lack of standardization
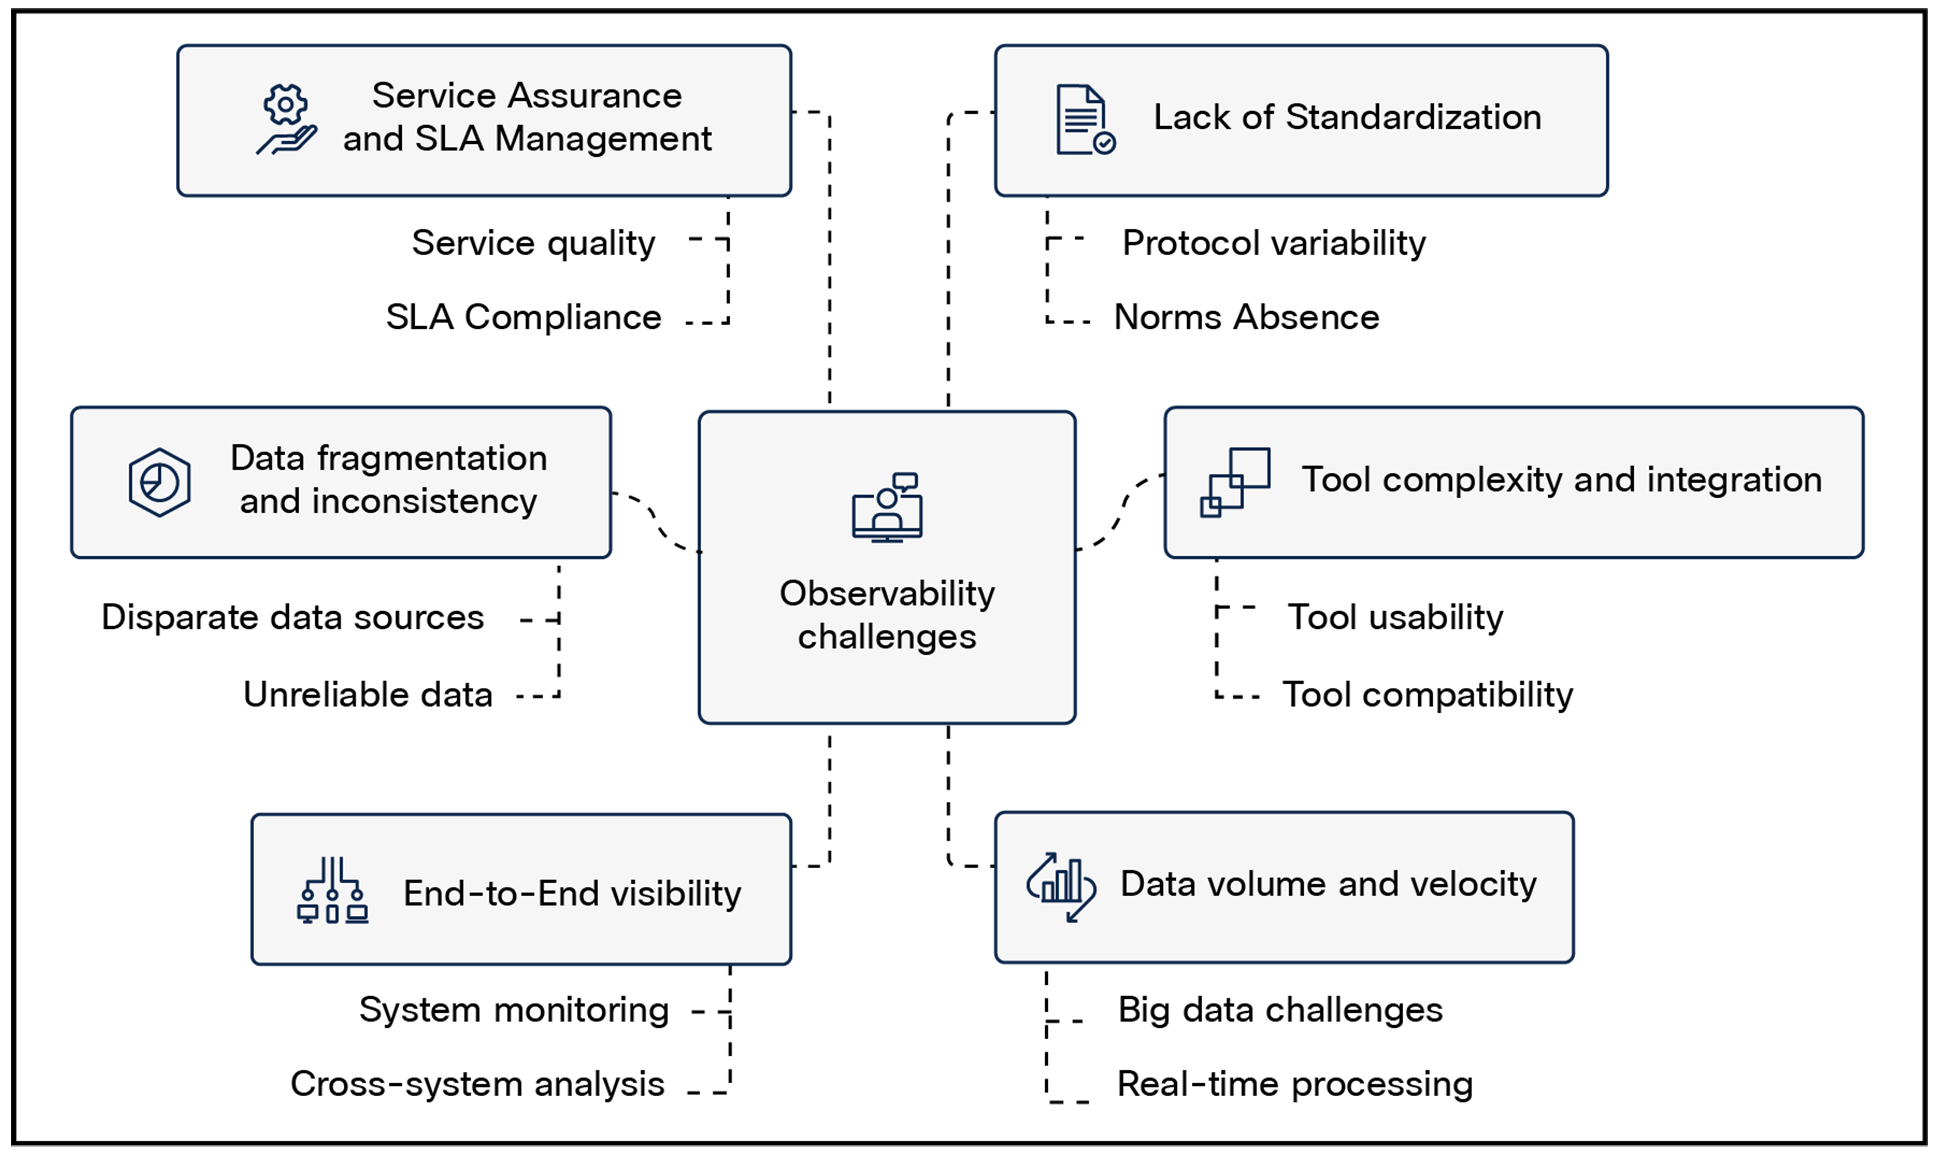
Network observability challenges
Data fragmentation and inconsistency
Data fragmentation and inconsistency pose significant challenges that can undermine the ability to effectively monitor and manage complex systems. As observability data is often collected from a multitude of disparate tools and sources, it tends to become siloed, with varied data formats that are difficult to combine or analyze.
Some of the key challenges of data fragmentation and inconsistency are:
● Multiple data sources: Data is spread across various tools producing their own unique data, often in different formats (e.g., syslog, SNMP, NetFlow).
● Data integration: Consolidating data from diverse formats is complex and can delay real-time monitoring.
● Complexity in troubleshooting: Fragmented data processing introduces delays, hindering timely route cause identification.
● Data accuracy and reliability: Inconsistencies can lead to unreliable insights, risking misinterpretations and impacting decision-making.
● Inefficient operations: Varied formats make data correlation and analysis challenging, time-consuming, and error prone, risking misinterpretations.
● Metric definitions: Different devices or software versions might define metrics differently, making comparisons difficult.
● Security risks: Inconsistent data can make it difficult to detect and respond to security threats.
Tool complexity and integration in heterogeneous environments
The complexity and integration of observability tools in heterogeneous environments present specific challenges due to the diverse and large-scale nature of telco networks. This complexity can hinder the ability to gain a unified view of the entire environment and can introduce challenges related to data integration, automation, and maintenance.
Some of the key challenges when it comes to tools and integration are:
● Diverse technologies: Telcos manage a wide range of technologies, making tool integration complex and requiring custom solutions.
● Multiple vendors: Equipment from various vendors leads to fragmented observability tools and difficulty in achieving a unified network view.
● Data silos: Observability data is often isolated, complicating comprehensive network analysis and troubleshooting.
● Integration complexity: Significant effort is needed to integrate tools (different data formats, API compatibility, data pipelines), resulting in high costs and operational inefficiencies.
● Scalability issues: As networks grow, maintaining scalable observability solutions becomes challenging, risking performance bottlenecks.
End-to-end visibility in telco networks is crucial for ensuring seamless service delivery and optimal network performance. However, achieving comprehensive visibility presents several challenges:
● Underlay and overlay: Achieving end-to-end visibility in telco networks involves tackling challenges in both underlay and overlay observability.
◦ Diverse technologies: Integrating visibility across varied technologies such as 4G/5G, IP, optics, fixed broadband, cloud/Software-Defined Networks (SDN)/Network Functions Virtualization (NFV), and legacy systems can create gaps.
◦ Complex network architecture: Telco networks consist of diverse components including Radio Access Networks (RANs), core networks, and backhaul systems. The complexity makes it difficult to achieve comprehensive visibility and to pinpoint issues quickly.
◦ Vendor fragmentation: Different vendor tools and formats hinder data unification and cohesive network views.
◦ Dynamic topologies: Rapid changes in networks require adaptive monitoring solutions.
◦ Overlay integration with underlay: Aligning monitoring across both layers is essential for full visibility.
◦ Data correlation: Effective correlation between overlay and underlay data is needed for root cause analysis.
● Isolated data: Siloed data storage prevents effective analysis and comprehensive network insights.
● Scalability needs: Expanding networks require scalable monitoring to avoid performance and visibility issues.
● Security constraints: Ensuring security while maintaining visibility complicates data integration and sharing.
Data explosion
Modern networks generate vast amounts of data, including network traffic data, device logs, performance metrics, and more. This explosion in the amount of data can overwhelm traditional monitoring systems, making it difficult to store, process, and analyze data efficiently.
Key challenges in this area are:
● Data overwhelm: The sheer volume of data generated by large-scale networks can overwhelm traditional monitoring tools. This includes network traffic data, device logs, performance metrics, and more. The vast amount of data can make it difficult to store, process, and analyze effectively.
● Performance impact: The volume of data can also impact network performance itself. Excessive data collection and analysis can consume valuable network resources, potentially affecting the overall performance of the network.
● Analysis difficulty: Analyzing large datasets can be computationally intensive and time-consuming. Traditional analysis techniques may not be sufficient to identify anomalies or trends in such large volumes of data.
● Storage challenges: Storing large amounts of data requires significant storage capacity. This can be expensive and can present challenges for data retention and retrieval.
● Visualization difficulties: Visualizing large datasets can be challenging, as traditional visualization techniques may not be able to effectively represent the complexity of the data.
Service assurance and SLA management
In telco networks, ensuring service assurance and managing Service-Level Agreements (SLAs) present several observability challenges:
● Complex service delivery: Monitoring interconnected components is difficult, impacting SLA compliance.
● Real-time data processing: The need for real-time data analysis to ensure SLA compliance is heightened, requiring sophisticated tools to detect and address issues promptly.
● Integration across platforms: Modern networks often integrate cloud services and edge computing, necessitating seamless data integration for comprehensive visibility.
● Dynamic network conditions: Rapid changes make maintaining consistent service quality challenging.
● Automated root cause analysis: With increased automation in modern networks, quickly pinpointing issues across automated and dynamic environments is crucial to prevent SLA breaches.
● Proactive and predictive insights: Leveraging AI and machine learning for predictive analytics is essential to preemptively address potential SLA breaches.
● Enhanced security measures: Modern networks must balance robust security with the visibility needed for effective SLA management, especially in virtualized and distributed environments.
The lack of standardization in network technologies and protocols can pose significant challenges for developing consistent observability solutions. This is particularly true in heterogeneous networks using multiple vendors and technologies.
Specific challenges in this area are:
● Proprietary protocols: Different vendors may use proprietary protocols for communication between their devices, making it difficult to integrate them into a unified monitoring system.
◦ Vendor-specific management protocols: Some vendors use proprietary management protocols for configuring and monitoring their devices.
◦ Proprietary data formats: Vendors may use proprietary data formats for storing and transmitting network data, such as Simple Network Management Network Protocol (SNMP) MIBs or proprietary log formats.
◦ Proprietary APIs: Some vendors provide proprietary APIs for accessing data from their devices, which can limit interoperability.
● Data format differences: Vendors may use different data formats for storing and transmitting network data, hindering data integration and analysis.
● Vendor lock-in: Reliance on proprietary technologies can lead to vendor lock-in, limiting flexibility and increasing costs.
● Compatibility issues: Different technologies and protocols may have compatibility issues, making it challenging to ensure smooth interoperability.
● Complexity: The lack of standardization can increase the complexity of network management and troubleshooting.
A Tier 1 service provider in the APJC region is enhancing observability by consolidating existing network operations centers into a single automated operations center with integrated security capabilities. This transformation focuses on using observability tools to ensure rapid detection and recovery from incidents or service outages. Enhanced observability provides comprehensive end-to-end visibility across the network, ensuring seamless monitoring and management of all components. Additionally, full traceability across both fixed and mobile networks is achieved, leveraging observability to efficiently track performance and resolve issues.
A Tier 1 service provider in Australia faces the challenge of automating a significant portion of their operations functions—from prediction and detection to restoration and validation—to minimize human error and enhance operational efficiency. This is crucial for consistently delivering innovative, uninterrupted, high-quality services to customers. The operator seeks a solution that can leverage their existing investments in monitoring and observability across both network and IT domains, including applications and servers. Priority areas for enhanced observability and integration include transport, IP, mobile RAN, mobile core and edge, managed network services, and cloud environments, alongside IT observability solutions.
An operator in Japan is grappling with several challenges, including the need to accelerate automation and implement end-to-end observability and AIOps. A recent significant outage highlighted the lack of end-to-end visibility across their operations. To address these issues, the operator is seeking a solution that provides comprehensive end-to-end observability and service assurance, enabling them to enhance visibility, improve reliability, and ensure seamless service delivery.
A Tier 1 operator in Indonesia is facing critical challenges in growing its B2B business due to insufficient observability. Although performance metrics are collected, the lack of service awareness results in inadequate visibility into service-specific performance. This gap in observability also leads to a deficiency in service-level event correlation and an absence of service-aware correlation between fault and performance KPIs. These observability challenges impede the operator's ability to effectively monitor, manage, and enhance service performance, thus affecting their B2B growth aspirations.
The building blocks of service provider observability
An end-to-end Full-Stack Observability (FSO) solution for a service provider should ensure comprehensive visibility, optimization, and actionable insights across the entire IT landscape. Key components include:
● Cross-platform visibility
◦ End-to-end visibility: Gain deep insights across systems, technologies, platforms, applications, and environments.
◦ Streamlined, single view: Use a holistic, shared context for IT teams to align on business applications with clear insights and management.
● Performance monitoring
◦ Hybrid application monitoring: Track traditional and hybrid applications, correlate performance with business results, and proactively address issues.
◦ Cloud-native application monitoring: Monitor cloud-native applications in multicloud and hybrid environments, prioritizing issues based on business impact.
● Application security
◦ Proactive detection: Identify vulnerabilities and block threats in application runtimes during production.
◦ Risk assessment: Integrate security findings with business context to prioritize actions based on potential impact.
● Customer digital experience monitoring
◦ Actionable insights: Obtain end-to-end insights into application experience, dependencies, and business impacts.
◦ User experience correlation: Link network metrics with application performance data to quickly identify user experience issues.
● Application dependency monitoring
◦ Peak performance: Ensure optimal performance of application services and APIs, including internet and cloud network performance.
◦ Real-time mapping: Use real-time application dependency mapping with network data to resolve issues based on business impact.
● Optimization
◦ Hybrid cost optimization: Reduce costs by optimizing cloud usage and increasing on-premises asset utilization.
◦ Application resource optimization: Improve application performance by efficiently allocating resources for workloads on-premises and in the cloud.

Ideal FSO solution considerations
This comprehensive approach requires a combination of the following key strategies:
Network Performance Monitoring (NPM)
NPM tracks critical network metrics like latency, jitter, packet loss, and bandwidth utilization to identify and resolve performance bottlenecks.
Some of the protocols and standards that are involved within the scope for NPM consideration are SNMP, NetFlow, IP Flow Information Export (IPFIX), Two-Way Active Measurement Protocol (TWAMP) sessions, open telemetry, and others.
Key components of NPM are:
● Metric collection
◦ Traffic monitoring: Measuring the volume, rate, and distribution of network traffic.
◦ Latency measurement: Assessing the time it takes for data to travel between network nodes.
◦ Packet loss: Determining the percentage of data packets that are lost during transmission.
◦ Jitter: Measuring the variation in packet arrival times.
◦ Bandwidth utilization: Tracking the amount of bandwidth being consumed by different applications or devices.
● Data analysis
◦ Baseline comparison: Comparing current performance metrics to historical baselines to identify anomalies.
◦ Trend analysis: Identifying trends in network performance over time to predict potential issues.
◦ Root cause analysis: Investigating the underlying causes of performance problems.
◦ Correlation analysis: Identifying relationships between different network metrics to understand the impact of changes or events.
● Visualization and reporting
◦ Dashboards: Providing real-time visualizations of network performance metrics.
◦ Reports: Generating detailed reports on network performance, including trends, anomalies, and root causes.
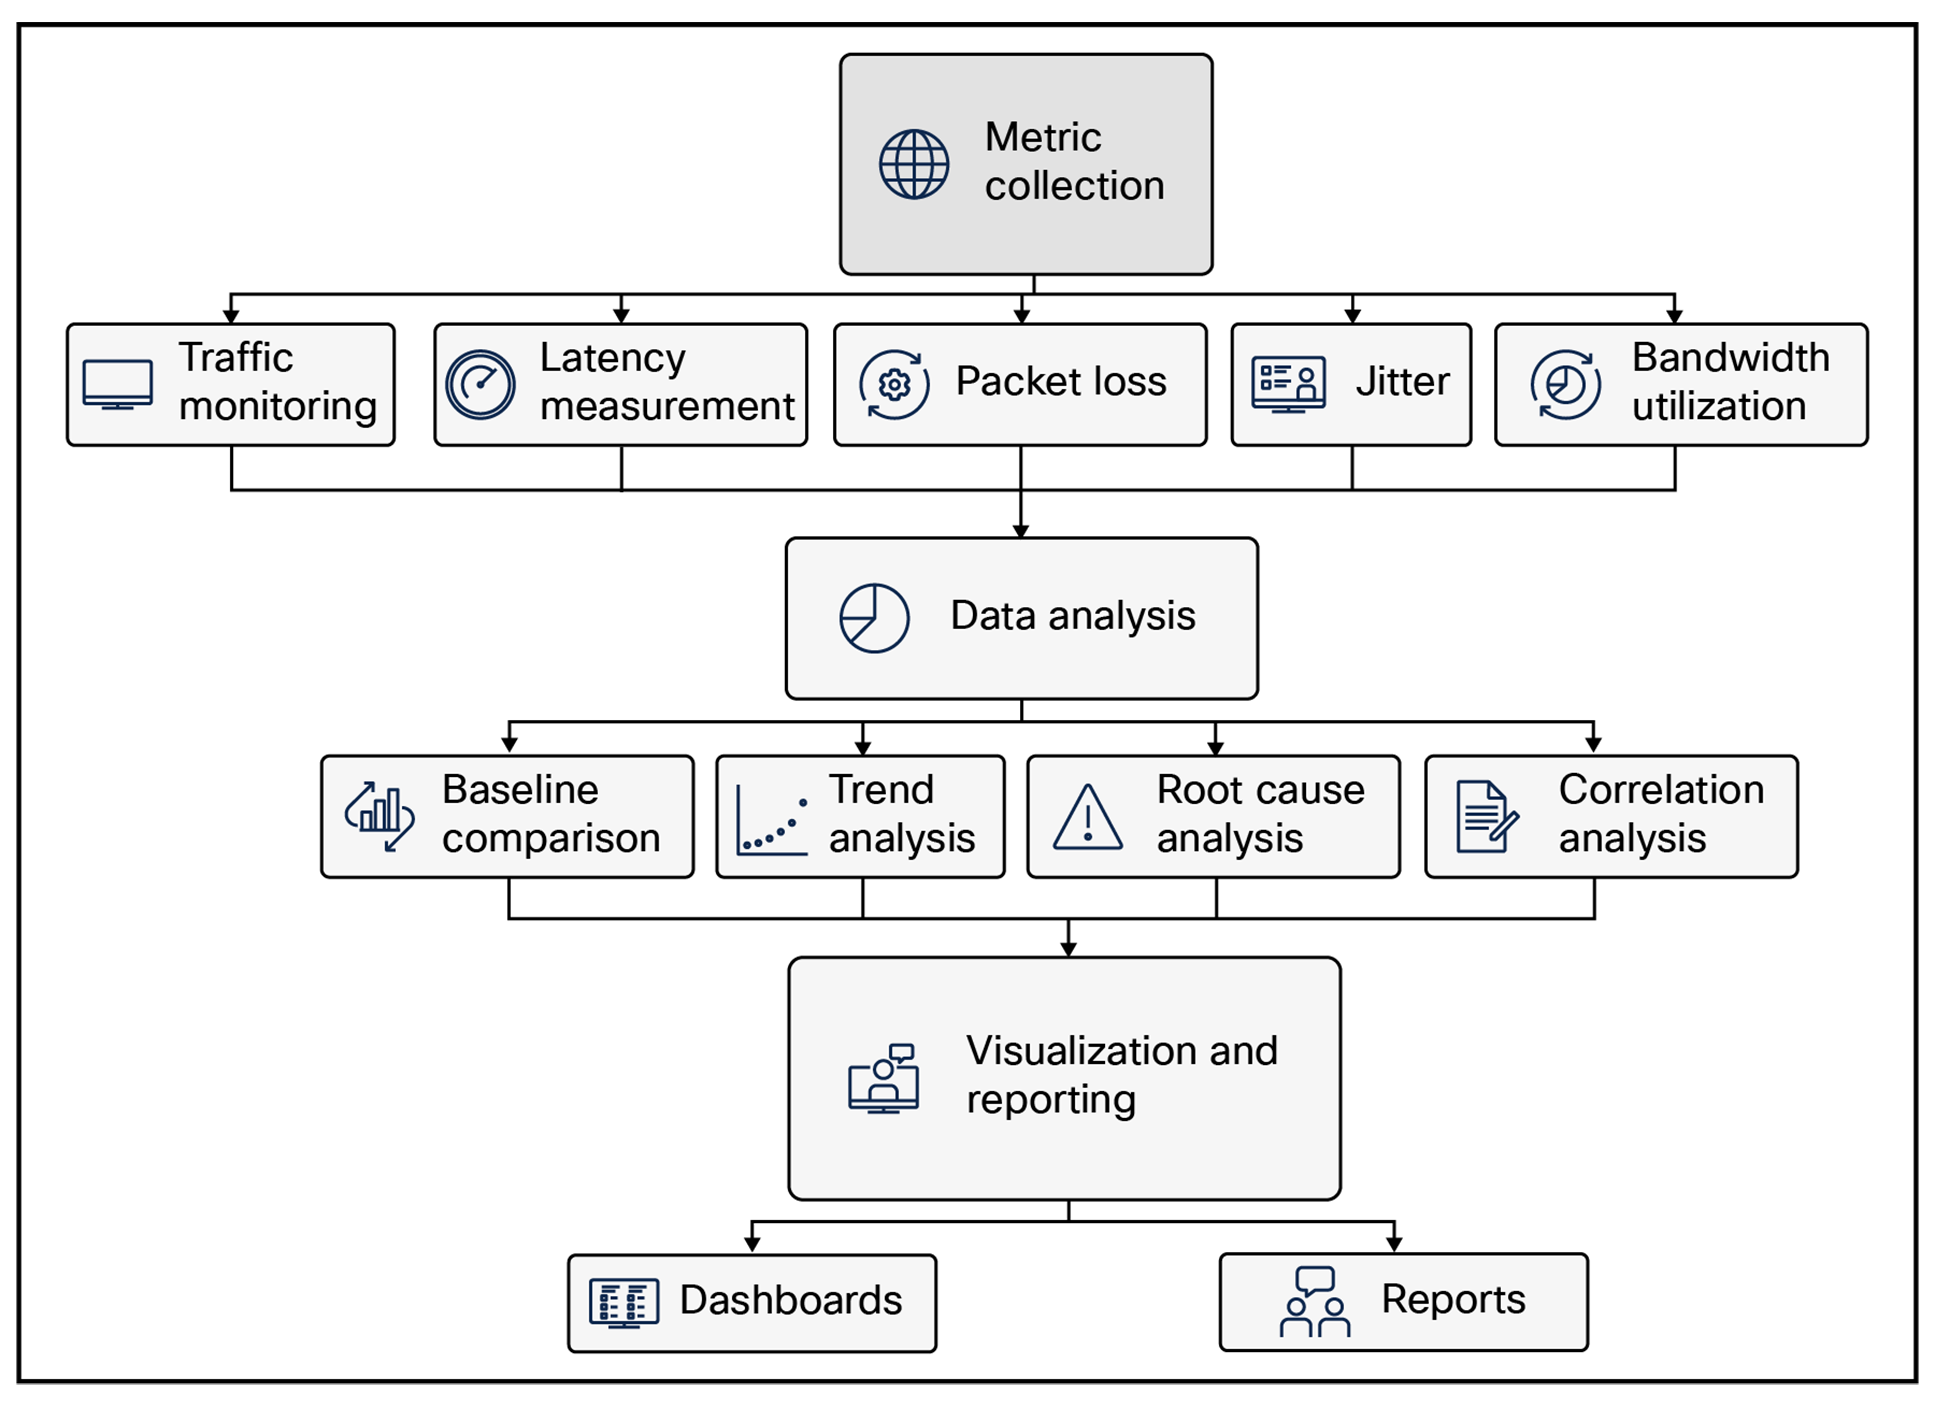
Key components of NPM
Many service providers, at various stages of modernization, possess network segments capable of TWAMP monitoring and other methods. Some of the real-world benefits and example use cases that can be realized with a well-designed NPM are:
● Precise problem identification: Leverage existing TWAMP sessions to pinpoint performance issues in Multiprotocol Label Switching (MPLS) networks using common observability tools like Splunk® or Cisco® Provider Connectivity Assurance (formerly Accedian Skylight).
● Comprehensive network visibility: Integrate TWAMP data from diverse vendors and domains into a unified platform. Create flexible dashboards for a holistic view of network performance.
● Proactive alerts: Set up automated alerts triggered by predefined performance thresholds.
● Granular link monitoring: Monitor the performance of individual links within link aggregation groups.
● Traffic priority verification: Ensure that traffic flows are prioritized correctly.
Application Performance Monitoring (APM)
APM focuses on monitoring the performance of applications running on the network, including response times, error rates, and resource consumption. It is a critical aspect of service provider observability, focusing on understanding the performance and behavior of applications running on a network. By monitoring various metrics and analyzing application behavior, APM helps identify and address issues that can impact user experience and business operations.
Key components of APM are:
● Metric collection
◦ Response time: Measuring the time it takes for an application to respond to a request.
◦ Error rates: Tracking the frequency of application errors.
◦ Resource utilization: Monitoring the consumption of CPU, memory, disk, and network resources.
◦ Transaction tracing: Tracking the flow of requests through an application to identify bottlenecks.
◦ Custom metrics: Defining and collecting application-specific metrics to address unique requirements.
● Data analysis
◦ Baseline comparison: Comparing current performance metrics to historical baselines to identify anomalies.
◦ Trend analysis: Identifying trends in application performance over time to predict potential issues.
◦ Root cause analysis: Investigating the underlying causes of performance problems.
◦ Correlation analysis: Identifying relationships between application metrics and network or infrastructure metrics to understand the impact of external factors.
● Visualization and reporting
◦ Dashboards: Providing real-time visualizations of application performance metrics.
◦ Reports: Generating detailed reports on application performance, including trends, anomalies, and root causes.
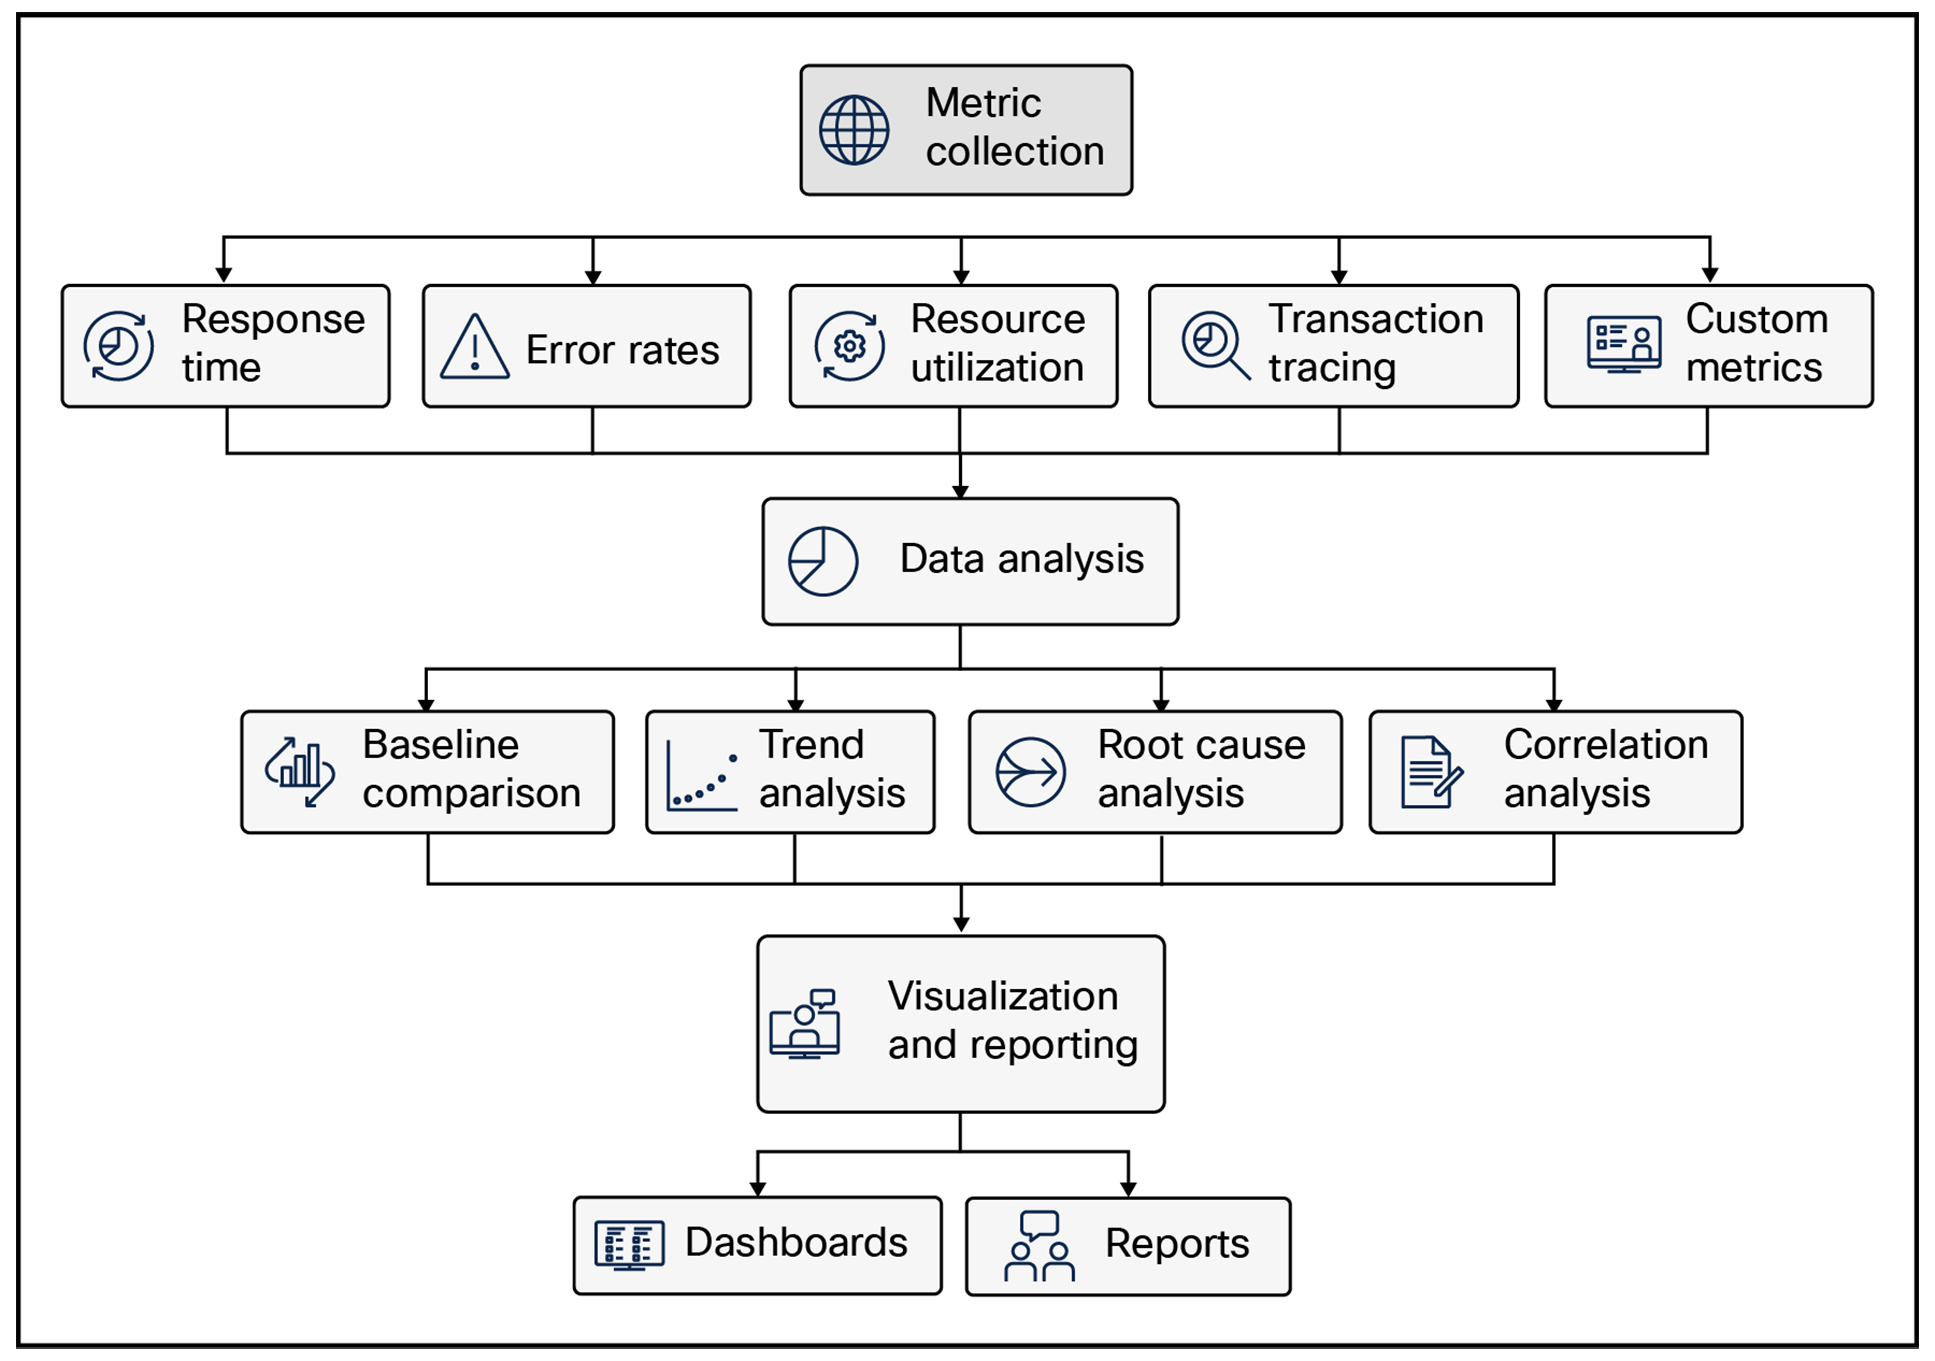
Key components of APM
Some real-world benefits and example use cases of APM are:
● Internet insights: Identifying real-time internet health across all major networks globally as well as Identifying the impact of global outages on the service provider network hosted agents.
● Peer performance visibility: Providing insight into peer service provider performance as well as detailed hop-by-hop network statistics for enhanced visibility, along with providing the service provider the opportunity and visibility to gain insights into areas of continuous improvement.
● Service dependency monitoring: Monitoring of Border Gateway Protocol (BGP) advertisements and showcasing Autonomous System (AS) information, as well as monitoring of Content Delivery Network (CDN) edge-node performance and availability.
Infrastructure monitoring tracks the health and performance of underlying infrastructure components, including servers, databases, and storage systems.
By monitoring various metrics and analyzing infrastructure behavior, infrastructure monitoring helps identify and address issues before they impact network performance and customer experience.
By effectively implementing infrastructure monitoring, service providers can gain valuable insights into the health and performance of their underlying infrastructure, identify and address issues proactively, and ensure a reliable and efficient network.
Key components of infrastructure monitoring are:
● Server monitoring
◦ CPU utilization: Tracking the percentage of CPU capacity being used.
◦ Memory usage: Monitoring the amount of memory being consumed.
◦ Disk I/O: Measuring disk input/output operations.
◦ Network interface utilization: Tracking network traffic on server interfaces.
● Storage monitoring
◦ Storage capacity: Tracking the amount of storage space available.
◦ I/O performance: Measuring the speed and efficiency of storage operations.
◦ Error rates: Monitoring the frequency of storage errors.
● Network device monitoring
◦ Interface utilization: Tracking network traffic on device interfaces.
◦ Power consumption: Monitoring power usage.
◦ Temperature: Monitoring device temperature.
◦ Fan speed: Monitoring fan performance.
● Environmental monitoring
◦ Temperature: Monitoring ambient temperature.
◦ Humidity: Monitoring humidity levels.
◦ Power supply: Monitoring power supply stability.
Some of the real-world benefits and example use cases for infrastructure monitoring are:
● Proactive network health monitoring: Proactive health monitoring requires deeper insights into the infrastructure metrics and logs, managing these effectively and providing a framework for use cases like fault detection and isolation, anomaly detection, capacity planning in terms of hardware, etc., and real-time performance tracking.
● SLA assurance: This is a very important use case for any service provider and can include sub-use cases like SLA compliance monitoring, historic SLA performance analysis, and real-time SLA violation alerts.
● Customer experience monitoring: This includes end-user experience monitoring wherein user experience metrics like page load times and application response times are monitored and correlated with network performance metrics to enable the service provider to pinpoint the root causes of performance issues.
Log management involves collecting, storing, and analyzing system and application logs to identify the root causes of issues and gain valuable insights into network behavior.
Logs provide valuable insights into network behavior, application performance, and security events, enabling service providers to identify and troubleshoot issues, detect anomalies, and ensure compliance.
By effectively implementing log management, service providers can gain valuable insights into their network operations, identify and troubleshoot issues, detect security threats, and ensure compliance with regulatory requirements.
Key components of log management are:
● Log collection
◦ Data sources: Identifying and collecting logs from various sources, including servers, network devices, applications, and operating systems.
◦ Agents: Deploying agents on devices to collect logs in real time.
◦ Syslog: Using syslog to centralize log collection from different devices.
◦ File system monitoring: Monitoring file systems for new log files.
● Log storage
◦ Centralized repository: Storing logs in a central repository for easy access and analysis.
◦ Data retention policies: Implementing policies to determine how long logs should be retained based on regulatory requirements and business needs.
◦ Compression: Compressing logs to reduce storage requirements.
● Log analysis
◦ Search and filtering: Enabling users to search for specific terms or patterns within logs.
◦ Correlation: Identifying relationships between different logs to understand the root causes of issues.
◦ Anomaly detection: Using machine learning algorithms to detect unusual patterns or behaviors.
◦ Security analysis: Analyzing logs for security threats, such as unauthorized access or malicious activity.
● Alerting and notification
◦ Thresholds: Defining thresholds for critical events and triggering alerts when these thresholds are exceeded.
◦ Notifications: Sending notifications to relevant teams or individuals when alerts are triggered.
Some best practices for log management are:
● Centralize log collection: Collect logs from all sources in a centralized repository.
● Implement data retention policies: Define clear policies for log retention based on regulatory requirements and business needs.
● Use structured logging: Implement structured logging formats to facilitate analysis and correlation.
● Leverage analytics: Use advanced analytics techniques to extract insights from log data.
● Automate alerts: Set up alerts for critical events to enable timely response.
Alerting and notification capabilities proactively alert service providers to potential and actual problems, enabling timely response and resolution.
Alerting and notification is a critical component of service provider observability, enabling teams to be promptly notified of critical events and issues. By providing timely information, alerts and notifications help ensure rapid response and minimize service disruptions.
By effectively implementing alerting and notification, service providers can ensure that critical issues are addressed promptly, minimizing service disruptions and improving customer satisfaction.
Key components of alerting and notification are:
● Thresholds and triggers
◦ Defining thresholds: Setting thresholds for key metrics to identify when conditions become critical.
◦ Trigger conditions: Specifying the conditions under which alerts should be triggered, such as exceeding thresholds, detecting anomalies, or experiencing errors.
● Alert routing
◦ Recipient lists: Defining recipient lists for different types of alerts, including individuals, teams, and on-call schedules.
◦ Escalation policies: Implementing escalation policies to notify additional recipients if initial alerts are not addressed promptly.
● Notification methods
◦ Email: Sending email notifications with detailed information about the alert.
◦ SMS: Sending SMS messages for urgent alerts.
◦ Push notifications: Sending notifications to mobile devices.
◦ Voice calls: Making phone calls to on-call personnel.
◦ Integration with collaboration tools: Integrating with tools like Slack or Teams for real-time communication.
● Alert suppression
◦ Noise reduction: Implementing mechanisms to suppress redundant or low-priority alerts to avoid overwhelming teams.
◦ Alert groups: Grouping related alerts to provide a consolidated view.
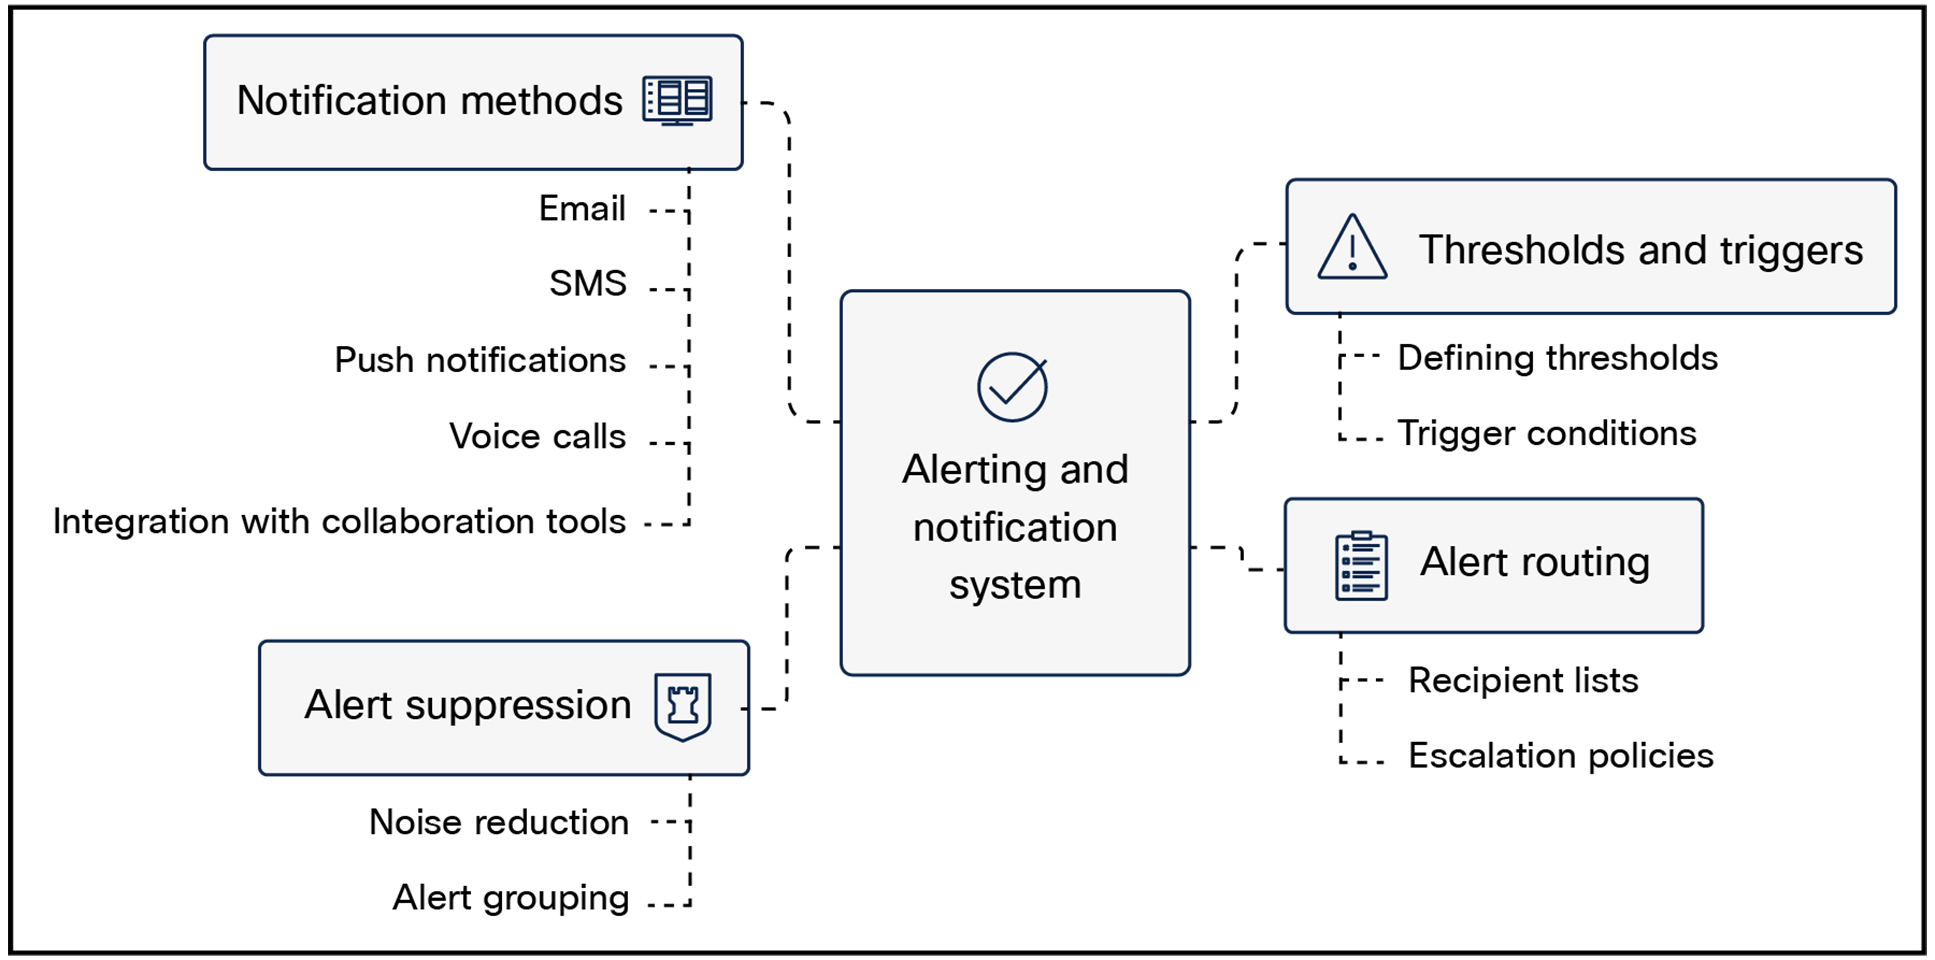
High-level view of alerting and notification
Some best practices for alerting and notification are:
● Define clear thresholds: Establish clear thresholds for key metrics based on historical data and business requirements.
● Prioritize alerts: Categorize alerts based on severity and urgency to ensure that critical issues are addressed promptly.
● Test alerts: Regularly test alert configurations to ensure that they are functioning as expected.
● Automate alert suppression: Implement rules to suppress redundant or low-priority alerts.
● Provide contextual information: Include relevant details in alerts, such as affected components, timestamps, and error messages.
● Integrate with collaboration tools: Use collaboration tools to facilitate real-time communication and coordination.
● Review and refine: Regularly review and refine alert configurations based on feedback and changing requirements.
Analytics and reporting is a critical component of service provider observability, providing valuable insights into network performance, application behavior, and infrastructure health. By analyzing data collected from monitoring tools, service providers can identify trends, anomalies, and areas for improvement.
By effectively leveraging analytics and reporting, service providers can gain valuable insights into their network operations, identify areas for improvement, and optimize resource utilization.
Key components of analytics and reporting are:
● Data visualization
◦ Dashboards: Creating custom dashboards to visualize key metrics and trends.
◦ Charts and graphs: Using various chart types to represent data effectively.
◦ Maps: Visualizing geographic distributions of data.
◦ Time series analysis: Analyzing data over time to identify trends and patterns.
● Reporting
◦ Custom reports: Generating custom reports based on specific requirements.
◦ Scheduled reports: Automatically generating reports on a regular schedule.
◦ Ad hoc reports: Creating reports on demand to address specific questions or investigate issues.
● Advanced analytics
◦ Machine learning: Applying machine learning algorithms to identify anomalies, predict future trends, and optimize resource allocation.
◦ Statistical analysis: Using statistical methods to analyze data and draw conclusions.
◦ Data mining: Discovering patterns and relationships within large datasets.
Some best practices for analytics and reporting are:
● Define Key Performance Indicators (KPIs): Identify the metrics that are most important to your organization and track them regularly.
● Use clear and concise visualizations: Create visualizations that are easy to understand and interpret.
● Provide context: Include relevant context and explanations with reports to ensure that they are meaningful.
● Automate reporting: Schedule regular reports to save time and ensure consistency.
● Leverage advanced analytics: Explore advanced analytics techniques to gain deeper insights from your data.
● Share insights: Share insights with relevant teams to inform decision-making and improve operations.