Closed Loop Monitoring Framework for Service Assurance
Available Languages
Bias-Free Language
The documentation set for this product strives to use bias-free language. For the purposes of this documentation set, bias-free is defined as language that does not imply discrimination based on age, disability, gender, racial identity, ethnic identity, sexual orientation, socioeconomic status, and intersectionality. Exceptions may be present in the documentation due to language that is hardcoded in the user interfaces of the product software, language used based on RFP documentation, or language that is used by a referenced third-party product. Learn more about how Cisco is using Inclusive Language.
In this digital era, we are witnessing firsthand the introduction of various emerging technologies such as Software Defined Networking (SDN), Programming and Automation capabilities that rapidly shifts the network infrastructure from being a mere rack of hardware to a state-of-the-art next generation application-centric infrastructure that is instantiated and managed to address the proliferating business demands and intents.
While the advent of above mentioned and other such technologies, enables the customers to introduce multifarious services with rich set of capabilities by leveraging the underlying network infrastructure to accelerate the business, the IT Operations teams are equally challenged to prepare for this journey. In order to address such new demands, IT Operational strategy is transforming from being reactive to proactive, predictive and autonomous by leveraging AIOps.
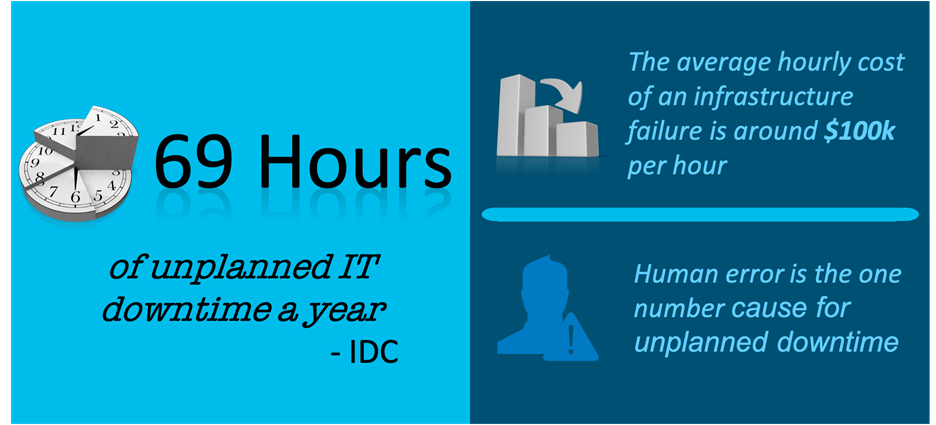
According to IDC reports, Enterprises are facing around 69 hours of unplanned IT downtime causing financial penalties and sometimes damaging the brand reputation. There is a rising demand to proactively measure the health, performance, and availability of the infrastructure, and to automate the remediation with the purpose of improving the overall end user and application experience.
As the industry is undergoing a radical shift as part of the “Digital Transformation”, more organizations are committed to adopt the hybrid cloud strategy to realize the maximum benefits offered by the cloud in terms of scale and resiliency. In such cloud-based distributed and complex application environment, the end-user application experience is directly impacted by the end-to-end performance of the business application transactions between the user and the decoupled microservices hosted on and connected through a fleet of dynamic infrastructure as shown in the below figure.
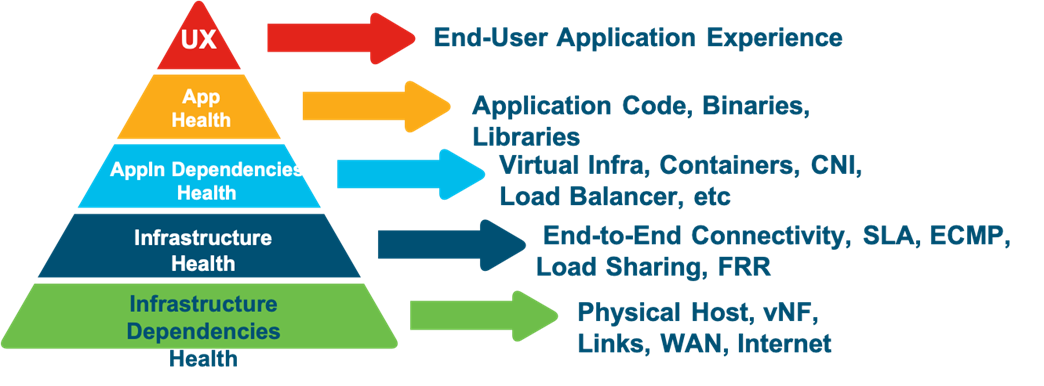
As the end-user application experience is a result of the end-to-end health and performance of assortment of involved components, measuring the aggregated performance metric for holistic view is more appropriate than measuring each layer in silos.
In this white paper, we emphasize the current operational model and the associated challenges. We further introduce a closed loop monitoring framework for service assurance in new paradigm of multi-cloud by proactively monitoring the health and performance of the end-to-end network devices, services and the paths to improve and assure the overall reliability of the network infrastructure and the offered end-user application experience.
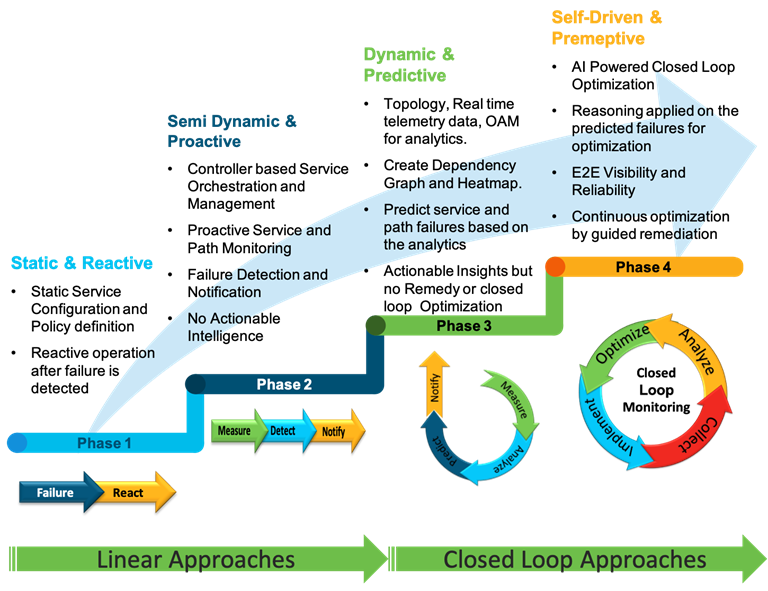
While the IT Operations teams are empowered with new capabilities such as end-to-end network visibility and the ability to collect digital dust of network operational data for network insights and event predictions, most of the organizations are still stuck with the linear operational approach highlighted above that lacks any actionable insights or guided remedy application.
Few of the key challenges faced by the IT Operations team are:
● How to dynamically identify the underlying resources across layers that impact the business transactions to collectively monitor.
● What is the baseline KPI metric against which each such monitored resources should be measured to detect any deviation?
● How to measure the user application experience by cross-pollinating the siloed performance measurement across layers.
● What remedy action should be executed when a deviation is detected to optimize and assure the service.
There are practical scalability challenges associated with blindly collecting all the operational data from all the involved entities across different layers. For example, the liveliness check or performance measurement to an application instance running On-prem should be performed at a higher rate while comparing to the backup counterpart instance running on the public cloud. Any error counter increasing at a lower phase on a primary path must require meticulous attention while comparing to a counter increasing at a medium phase on a sporadically used backup path or node.
We need a more comprehensive and sophisticated method to identify the below:
● What to monitor – What data should be collected that can be used collectively to assure the offered services.
● Where to monitor – The above data should be collected from which part (or set of devices) of the network.
● When to monitor – What is the optimal cadence at which the data should be collected for analytics.
Closed Loop Monitoring Framework for Service Assurance
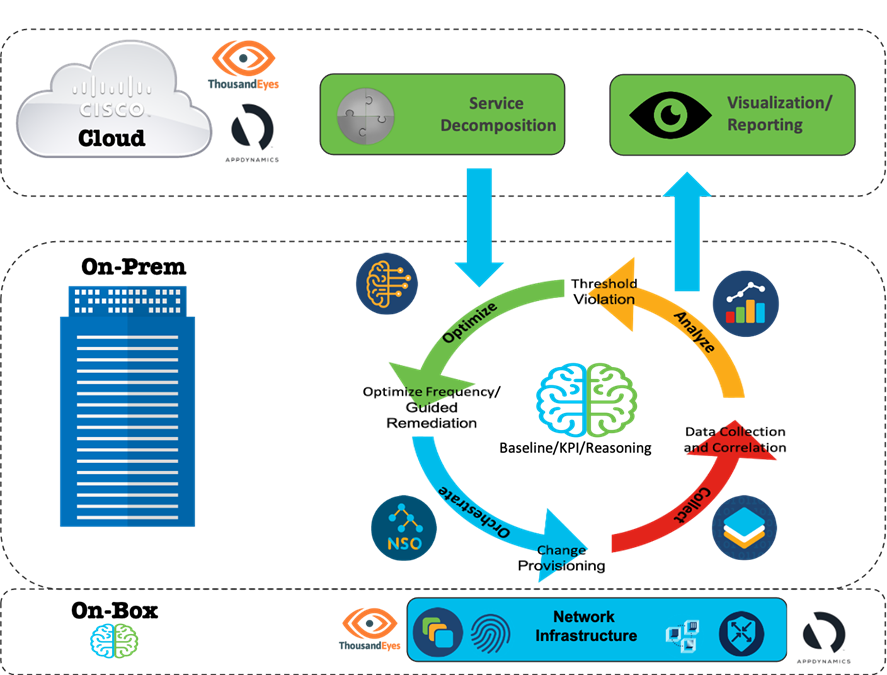 |
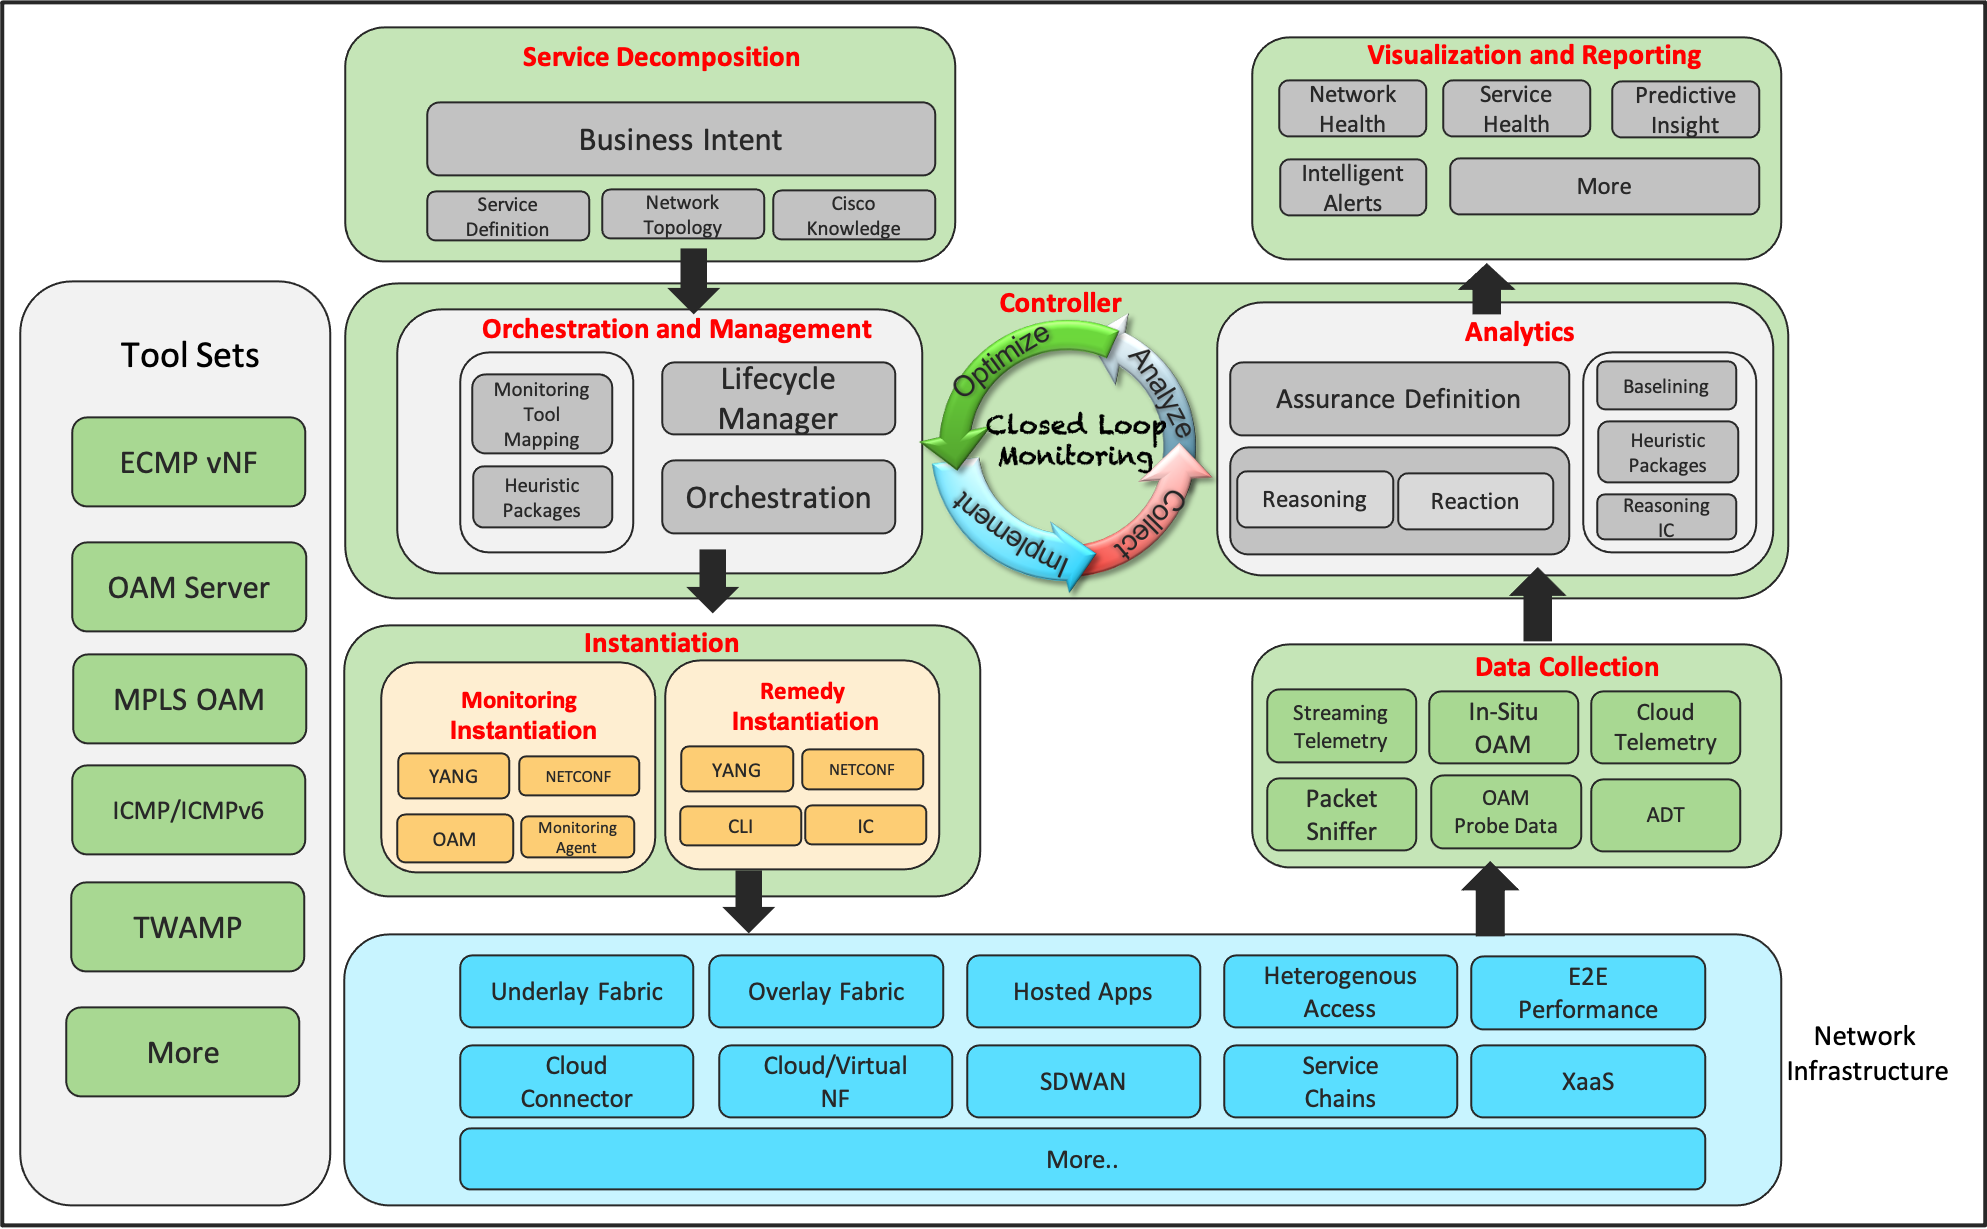
In this section, we explore a generalized Closed Loop Monitoring framework that takes the business intent, decompose the same into specific resources to be monitored, orchestrate the monitoring instances on the relevant part of the infrastructure, collect the data and apply the analytics to drive continuous key points. The loop is finally closed by either optimizing the monitoring instances or remediate any detected or predicted deviations for reliable service assurance.
At a very high-level, the centralized intelligence residing within the Cloud along with the holistic infrastructure visibility and the automation capabilities can decompose the business intent into sub-services to map and identify the fleet of infrastructure resources to be monitored for end-to-end assurance. To be more specific, this functionality can dynamically identify the edge/transit devices, resources within each device, transit links, Multi-hop ECMP paths, KPI metrics to assure the end user business application experience.
The On-prem intelligence consumes the decomposed resource mapping, the associated KPI metrics and Cisco knowledge base comprising the guided remedy action. The closed loop framework is used to:
● Orchestrate the monitoring instances or agents on the relevant part of the infrastructure for health and performance measurement.
● Measure/Collect the operational telemetry data from the designated collection points.
● Analyze the measurements against the KPI metrics associated with the resources along with the reasoning logics to detect or predict any potential deviation.
● Optimize the monitoring and/or the infrastructure by applying the guided remediation for service assurance.
The On-box intelligence such as executing the reasoning logic or 3rd party App hosting capabilities can be leveraged to offload some of the functionalities. The hosting capabilities can be used to provision the monitoring agent such as thousand eyes agent and use a device-centric reasoning logic for data analytics.
Closed Loop Assurance Framework - Execution Phases
The framework explored in this paper is not a reinvented wheel but a composition of existing functions and the filling of technology gaps with new enhancements. Accordingly, the closed loop monitoring framework can be realized in different phases depending on the selection and execution of the phases within the closed loop.
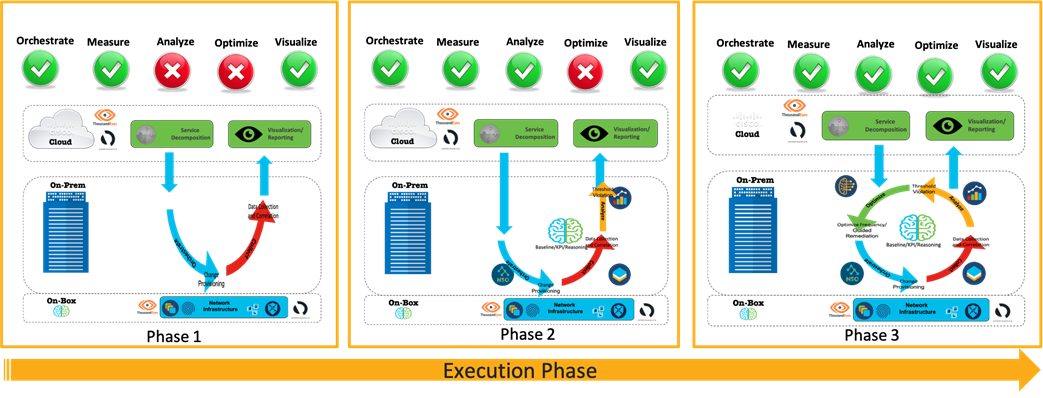
● Phase 1 – The monitoring instances are provisioned, and the operational telemetry data are collected for visualization. This phase lacks any predictive analytics or optimization.
● Phase 2 – The monitoring instances are provisioned, and the operational telemetry data are collected and analyzed against KPI and Cisco knowledge base. Any predictive insights are reported to alert the operator. This phase lacks any optimization.
● Phase 3 – Full blown closed loop assurance framework that dynamically optimize both the monitoring instances and guided remediation for service assurance.
Closed Loop Monitoring Framework Components
This section further explains the sub-components and the existing tools and functionalities that can be used to realize the closed loop assurance framework.
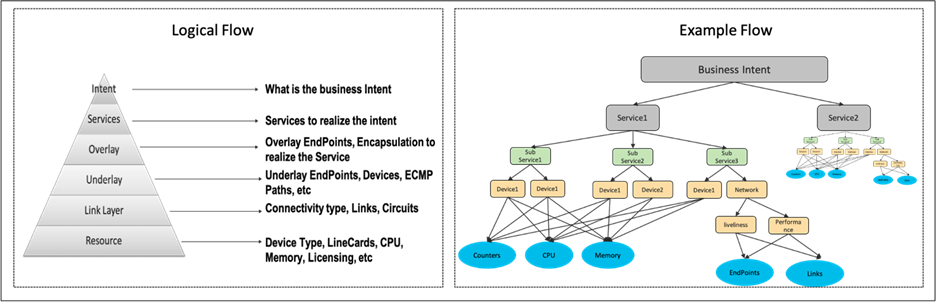
The first step involves the Service Decomposition that converts the business intent into one or more services and decomposes each service further into sub-services to derive the below:
● Trigger – When to collect data (Ex: Continuous vs event-triggered vs event-driven).
● Location – Where to collect the data (Ex: Network Device vs Endpoint vs Cloud entity).
● Data – What to collect (Ex: Sensorpath vs probing result).
● Cadence – Frequency at which the data should be collected (Ex: 5 seconds vs 5 minutes).
This leverages the network topology and service definition along with the optional Cisco knowledge base to decompose each service into sub-services and further to a level of granularity that identifies specific resources within each involved device or ECMP aware network paths and links to monitor. A logical and an example flow is depicted in Figure 7 as shown below.
 |
Based on the decomposed sub-services and the resources to be monitored, a heatmap can be generated to identify the critical resources which in turn is used to identify the monitoring cadence. For example, resource1 being a path shared by 1000 critical users’ needs liveliness and performance monitoring at a very high frequency while comparing to resource2, which is another path used as backup only when the primary goes down.
 |
The service decomposition is used to derive the Trigger/Location/Data/Cadence as shown in the Figure 8 above.
The orchestration and governance of the monitoring instance can be performed by leveraging the network and service controller. The orchestration can be triggered by one of the below:
● The Service decomposition resulting in a new resource to be monitored.
● Any optimization triggered as a result of data analytics.
In the former case, any changes in the business intent, service definition or the network topology may result in a modified sub-service decomposition causing change in the resource being monitored. For example, an application hosted on a public cloud took over the role as primary due to the failure of the instance running On-prem. In this example, the change in the topology results in a modified service decomposition compelling the liveliness and performance check to the application on the public cloud to be monitored at a higher frequency. Alternately, any transit link failure may result in traffic steering over backup links or over other network plane causing a change in the topology or network state. Any such changes may need a totally different set of resources to be prioritized for monitoring.
In the latter case, the analytics on the data collection may trigger a change in the frequency or data to be monitored. Few example scenarios include resources related to a sporadically used link or a device may reduce the monitoring frequency from a few seconds to a few minutes or a potential packet loss noticed in a sporadically used path may need to increase the frequency of monitoring to detect any persistent issue and take the necessary course of action.
Finally, a pre-defined set of heuristic templates or packages can be defined by the experts to define the sub-service mapping along with the metrics and thresholds used for monitoring and analytics purpose. An example, such package defining the sub-service mapping is available in Figure 7.
Monitoring and Remedy Instantiation
Depending on the type of the resource to be monitored, one or more monitoring tools or objects can be instantiated on the relevant location/device for data collection. The monitoring instance can be a simple sensorpath defined on a node to stream the telemetry data at the defined frequency. Figure 9 below depicts an example where BGP service is decomposed into a set of YANG based sensorpaths to monitor the health of control and data plane.
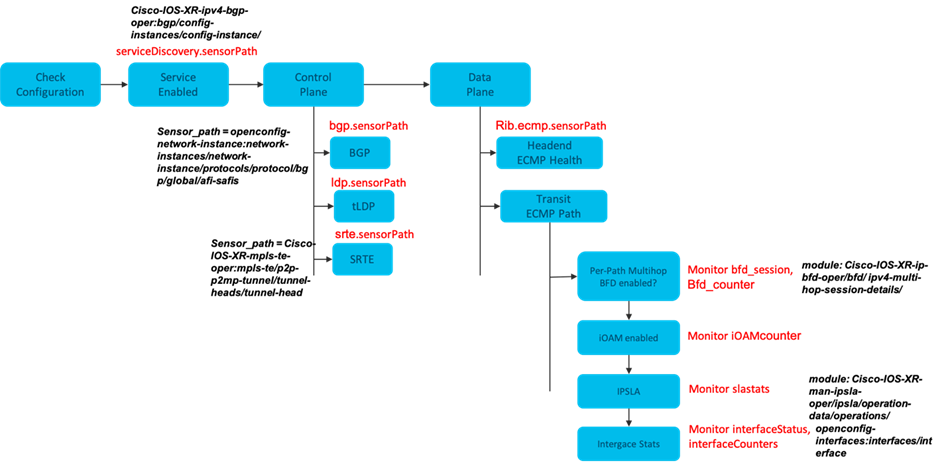 |
The above is an example where the device configuration is used along with service discovery sensorpath to decompose the BGP service into multiple sub-services depending on the type of control plane protocols used, the type of data plane paths and the availability of different OAM features enabled in the network. The relevant sensorpath are enabled on the relevant devices to stream the telemetry data for monitoring.
The service decomposition may result in a more complex set of resources to be monitored that needs a combination of multiple tools or objects to be instantiated on one or more location/devices. A simple example of this sort is ECMP aware path monitoring. Multiple ECMP paths between the endpoints may need:
● Enabling multiple IPSLA configurations on the endpoints (or)
● Virtual OAM containers to be hosted on the endpoints.
● One or more monitoring agents hosted to distributed analytics.
The Remedy instantiation on the other hand is triggered when there is a need to optimize the network to resolve any detected or predicted failure events. The remedy associated with different failures can be system-guided or can be self-defined by the operators based on the network and the hosted services.
The monitoring data collected from the network is used for the analytics purpose. The data collected can be one of the below:
● Event/Model driven telemetry data.
● Analytics results from a monitoring agent.
● Performance or liveliness probe results from one or more end points.
● Local reasoning result applied by the device on the locally collected data.
Each resource being monitored can either be associated with a pre-defined metrics and threshold for assurance or can dynamically derive the metrics and threshold based on the baselining. The data collected from the network is applied against the metrics and threshold for assurance and to detect any deviation.
Any analytics engine powered with reasoning semantics or AIOps capabilities can leverage the reasoning rules defined by the experts for astute insights or to intelligently alert the operator. The data analytics and the reasoning semantics can further help with automatic troubleshooting or failure root cause analysis which further can be tied with the remediation.
One of the key components of this framework is the ability to continuously optimize and monitor the network using closed loop mechanism. The closed loop comprises of:
● Collect
● Analyze
● Optimize
● Implement
Each of the above are performed by different functionalities of the overall framework and collectively offer the dynamic capability to monitor and assure end-to-end network and services.
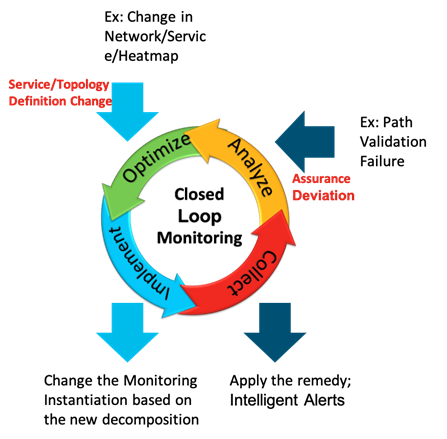
As shown in Figure 10, this closed loop approach can offer two types of optimizations as below:
● Optimizing the network by applying the known remediation action associated with the service deviation.
● Optimize the network monitoring triggered by a change in the network topology or the service definition.
The former type is triggered upon detecting a deviation in the assurance monitoring or a predictive insight based on certain network events. The latter type if triggered upon detecting any change in the network topology, service definition or the heat map defining the critical part of the network.
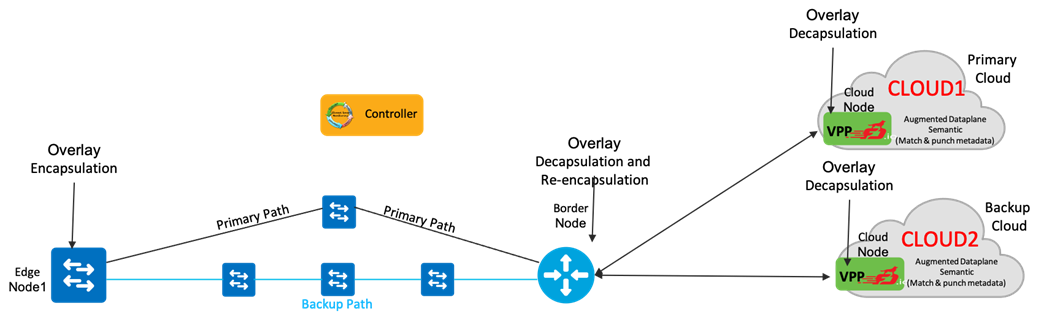
The primary objective is to proactively monitor all the primary services and the primary paths between the Edge Node1 to the application hosted on the public cloud. This either can be directly derived from a business intent or can be one of the sub-services derived as part of primary service decomposition.
Below are the set of monitoring instances derived by applying the service decomposition on this intent:
● Monitor and validate the overlay encapsulation behavior on the Edge Node at high frequency.
● Monitor and validate the overlay decapsulation on Border Node at high frequency.
● Monitor and validate the overlay re-encapsulation behavior on the Border Node at high frequency.
● Monitor and validate the overlay decapsulation behavior on the edge node (VPP) on the primary cloud (Cloud1) at high frequency.
● Monitor and validate the overlay decapsulation behavior on the edge node (VPP) on the backup cloud (Cloud2) at low frequency.
● Monitor all ECMP paths from Edge Node1 to Border Node at high frequency.
● Monitor all backup paths from Edge Node1 to Border Node at low frequency.
Relevant monitoring instances are instantiated to facilitate the above set of monitoring. In this use case, we highlighted the use of the centralized OAM server that is capable of generating OAM probes with multiple overlay headers to steer the probe over any specific path and terminate it on the server itself. One of the benefits with this approach is that there is minimal, or no control plane intervention on any of the endpoints or transit nodes.
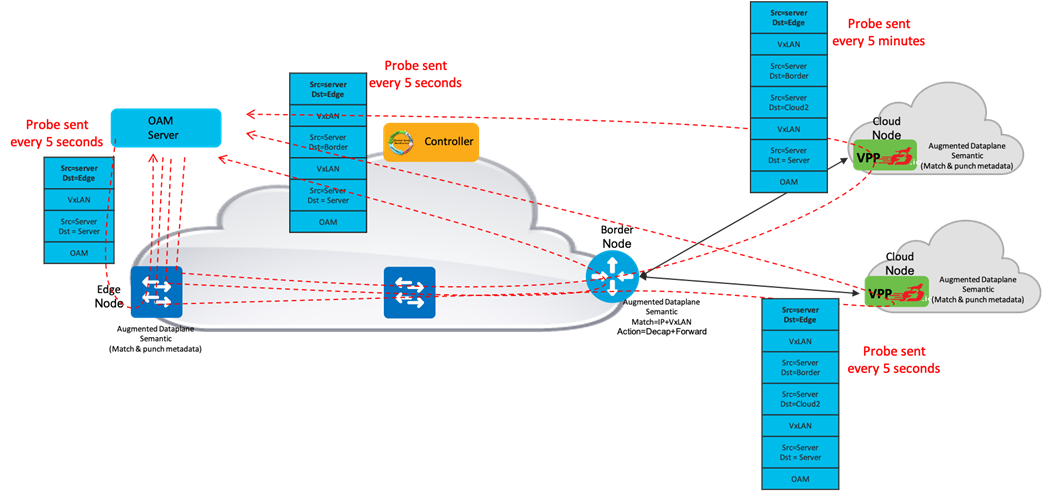
As shown in Figure 12, a centralized OAM server can be programmed to generate multiple OAM probes with header-in-header encapsulation to control the steering over different ECMP paths. For brevity, we highlighted only a few probes in Figure 12. Based on the path or the service being monitored, the OAM server may send the probes at a high frequency (few seconds) or at a low frequency (few minutes).
The associated metrics and threshold for assurance can either be baselined or can be defined by the experts. The metrics used in this use case can be packet loss, jitter, delay or a combination of these metrics.
Any deviation in the monitoring result triggers the optimization to apply the remediation such as costing a link to steer traffic away from a link facing high packet loss or jitter. Any change in the service or network topology triggers the optimization to change the monitoring instance. The application running on Cloud2 taking the primary role, will optimize the monitoring to increase the frequency of the probes from Edge node to Cloud2 while reducing the frequency for the probes via Edge node to Cloud1.
The framework explored in this paper defines a generalized closed loop approach that leverages a combination of various rich-set of features and cross-layer functionalities available in different Cisco offered services such as inbuild-SDK or telemetry data along with the flexibility to define custom built application and reasoning logics to proactively monitor the network path and services for service assurance.
● Nagendra Kumar Nainar, Principal Engineer
● Vijay Raghavendran, Distinguished Engineer
● Ankush Arora, Principal Architect
● Joe Clarke, Distinguished Engineer
● Dave Zacks, Innovation Director
● Marisol Palmero Amador, Technical Leader
● Karthik Hari Babu, Technical Leader
● Amarnath Reddy Nagireddy, Software Engineer