Cisco Penn 1: Energy Analysis Solution Overview
Available Languages
Bias-Free Language
The documentation set for this product strives to use bias-free language. For the purposes of this documentation set, bias-free is defined as language that does not imply discrimination based on age, disability, gender, racial identity, ethnic identity, sexual orientation, socioeconomic status, and intersectionality. Exceptions may be present in the documentation due to language that is hardcoded in the user interfaces of the product software, language used based on RFP documentation, or language that is used by a referenced third-party product. Learn more about how Cisco is using Inclusive Language.
Cisco leased the office space in Penn 1 prior to the retrofit in 2021; at that point the Cisco office occupied space on both the 6th and 9th floors. The office was closed due to COVID on 9 March 2020 and reopened following the retrofit on 4 April 2022. The new hybrid work design allowed Cisco to better optimise use of space, so post retrofit the office occupied just the 9th floor, which reduced the office square footage by 25%.
One of the sustainability dimensions of interest for Penn 1 is the increase in energy efficiency because of the smart building retrofit. In the energy savings analysis that follows, data was just compared for the one floor Cisco retained so the energy data referred to the same floor plate size. In reality, there was also an energy efficiency gained by reducing the office size, but this saving has not been included in the analysis.
Billing information for Cisco’s office in Penn 1 was obtained from the Vornado Realty Trust Energy Information Portal (EIP). The monthly bills from Vornado showed details for total energy usage and cost, and they also included a breakout for nine meters covering the 9th floor as seen in Table 1 below. These nine meters were physically mapped back to the electrical closets on the Penn 1 floor plan as in Diagram 2 below. No information exists on the exact services linked to each meter, so before-and-after energy comparisons could only be done at the aggregate floor level.
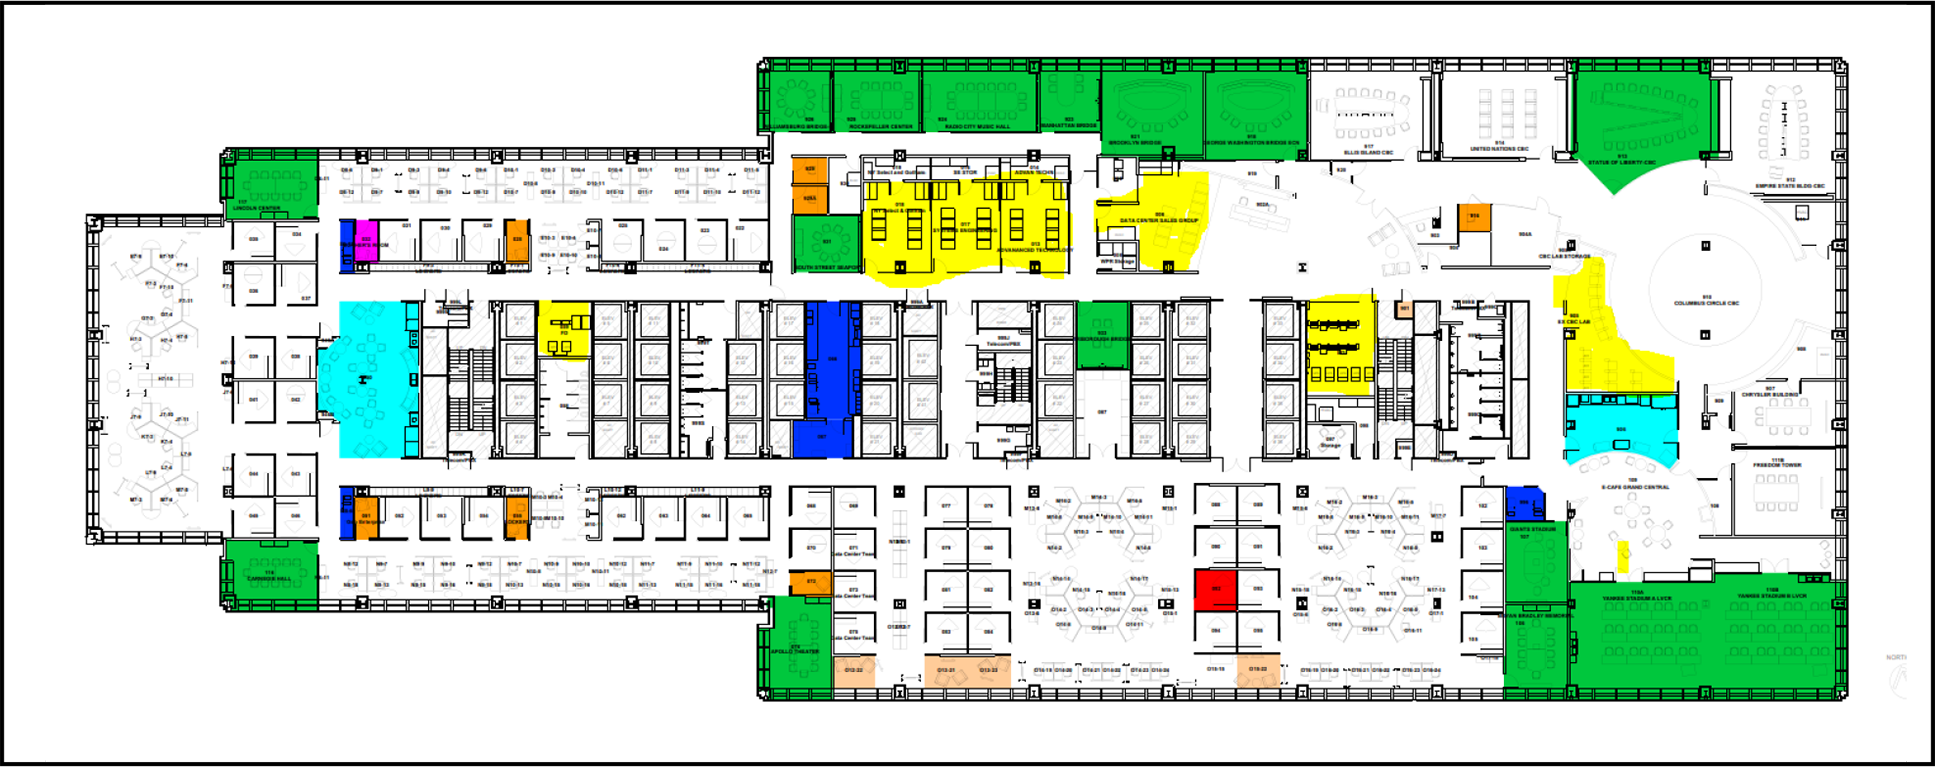
Layout of the 9th floor pre-retrofit
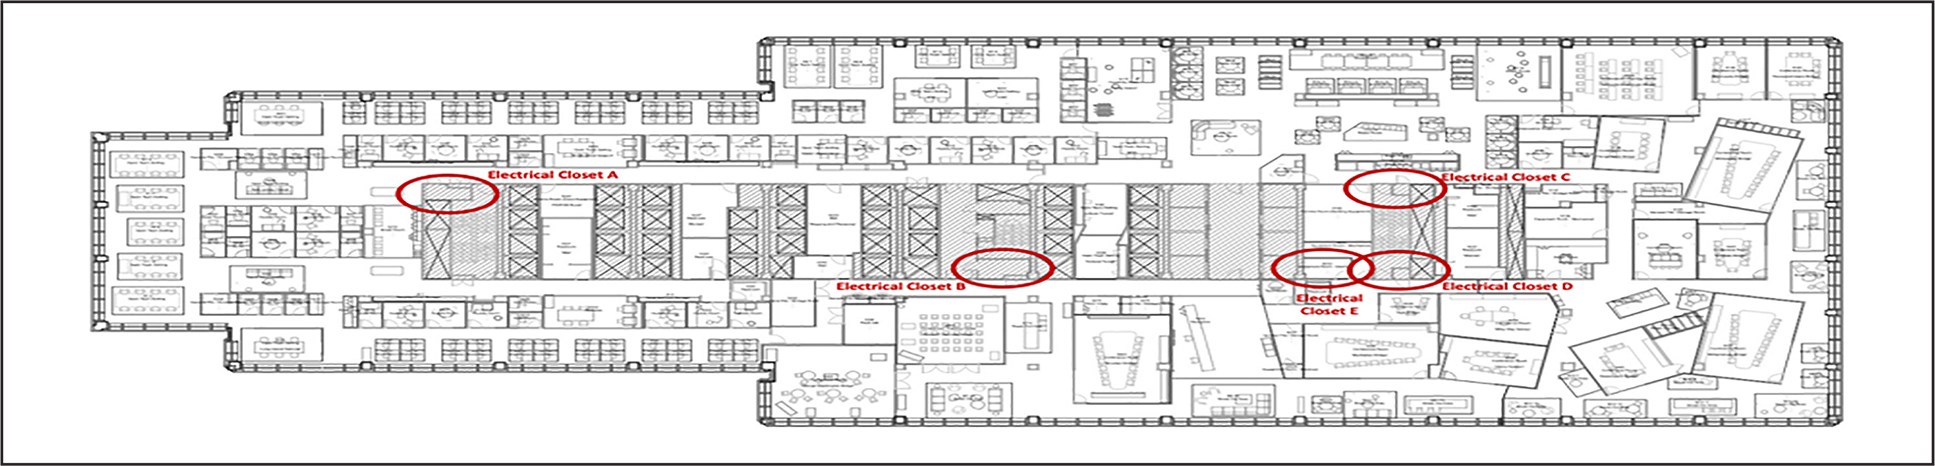
Layout of the 9th floor post-retrofit
Table 1. Meter locations on the 9th floor
| Meter Number |
Location |
Electrical Closet (A, B,C,D,E per lmage beIow) |
Assumed Panle |
| 0709-0352_6 |
|||
| 3455-0626 |
Next to Mkch. Room 901 |
D |
LP-9D |
| 3455-1502 |
Near break room G3-8 |
A |
LP-9A, UP9-A |
| 3455-1503 |
Near break room G3-8 |
A |
LP-9A, UP9-A |
| 3455-1507 |
Freight area |
B |
UP-9B1 |
| 3455-1508 |
Next to BD 9165 |
C |
UP-9C, UP-9C1 |
| 3676-1088 |
Neat break room G3-8 |
A |
LP-9A, UP9-A |
| 3676-1091 |
Next to BD 9165 |
C |
UP-9C, UP-9C1 |
| 3676-1092 |
Next to Mech. Room 901 |
D |
LP-9D |
| 3676-1093 |
Freight area |
B |
UP-9B1 |
The retrofit in 2021 changed several factors in the office design, including a reduction in lab space; the relocation of some meeting rooms from the perimeter of the floor into the middle; changes in daily occupancy levels due to a switch to support hybrid working; and addition of smart technologies such as lighting, window shades, security cameras, and occupancy sensors powered by PoE (Power over Ethernet). Data doesn’t exist before and after the retrofit to isolate the energy impact of each of these changes, so the calculations below looked at the impact for the total design change.
Over time the energy usage in Penn 1 varies based on a number of internal variables such as occupancy levels, equipment usage, and environment control settings, as well as external variables such as time of year, lighting levels, and solar heating intensity. The bills from Vornado typically include energy usage for a month, however the number of days in a billing period can vary for the same month in different years. To compare energy usage pre- and post-retrofit, the daily energy rate for equivalent months was therefore used in the calculations below. In addition, billing periods may have different numbers of weekends and weekdays, and these can have different usage patterns. To limit the impact of this, a second calculation was done over the longest period possible pre- and post-retrofit.
This second calculation allowed a daily average to be compared over an 8-month period pre-retrofit (July 2019 to Feb 2020) and post-retrofit (July 2022 to Feb 2023). Energy use before July 2019 was higher for unknown reasons and use after February 2020 was lower as the office was closed due to COVID on 9 March 2020. Energy in the selected 8-month period from July 2019 to Feb 2020 was therefore seen as the largest window that could be compared pre- and post-retrofit.
Figure 3 below shows the energy data usage profile averaged per day for the period from May 2019 to Feb 2023. The dates below represent the start dates of each billing period.

Penn 1 Energy Usage per day (May 2019 – Feb 2023)
The chart above and Table 2 below with the raw data are colour coded for the different areas of pre-retrofit, COVID lockdown, construction, and post-retrofit. The areas in green are the focus of the subsequent 8-month energy comparison. The areas in grey were ignored as May and June 2019 looked higher than Jul 2019 – Feb 2020 and the reason for the difference was unknown. There appears to be a greater monthly variability of energy use post-retrofit than pre-retrofit; there is also a noticeable decrease in usage in March 2020 when the office went into lockdown due to COVID. There is a very slight decrease in energy usage during the period pre-retrofit and during the second half of the COVID lockdown period. The reasons for these decreases are unknown but could be due to equipment being removed from labs and the office space in preparation for the construction work, donations of video equipment to hospitals during COVID, and for people to use while working at home.
Table 2. Energy usage data from Penn 1 bills
| Start Date |
End Date |
Days |
Total Usage/kWh |
Av. Per Day/kWh |
| 15-May-19 |
14-Jun-19 |
30 |
72,564 |
2,418.80 |
| 14-Jun-19 |
16-Jul-19 |
32 |
79,609 |
2,487.78 |
| 16-Jul-19 |
14-Aug-19 |
29 |
62,959 |
2,171.00 |
| 14-Aug-19 |
13-Sep-19 |
30 |
63,693 |
2,123.10 |
| 13-Sep-19 |
15-Oct-19 |
32 |
68,689 |
2,146.53 |
| 15-Oct-19 |
13-Nov-19 |
29 |
61,172 |
2,109.38 |
| 13-Nov-19 |
16-Dec-19 |
33 |
64,563 |
1,956.45 |
| 16-Dec-19 |
15-Jan-20 |
30 |
59,706 |
1,990.20 |
| 15-Jan-20 |
14-Feb-20 |
30 |
61,786 |
2,059.53 |
| 14-Feb-20 |
17-Mar-20 |
32 |
62,628 |
1,957.13 |
| 17-Mar-20 |
15-Apr-20 |
29 |
45,883 |
1,582.17 |
| 15-Apr-20 |
14-May-20 |
29 |
44,437 |
1,532.31 |
| 14-May-20 |
15-Jun-20 |
32 |
50,067 |
1,564.59 |
| 15-Jun-20 |
15-Jul-20 |
30 |
47,995 |
1,599.83 |
| 15-Jul-20 |
13-Aug-20 |
29 |
44,456 |
1,532.97 |
| 13-Aug-20 |
14-Sep-20 |
32 |
44,440 |
1,388.75 |
| 14-Sep-20 |
14-Oct-20 |
30 |
39,530 |
1,317.67 |
| 14-Oct-20 |
12-Nov-20 |
29 |
40,319 |
1,390.31 |
| 12-Nov-20 |
15-Dec-20 |
33 |
43,588 |
1,320.85 |
| 15-Dec-20 |
15-Jan-21 |
31 |
41,960 |
1,353.55 |
| 15-Jan-21 |
17-Feb-21 |
33 |
38,178 |
1,156.91 |
| 17-Feb-21 |
18-Mar-21 |
29 |
11,388 |
392.69 |
| 18-Mar-21 |
16-Apr-21 |
29 |
9,554 |
329.45 |
| 16-Apr-21 |
14-May-21 |
28 |
7,420 |
265 |
| 14-May-21 |
14-Jun-21 |
31 |
8,389 |
270.61 |
| 14-Jun-21 |
15-Jul-21 |
31 |
4,801 |
154.87 |
| 15-Jul-21 |
13-Aug-21 |
29 |
6,014 |
207.38 |
| 13-Aug-21 |
14-Sep-21 |
32 |
11,538 |
360.56 |
| 14-Sep-21 |
14-Oct-21 |
30 |
19,268 |
642.27 |
| 14-Oct-21 |
14-Nov-21 |
29 |
21,602 |
744.9 |
| 12-Nov-21 |
15-Dec-21 |
33 |
34,394 |
1,042.24 |
| 15-Dec-21 |
14-Jan-22 |
30 |
30,587 |
1,019.57 |
| 14-Jan-22 |
15-Feb-22. |
32 |
34,057 |
1,064.28 |
| 15-Feb-22 |
17-Mar-22 |
30 |
34,834 |
1,161.13 |
| 17-Mar-22 |
15-Apr-22 |
29 |
35,613 |
1,228.03 |
| 15-Apr-22 |
16-May-22 |
31 |
39,565 |
1,276.29 |
| 16-May-22 |
15-Jun-22 |
30 |
42,884 |
1,429.47 |
| 15-Jun-22 |
15-Jul-22 |
30 |
41,736 |
1,391.20 |
| 15-Jul-22 |
15-Aug-22 |
31 |
40,966 |
1,321.48 |
| 15-Aug-22 |
14-Sep-22 |
30 |
41,791 |
1,393.03 |
| 14-Sep-22 |
14-Oct-22 |
30 |
36,250 |
1,208.33 |
| 14-Oct-22 |
14-Nov-22 |
31 |
45,114 |
1,455.29 |
| 14-Nov-22 |
15-Dec-22 |
31 |
45,060 |
1,453.55 |
| 15-Dec-22 |
17-Jan-23 |
33 |
36,496 |
1,105.94 |
| 17-Jan-23 |
15-Feb-23 |
29 |
37,251 |
1,284.52 |
| 15-Feb-23 |
17-Mar-23 |
30 |
42,424 |
1,414.13 |
Table 3 below looks at a month-by-month comparison between energy use pre- and post-retrofit. As discussed previously the difference in days between similar billing months is taken into account by comparing per-day usage below. This doesn’t take into account that there may be differences in the number of workdays and energy use may vary between weekends and workdays.
Table 3. Month by month comparison of energy use pre- and post-retrofit
| Pre-Retrofit |
Post-Retrofit |
|
||||||||
| Start Date |
End |
Days |
Total Usage/kWh |
Av. Per day/kWh |
Start |
End |
Days |
Total Usage/kWh |
Av. Per Day/kWh |
% Change |
| 16-Jul- 2019 |
14-Aug- 2019 |
29 |
62,959 |
2,171.00 |
15-Jul- 2022 |
15-Aug- 2022 |
31 |
40,966 |
1,321.48 |
39.1% |
| 14-Aug- 2019 |
13-Sep- 2019 |
30 |
63,693 |
2,123.10 |
15-Aug- 2022 |
14-Sep- 2022 |
30 |
41,791 |
1,393.03 |
34.4% |
| 13-Sep- 2019 |
15-Oct- 2019 |
32 |
68,689 |
2,146.53 |
14-Sep- 2022 |
14-Oct- 2022 |
30 |
36,250 |
1,208.33 |
43.7% |
| 15-Oct- 2019 |
13-Nov- 2019 |
29 |
61,172 |
2,109.38 |
14-Oct- 2022 |
14-Nov- 2022 |
31 |
45,114 |
1,455.29 |
31.0% |
| 13-Nov- 2019 |
16-Dec- 2019 |
33 |
64,563 |
1,956.45 |
14-Nov- 2022 |
15-Dec- 2022 |
31 |
45,060 |
1,453.55 |
25.7% |
| 16-Dec- 2019 |
15-Jan- 2020 |
30 |
59,706 |
1,990.20 |
15-Dec- 2022 |
17-Jan- 2023 |
33 |
36,496 |
1,105.94 |
44.4% |
| 15-Jan- 2020 |
14-Feb- 2020 |
30 |
61,786 |
2,059.53 |
17-Jan- 2023 |
15-Feb- 2023 |
29 |
37,251 |
1,284.52 |
37.6% |
| 14-Feb- 2020 |
17-Mar- 2022 |
32 |
62,628 |
1,957.13 |
15-Feb- 2023 |
17-Mar- 2023 |
30 |
42,424 |
1,414.13 |
27.7% |
|
Range |
25.7% - 44.4% |
||||||||
|
Average |
35.50% |
||||||||
In Table 3 above over the 8-month period the percentage energy reduction seen month by month is in the range 25.7% to 44.4% with an average of 35.5%. The reduction figure of 39% from Aug 2019 to Aug 2020 is the figure currently used in public statements and presentations for the energy change seen as a result of the new design. This figure was calculated before the longer data sample was available.
Table 4 below looks at the change over the whole 8-month period. This period is more similar in terms of number of days and workdays. In this case an average change of 35.6% was seen between pre- and post-retrofit.
Table 4. Comparison of energy use pre- and post-retrofit over the full 8 month period
| Pre-Retrofit |
Post-Retrofit |
|
||||||||
| Start date |
End date |
Days |
Total usage/kWh |
Av. per day/kWh |
Start date |
End date |
Days |
Total usage/kWh |
Av. per day/kWh |
% Change |
| 16-Jul- 2019 |
17-Mar- 2020 |
245 |
505,196 |
2,062.02 |
15-Jul- 2022 |
17-Mar- 2023 |
245 |
325,352 |
1,327.97 |
35.6% |
|
Average over 8 months |
35.60% |
||||||||
In order to gain more granular insights into the energy usage of the new Penn 1 design, Raritan Smart PDUs (Power Distribution Units) were deployed in the IT and OT PoE infrastructure and the data was captured using Power IQ which is used as the Data Center Energy Management and Power Monitoring Software The data from these PDUs is shown in the next graph. The OT energy at Penn 1 includes the lighting, shading, HVAC (Heating, Ventilation, and Air Conditioning), VAV (Variable Air Volume), and 4 desks. The IT energy includes the Meraki Security cameras and the wireless APs (Access Points). The OT energy varies depending on occupancy and hence is lower on weekends, while the IT energy use is more constant. The current data captured also allows energy to be broken down for each Catalyst 9300 switch stack and for the UCS Hyperflex cluster.
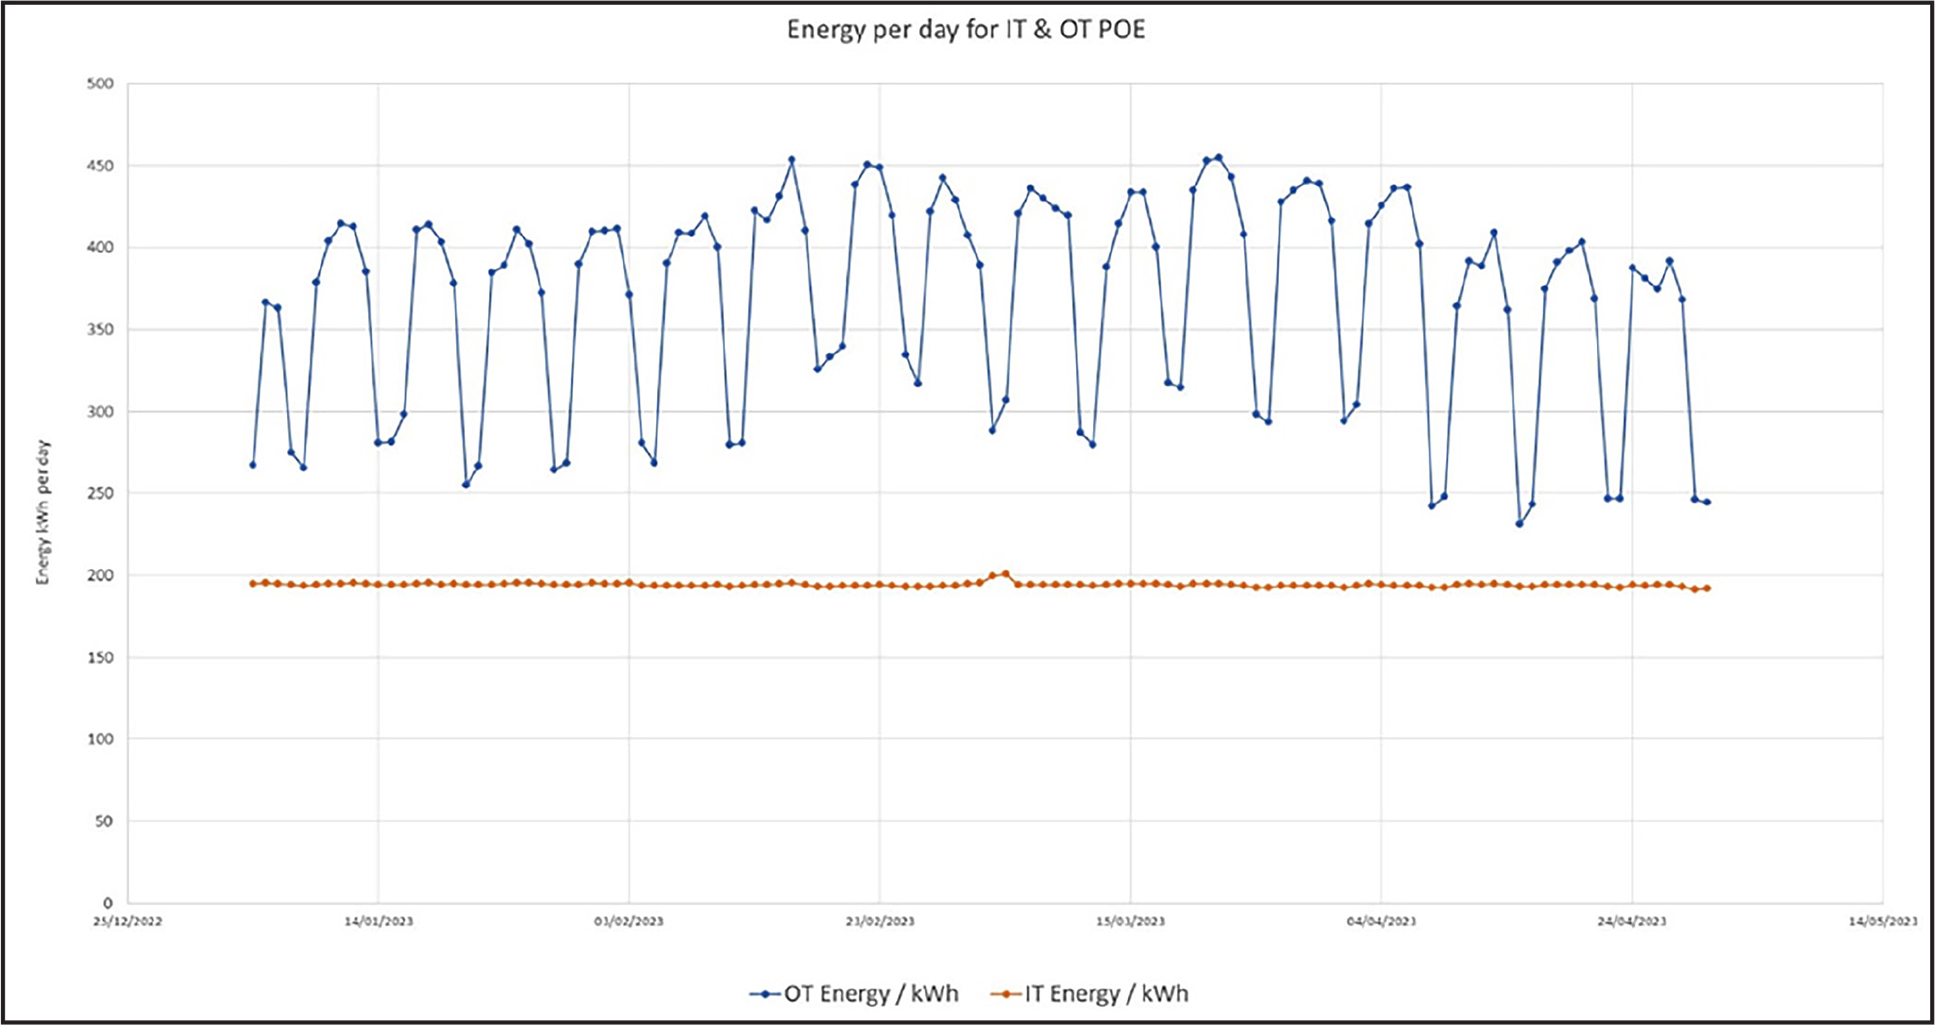
Daily POE IT and OT energy data
Penn 1 was the first of a new smart building design to enable hybrid work in Cisco. Its design introduced a number of innovative energy-saving features, and when looking at the energy use pre-retrofit and post-retrofit, it is clear there is a significant reduction in energy use. A number of parameters were changed during the retrofit and the lack of more detailed energy metering makes it difficult to quantify the impact of individual changes. However, in comparing an 8-month billing period pre- and post-retrofit, we consider it reasonable to say that a savings of ~36% has been realised from the design change. This is consistent in magnitude to the initial stated saving of 39%, which was made when a smaller sample of data was available. As stated in the introduction, this saving is purely for the change in design for the 9th floor and doesn’t take into account the energy saved by reducing the overall floor plate size and vacating the 6th floor. This reduction in floor plate size was also a part of the design to optimise the office for hybrid work, and indeed this reduction in floor plate size and investment in smart building technology is a key part of the “Divest to Invest” program that the real estate team in Cisco are leading as we optimise Cisco’s office space for hybrid work.