Chapter 3: Operating Procedures
Available Languages
Table Of Contents
Verifying the Platform State of the Cisco MGC Hosts
Verifying That Processes Are Running
Verifying the Status of all Destinations
Understanding the Destination State Information
Verifying State of all SS7 Routes
Understanding the SS7 Route State Information
Verifying Available Disk Space
Verifying Available Virtual Memory
Verifying CPU Utilization Level
Verifying the Number of Active Processes
Verifying Available Memory on the Cisco SLTs
Periodic Maintenance Procedures
Automatic Disk Space Monitoring
Creating a Disaster Recovery Plan
Backup Procedures for Cisco MGC Software up to Release 7.4(10)
Backup Procedures for Cisco MGC Software from Release 7.4(11) and up
Displaying Previously Entered MML Commands
Displaying Information About MML Commands
Reentering Previously Entered MML Commands
Retrieving Active MML Sessions
Retrieving Signaling Channel Attributes
Retrieving Signaling Destination Service States
Retrieving the Service State of a Linkset
Retrieving the State of Point Codes
Retrieving the State of SS7 Routes
Retrieving the State of All Local Subsystem Numbers
Retrieving the State of All Remote Subsystem Numbers
Enabling Blocking/Unblocking Messages
Enabling Group Service Reset Messages
Verifying Proper Replication of Calls
Retrieving the States of Bearers Held By a Media Gateway
Retrieving the Administrative State
Starting a Provisioning Session
Saving and Activating your Provisioning Changes
Ending a Provisioning Session Without Activating your Changes
Invoking Dynamic Reconfiguration
Managing Automatic Congestion Control
Managing your Cisco MGC Platform
Performing a Manual Switchover
Verifying Successful Completion of a Switchover
Verifying the Patch Level of the Cisco MGC
Retrieving Configuration Table Data
Retrieving the Logging Level of Software Processes
Retrieving Link or Linkset Measurements
Retrieving SS7 Signaling Point Measurements
Using the Cisco MGC Viewer Toolkit
Launching the Cisco MGC Toolbar
Using the Alarm and Measurement Viewer
Using the Call Detail Record Viewer
Using the Translation Verification Viewer
Cisco MGC Node Operations
This chapter contains recommended operating procedures for the Cisco Media Gateway Controller (MGC) node. In these procedures, the assumption is that all components have been correctly installed, configured, and provisioned in accordance with the instructions provided in the relevant documentation. All components are assumed to have been successfully started, as described in "Cisco MGC Node Component Startup and Shutdown Procedures."

Note
Operation of the Cisco MGC node should be performed by someone who has been trained in the complexities of the system, who has some experience administering the system, and who understands UNIX at the system administrator level.
This chapter contains the following sections:
•
Daily Tasks
The following section detail the procedures you should perform on a daily basis on the Cisco MGC. These procedures use Man-Machine Language (MML) and UNIX commands. These procedures can also be performed using the optional Cisco MGC Node Manager (CMNM) application. For more information on using the CMNM to operate the Cisco MGC, refer to the Cisco MGC Node Manager User's Guide.
The tasks you should perform on a daily basis are found in the following sections:
•
•
•
•
•
•
•
•
•
•
Starting an MML Session
When a procedure requires that you start an MML session, you must perform the following steps:
Note
Step 1
Step 2
mmlIf you receive an error message indicating that sessions are already in use, enter the following command:
mml -s session numberUse any session number from 2 through 12 and repeat until you find a vacant session. Once you have successfully started an MML session, the prompt changes to:
machine_name mml>
Verifying the Platform State of the Cisco MGC Hosts
You can determine which of your Cisco MGC hosts is the active Cisco MGC and which is the standby Cisco MGC. If your system uses a Cisco MGC in a simplex configuration, the single Cisco MGC host is always active. To do this, complete the following steps:
Step 1
rtrv-neThe system should return a message, similar to the following, if it is currently the active Cisco MGC:
Media Gateway Controller 2000-03-29 14:15:22M RTRV"Type:MGC""Hardware platform:sun4u sparc SUNW,Ultra-5_10""Vendor:"Cisco Systems, Inc."""Location:Media Gateway Controller""Version:"7.4(12)"""Platform State:ACTIVE"The valid values for the Platform State field are ACTIVE, STANDBY, or OOS.
Step 2
rtrv-neThe system should return a message that indicates that it is in either the active or standby platform state.
If the Cisco MGC hosts have changed their platform state, determine why the switchover occurred by searching the contents of the active system log file, as described in the "Viewing System Logs" section.
If the platform state of either Cisco MGC host is OOS, check the alarms as described in the "Monitoring the Alarms Status" section, and take the actions necessary to correct the condition that caused the associated alarm(s). The alarms that require you to take corrective action and their associated actions can be found in the "Alarm Troubleshooting Procedures" section. A complete listing of alarms can be found in the Cisco Media Gateway Controller Software Release 7 Messages Reference Guide.
If the platform state of both Cisco MGC hosts is active, proceed to Step 4.
Step 3
cd /opt/CiscoMGC/etcls -lThe system returns a response similar to the following:
total 35350-rw-r--r-- 1 mgcusr mgcgrp 38240 May 8 10:46 02.trigger-rw-rw-r-- 1 mgcusr mgcgrp 20488 Oct 10 2000 64eisup.batlrwxrwxrwx 1 mgcusr mgcgrp 43 Aug 1 18:55 active_link -> /opt/CiscoMGC/etc/CONFIG_LIB/CFG_pol-addipl-rw-rw-rw- 1 mgcusr mgcgrp 30907 Jul 24 15:29 alarmCats.dat-rw-rw-rw- 1 mgcusr mgcgrp 2064 Jun 4 10:57 alarmTable.dat-rw-rw-rw- 1 mgcusr mgcgrp 0 Jun 4 10:57 auxSigPath.datIdentify the active_link file. The listing indicates which configuration is currently active. The active configuration in the example is CFG_pol-addipl.
If the configuration has changed, you may want to compare the active configuration to the previous configuration.
Step 4
Verifying That Processes Are Running
To verify that the processes on your Cisco MGC are running, perform the following steps:
Step 1
rtrv-softw:allThe system returns a response similar to the following:
Media Gateway Controller - MGC-04 2000-04-05 08:06:03M RTRV"CFM-01:RUNNING ACTIVE""ALM-01:RUNNING ACTIVE""MM-01:RUNNING ACTIVE""AMDMPR-01:RUNNING ACTIVE""CDRDMPR-01:RUNNING ACTIVE""DSKM-01:RUNNING IN N/A STATE""MMDB-01:RUNNING IN N/A STATE""POM-01:RUNNING ACTIVE""MEASAGT:RUNNING ACTIVE""OPERSAGT:RUNNING ACTIVE""PROVSAGT:RUNNING ACTIVE""MGCP-1:RUNNING IN N/A STATE""Replic-01:RUNNING ACTIVE""ENG-01:RUNNING ACTIVE""IOCM-01:RUNNING ACTIVE""TCAP-01:RUNNING IN N/A STATE""FOD-01:RUNNING IN N/A STATE""EISUP-1:RUNNING IN N/A STATE""SS7-A-1:RUNNING IN N/A STATE"
Note
Step 2
If any of the processes are stopped, contact the Cisco TAC for assistance. Refer to the "Obtaining Technical Assistance" section for more information on contacting the Cisco TAC.
Understanding Processes
The Cisco MGC software contains processes and process groups that perform various functions. These functions include managing the I/O channels; generating alarms, call detail records (CDRs), and logs; and performing signal conversion. All these processes are managed by the process manager process of the Cisco MGC software.
Three different monitoring levels are offered:
•
•
•
Table 3-1 shows the system processes and process groups controlled by the process manager.
Monitoring the Alarms Status
If you monitor the alarm status of the Cisco MGC continuously, you can determine how often a particular alarm occurs in a specific period of time. To monitor the alarm status of the Cisco MGC on a continuous basis, perform the following steps:
Step 1
rtrv-alms::contThe system returns a response that shows all active alarms:
Media Gateway Controller 2000-02-26 11:41:01M RTRV"LPC-01: 2000-02-26 09:16:07.806,""LPC-01:ALM=\"SCMGC MTP3 COMM FAIL\",SEV=MJ""IOCM-01: 2000-02-26 09:17:00.690,""IOCM-01:ALM=\"Config Fail\",SEV=MN""MGC1alink2: 2000-02-26 09:17:47.224,ALM=\"SC FAIL\",SEV=MJ""MGC1alink3: 2000-02-26 09:17:47.225,ALM=\"SC FAIL\",SEV=MJ""MGC1alink4: 2000-02-26 09:17:47.226,ALM=\"SC FAIL\",SEV=MJ""MGC2alink1: 2000-02-26 09:17:47.227,ALM=\"SC FAIL\",SEV=MJ""MGC2alink2: 2000-02-26 09:17:47.227,ALM=\"SC FAIL\",SEV=MJ""MGC2alink4: 2000-02-26 09:17:47.229,ALM=\"SC FAIL\",SEV=MJ""dpc5: 2000-02-26 09:17:47.271,ALM=\"PC UNAVAIL\",SEV=MJ""ls3link1: 2000-02-26 09:16:28.174,""ls3link1:ALM=\"Config Fail\",SEV=MN""ls3link1: 2000-02-26 09:18:59.844,ALM=\"SC FAIL\",SEV=MJ"Step 2
You can also find additional information on the conditions that caused the alarms by viewing the system logs. The logs can be viewed using the log viewer, part of the Cisco MGC viewer toolkit. For information on using the log viewer, see the "Using the Log Viewer" section.
Note
Understanding Alarms
The following subsections describe each of the message components for the typical alarm response shown below:
"LPC-01: 2000-02-26 09:16:07.806,""LPC-01:ALM=\"SCMGC MTP3 COMM FAIL\",SEV=MJ""IOCM-01: 2000-02-26 09:17:00.690,""IOCM-01:ALM=\"Config Fail\",SEV=MN""MGC1alink2: 2000-02-26 09:17:47.224,ALM=\"SC FAIL\",SEV=MJ""MGC1alink3: 2000-02-26 09:17:47.225,ALM=\"SC FAIL\",SEV=MJ"Component ID
The first element of the alarm message identifies the system component that generated the alarm, using the customer-defined description of the component given during system configuration. In our example, these are LPC-01, IOCM-01, MGC1alink2, and MGC1alink3.
All system components are described in the Cisco Media Gateway Controller Software Release 7 Provisioning Guide.
Time Stamp
The second element of the alarm message identifies the time of the alarm by year, month, day, hour, minute, hundredths, and thousandths of a second (milliseconds). The time displayed is the system time. In the example, these would be 2000-02-26 09:16:07.806, 2000-02-26 09:17:00.690, 2000-02-26 09:17:47.224, and 2000-02-26 09:17:47.225.
Alarm Category
The third element of the alarm message identifies the alarm category. It indicates the MML description of the alarm/event. In our example:
•
•
•
Severity Level
The last element of the alarm message identifies the severity level of the alarm. The four levels are
•

Caution
•
Cisco MGC to the standby Cisco MGC.•
•
Verifying the Status of all Destinations
To verify the status of all of the destination point codes (DPCs) provisioned on your Cisco MGC, perform the following steps:
Step 1
rtrv-dest:allThe system returns a response similar to the following:
Media Gateway Controller - MGC-04 2000-04-05 08:05:36M RTRV"dpc1:PKG=SS7-ANSI,ASSOC=SWITCHED,PST=IS,SST=UND""dpc2:PKG=SS7-ANSI,ASSOC=SWITCHED,PST=IS,SST=UND""dpc3:PKG=SS7-ANSI,ASSOC=SWITCHED,PST=IS,SST=UND""dpc4:PKG=SS7-ANSI,ASSOC=SWITCHED,PST=IS,SST=UND""dpc5:PKG=SS7-ANSI,ASSOC=SWITCHED,PST=IS,SST=UND""dpc6:PKG=SS7-ANSI,ASSOC=SWITCHED,PST=IS,SST=UND""eisupftsvc:PKG=EISUP,ASSOC=SWITCHED,PST=IS,SST=UND""eisupsvc1:PKG=EISUP,ASSOC=SWITCHED,PST=IS,SST=UND"
Note
Step 2
If a signaling-related alarm appears, you can determine the appropriate course of action by searching for the corrective actions for that alarm in the "Alarm Troubleshooting Procedures" section. If the alarm is not in that section, corrective action is not required. More information on the alarm can be found in the Cisco Media Gateway Controller Software Release 7 Messages Reference Guide.
You can also find additional information on the conditions that caused the alarms by viewing the system logs. The logs can be viewed using the log viewer, part of the Cisco MGC viewer toolkit. For information on using the log viewer, see the "Using the Log Viewer" section.
Note
Understanding the Destination State Information
The following sections describe the information returned by the system when you enter the rtrv-dest command, as in the example below:
"dpc1:PKG=SS7-ANSI,ASSOC=SWITCHED,PST=IS,SST=UND""dpc2:PKG=SS7-ANSI,ASSOC=SWITCHED,PST=IS,SST=UND""dpc3:PKG=SS7-ANSI,ASSOC=SWITCHED,PST=IS,SST=UND"Destination
The first field lists the MML name of the DPC. In the above example, this is dpc1, dpc2, and dpc3
Package
The PKG field lists the protocol package associated with the destination. In the example, the protocol is SS7-ANSI.
Association
The ASSOC field shows the type of association, either unknown, switched, or a specific channel for the destination. In the example, the association type is SWITCHED.
Primary Service State
The PST field shows the current primary service state of the destination. In the example, all of the destinations have a primary service state of IS. Table 3-2 lists the valid primary service state values:
Secondary Service State
The SST field shows the current secondary service state of the specified destination. In the example, all of the DPCs have a secondary service state of UND. The valid states are listed below:
•
•
•
•
•
•
•
•
•
•
•
•
•
•
•
Note
Verifying State of all SS7 Routes
To verify the status of all of the SS7 routes provisioned on your Cisco MGC, perform the following steps:
Step 1
rtrv-rte:allThe system returns a message similar to the following:
MGC-01 - Media Gateway Controller 2001-05-22 11:35:46M RTRV"dpc1:linkset1,APC=244.001.040,PRIO=1,PST=IS,SST=NA""dpc1:linkset2,APC=244.002.040,PRIO=1,PST=IS,SST=NA""dpc2:linkset1,APC=244.001.041,PRIO=1,PST=IS,SST=NA""dpc2:linkset2,APC=244.002.041,PRIO=1,PST=IS,SST=NA""dpc4:linkset1,APC=244.001.044,PRIO=1,PST=IS,SST=NA""dpc4:linkset2,APC=244.002.044,PRIO=1,PST=IS,SST=NA"Step 2
If a signaling-related alarm appears, you can determine the appropriate course of action by searching for the corrective actions for that alarm in the "Alarm Troubleshooting Procedures" section. If the alarm is not in that section, corrective action is not required. More information on the alarm can be found in the Cisco Media Gateway Controller Software Release 7 Messages Reference Guide.
You can also find additional information on the conditions that caused the alarms by viewing the system logs. The logs can be viewed using the log viewer, part of the Cisco MGC viewer toolkit. For information on using the log viewer, see the "Using the Log Viewer" section.
Understanding the SS7 Route State Information
The following sections describe the information returned by the system when you enter the rtrv-rte command, as shown in the example below:
"dpc1:linkset1,APC=244.001.040,PRIO=1,PST=IS,SST=NA""dpc1:linkset2,APC=244.002.040,PRIO=1,PST=IS,SST=NA""dpc2:linkset1,APC=244.001.041,PRIO=1,PST=IS,SST=NA""dpc2:linkset2,APC=244.002.041,PRIO=1,PST=IS,SST=NA"Point Code
The first field lists the MML name for the target point code associated with the SS7 route. In the example, the point codes are dpc1 and dpc2.
Linkset
The second field lists the MML name for the linkset associated with the SS7 route. In the example, the linksets are linkset1 and linkset 2.
Adjacent Point Code
The APC field lists the point code for the adjacent point code (APC) associated with the SS7 route. In the example there are four point codes:
•
•
•
•
Priority
The PRIO field lists the priority provisioned for this SS7 route. In the example, all of the SS7 routes have a priority of 1.
Primary Service State
The PST field shows the current primary service state of the destination. In the example, all of the SS7 routes have a primary service state of IS. Table 3-2 lists the valid primary service state values:
Secondary Service State
The SST field shows the current secondary service state of the specified destination. In the example, all of the SS7 routes have a primary service state of NA. The valid states are listed below:
•
•
•
•
•
•
•
•
•
•
•
•
•
•
•
•
•
•
•
•
•
•
•
•
Verifying CIC States
We recommend verifying the status of your circuit identification codes (CICs) in groups, to ensure that you have current state information. Retrieving the status of all of your CICs at once can take a while to obtain, and then a long time to page through.
To verify the status of CICs provisioned on your Cisco MGC in groups, perform the following steps:
Step 1
rtrv-cic:dest_pc:cic=number[,rng=range]Where:
•
•
•
For example, the MML command listed below retrieves bearer channel information for CICs 1-20 on destination point code dpc1:
rtrv-cic:dpc1:cic=1,rng=20When the Cisco MGC software is used on a nailed network, the system returns a response similar to the following:
Media Gateway Controller - MGC-04 2000-04-05 08:05:54M RTRV"dpc1:CIC=1,PST=IS,CALL=IDLE,BLK=NONE""dpc1:CIC=2,PST=IS,CALL=IDLE,BLK=NONE""dpc1:CIC=3,PST=IS,CALL=IDLE,BLK=NONE""dpc1:CIC=4,PST=IS,CALL=IDLE,BLK=NONE""dpc1:CIC=5,PST=IS,CALL=IDLE,BLK=NONE""dpc1:CIC=6,PST=IS,CALL=IDLE,BLK=NONE""dpc1:CIC=7,PST=IS,CALL=IDLE,BLK=NONE""dpc1:CIC=8,PST=IS,CALL=IDLE,BLK=NONE""dpc1:CIC=9,PST=IS,CALL=IDLE,BLK=NONE""dpc1:CIC=10,PST=IS,CALL=IDLE,BLK=NONE""dpc1:CIC=11,PST=IS,CALL=IDLE,BLK=NONE""dpc1:CIC=12,PST=IS,CALL=IDLE,BLK=NONE""dpc1:CIC=13,PST=IS,CALL=IDLE,BLK=NONE""dpc1:CIC=14,PST=IS,CALL=IDLE,BLK=NONE""dpc1:CIC=15,PST=IS,CALL=IDLE,BLK=NONE""dpc1:CIC=16,PST=IS,CALL=IDLE,BLK=NONE""dpc1:CIC=17,PST=IS,CALL=IDLE,BLK=NONE""dpc1:CIC=18,PST=IS,CALL=IDLE,BLK=NONE""dpc1:CIC=19,PST=IS,CALL=IDLE,BLK=NONE""dpc1:CIC=20,PST=IS,CALL=IDLE,BLK=NONE"When the Cisco MGC software is used on a switched network, the system returns a response similar to the following:
Media Gateway Controller - MGC-04 2000-04-05 08:05:54M RTRV"dpc1:CIC=10,PST=IS,CALL=IDLE,GW_STAT=CXN_IS,BLK=NONE""dpc1:CIC=11,PST=IS,CALL=IDLE,GW_STAT=CXN_IS,BLK=NONE""dpc1:CIC=12,PST=IS,CALL=IDLE,GW_STAT=CXN_IS,BLK=NONE""dpc1:CIC=13,PST=IS,CALL=IDLE,GW_STAT=CXN_IS,BLK=NONE""dpc1:CIC=14,PST=IS,CALL=IDLE,GW_STAT=CXN_IS,BLK=NONE""dpc1:CIC=15,PST=IS,CALL=IDLE,GW_STAT=CXN_IS,BLK=NONE"Step 2
If a bearer channel-related alarm appears, you can determine the appropriate course of action by searching for the corrective actions for that alarm in the "Alarm Troubleshooting Procedures" section. If the alarm is not in that section, corrective action is not required. More information on the alarm can be found in the Cisco Media Gateway Controller Software Release 7 Messages Reference Guide.
Understanding CIC States
The elements of the output from the rtrv-cic MML command is described in the paragraphs that follow.
Circuit Identification
The output of this command identifies the MML name of the associated signaling channel and the number for each CIC.
Primary Service State
The PST field shows the current primary service state of the CIC. Table 3-4 lists the valid primary service state values:
Call State
The CALL field identifies the current call state of each CIC. After a call is initiated, a circuit does not return to the Idle (available) state until all related release signaling is satisfactorily completed (the correct release sequence). In and Out call states indicate that the CIC is not available for new calls. Table 3-5 describes the various call states.
Media Gateway State
The GW_STAT field identifies the current state of the media gateway associated with each CIC. Table 3-6 describes the various media gateway states.
Circuit Block Type
The BLK field identifies the type of circuit block that has been placed on the CIC. Blocked circuits are not available for calls. Table 3-7 describes the valid circuit block types.
Note
Verifying Available Disk Space
You should monitor the amount of disk space available on your Cisco MGC on a daily basis. The percentage of disk space capacity used should always be below 90 percent capacity. If your system's percentage of disk space capacity used 90 percent or higher, you must delete files from your disk drive. To verify your available disk space, perform the following steps:
Step 1
df -kThe system returns a response similar to the following:
Filesystem kbytes used avail capacity Mounted on/dev/dsk/c0t0d0s0 1018191 114909 842191 13% //dev/dsk/c0t0d0s4 2056211 422774 1571751 22% /usrIf the response to the command indicates a percentage of disk space capacity used 90 percent or higher, you must delete files from your disk drive, as described in the "Deleting Unnecessary Files to Increase Available Disk Space" section.
Step 2
Verifying Available Virtual Memory
The operating system used on the Cisco MGC hosts, Solaris 2.6, is a virtual memory system. A virtual memory system adds to the available memory by writing the contents of an unused block of memory to the disk drive, enabling that block of memory to be used for another purpose. The space on the disk drive dedicated to this function is known as the swap space. Once the data in that block of memory is needed again, the system reads the stored block from the swap space back into memory.
In a typical Cisco MGC installation, the tmp directory (/tmp) is a temporary file system mount that coexists in the same physical disk partition as the swap space. The tmp directory is used to run a number of special files, such as FIFOs, that are required for the system to run properly. As the amount of space allocated to the tmp directory increases, the amount of space available for running Cisco MGC processes decreases, which can cause functional problems. You need to ensure that the amount of space consumed by the tmp directory is kept to a minimum.
Caution
To determine the amount of available virtual memory, you must compare the amount of virtual memory in use to the maximum amount of virtual memory for your system. To do this, perform the following steps:
Note
If this is the case, consider also performing this procedure during a less active call processing time, to determine an average amount of available virtual memory.
Step 1
cd /usr/sbinprtconf | grep MemoryThe system returns a response similar to the following:
Memory size: 512 MegabytesStep 2
swap -sThe system returns a response similar to the following:
total: 57944k bytes allocated + 552816k reserved = 610760k used, 1359904k availableStep 3
Step 4
vmstatThe system returns a response similar to the following:
procs memory page disk faults cpur b w swap free re mf pi po fr de sr s0 s1 s6 -- in sy cs us sy id0 0 0 3176 22320 0 1 0 0 0 0 0 0 0 0 0 131 116 104 0 1 99The amount of swap and free memory listed in the response (3176 and 22,320 in the above example) represents the total amount of available virtual memory. This amount should always be greater than 10 percent of the maximum virtual memory. If this is not the case, proceed to Step 5.
Note
When the vmstat command is used to check the available virtual memory repeatedly, you should ignore the first line of output.
Step 5
Verifying Available RAM
You should check the amount of available RAM on the Cisco MGC on a daily basis. To do this, perform the following steps:
Step 1
dmesg | grep memThe system returns a response similar to the following:
mem = 2097152K (0x80000000)avail mem = 2088370176If the response indicates that you have plenty of memory available, the procedure is complete. If the response indicates that your system has a small amount of available memory, you may need to add additional memory to your Cisco MGC to handle your system's call processing load.
Note
If this is the case, consider also performing this procedure during a less active call processing time, to determine an average amount of available memory.
Step 2
Verifying CPU Utilization Level
You should check the CPU utilization level on the Cisco MGC on a daily basis. To do this, log into the active Cisco MGC and enter the following UNIX command:
ps -ef -o user,pid,pcpu -o argsThe system returns a response similar to the following:
va-herring% ps -ef -o user,pid,pcpu -o argsUSER PID %CPU COMMANDroot 0 0.0 schedroot 1 0.0 /etc/init -root 2 0.0 pageoutroot 3 0.1 fsflushroot 176 0.0 /usr/sbin/ntpdate -s -w 172.24.239.41 171.69.10.2 171.69.4.143 172.24.24.16 198root 152 0.0 /usr/lib/nfs/lockdroot 727 0.0 /usr/lib/saf/sac -t 300root 175 0.0 /sbin/sh /etc/rc2.d/S74xntpd startroot 120 0.0 /usr/sbin/keyservroot 118 0.0 /usr/sbin/rpcbindroot 190 0.0 /usr/sbin/nscdroot 145 0.0 /usr/sbin/inetd -sdaemon 150 0.0 /usr/lib/nfs/statdroot 167 0.0 /usr/lib/autofs/automountdroot 171 0.2 /usr/sbin/syslogdroot 324 0.0 /usr/sbin/rpc.bootparamdroot 184 0.0 /usr/sbin/cronroot 29986 0.0 in.rlogindroot 200 0.0 /usr/lib/lpschedroot 731 0.0 /usr/lib/saf/ttymonroot 9560 0.0 /opt/TimesTen32/32/bin/timestensubd -id 7root 218 0.0 /usr/lib/power/powerdroot 228 0.0 /usr/lib/utmpdmgcusr 9991 0.0 ../bin/cdrDmpr -X 30005root 11085 0.0 /opt/CiscoMGC/bin/hostagtmgcusr 29589 0.0 procMroot 10935 0.0 /opt/TimesTen32/32/bin/timestenrepd -id 8 -datastore /opt/TimesTen32/datastore/root 6396 0.0 ps -ef -o user,pid,pcpu -o argsroot 10099 0.0 ../bin/foverd -X 30012mgcusr 10097 0.0 ../bin/SS7 -X 30011mgcusr 10095 0.1 ../bin/ISDNIP -X 3000cmgcusr 10000 0.0 ../bin/pom -X 30008root 294 0.0 /usr/sbin/voldroot 728 0.0 /usr/lib/saf/ttymon -g -h -p va-herring console login: -T sun -d /dev/consoleroot 277 0.0 /usr/lib/sendmail -bd -q15mroot 11089 0.0 /opt/CiscoMGC/bin/fsagtroot 322 0.0 /usr/sbin/in.rarpd -aroot 9553 0.0 /opt/TimesTen32/32/bin/timestensubd -id 0mgcusr 10096 0.0 ../bin/SS7 -X 30014mgcusr 9990 0.0 ../bin/amDmpr -X 30004root 11105 0.0 /opt/CiscoMGC/bin/snmpdm -tcplocal -dmgcusr 10039 0.0 ../bin/replicator -X 3000d -C ../etc/XECfgParm.dat -troot 10674 0.0 in.rlogindroot 10046 0.0 ../bin/sagt -X 3000aroot 27543 0.0 in.telnetdroot 9558 0.0 /opt/TimesTen32/32/bin/timestensubd -id 5root 9557 0.0 /opt/TimesTen32/32/bin/timestensubd -id 4mgcusr 10094 0.0 ../bin/TCAP -X 30010root 9556 0.0 /opt/TimesTen32/32/bin/timestensubd -id 3root 11106 0.0 /opt/CiscoMGC/bin/mib2agt -droot 10042 0.0 ../bin/mmSAgt -X 30009mgcusr 10098 0.0 ../bin/SS7 -X 30013root 11092 0.0 /opt/CiscoMGC/bin/critagt -dhaustin 10676 0.0 /usr/bin/tcshroot 9559 0.0 /opt/TimesTen32/32/bin/timestensubd -id 6root 9983 0.0 ../bin/almM -X 30002root 9554 0.0 /opt/TimesTen32/32/bin/timestensubd -id 1root 9555 0.0 /opt/TimesTen32/32/bin/timestensubd -id 2mgcusr 10092 0.0 ../bin/mmdbd -X 30007ipolat 28514 0.0 less platform_20010802040535.logmgcusr 9981 0.1 ../bin/LogServerd -X 30015root 9552 0.0 /opt/TimesTen32/32/bin/timestendmgcusr 9997 0.0 ../bin/measMgr -X 30003ricchen 29988 0.0 /usr/bin/tcshmgcusr 9994 0.0 ../bin/cfgM -X 30001mgcusr 10034 0.0 ../bin/engine -X 3000eroot 10049 0.0 ../bin/provSAgt -X 3000bricchen 24054 0.0 mmlroot 1661 0.0 in.telnetdmgcusr 1663 0.0 -cshipolat 27545 0.0 /usr/bin/tcshroot 10093 0.0 ../bin/ioChanMgr -X 3000fCheck the percentage of CPU resources used for each process (found in the %CPU column). The response from the command represents a snapshot of CPU utilization. We recommend entering the UNIX command repeatedly to construct a more accurate picture of CPU utilization. If a process is using a large amount of CPU resources over a extended period of time, you should contact the Cisco TAC for assistance. Refer to the "Obtaining Technical Assistance" section for more information on contacting the Cisco TAC.
Verifying the Number of Active Processes
You should check the number of active processes on the Cisco MGC on a daily basis. To do this, log into the active Cisco MGC and enter the following UNIX command:
ps -efThe system returns a response similar to the following:
UID PID PPID C STIME TTY TIME CMDroot 0 0 0 10:28:20 ? 0:00 schedroot 1 0 0 10:28:20 ? 0:27 /etc/init -root 2 0 0 10:28:20 ? 0:00 pageoutroot 3 0 0 10:28:20 ? 1:01 fsflushroot 174 173 0 10:29:03 ? 0:00 /usr/sbin/ntpdate -s -w 172.24.239.41root 148 1 0 10:28:48 ? 0:00 /usr/lib/nfs/lockdroot 617 1 0 10:29:23 console 0:00 /usr/lib/saf/ttymon -g -h -p va-hoover console login: -T sun -d /dev/console -root 237 1 0 10:29:06 ? 0:00 /opt/TimesTen32/32/bin/timestendroot 116 1 0 10:28:36 ? 0:00 /usr/sbin/keyservroot 114 1 0 10:28:36 ? 0:00 /usr/sbin/rpcbindroot 616 1 0 10:29:23 ? 0:00 /usr/lib/saf/sac -t 300root 141 1 0 10:28:47 ? 0:00 /usr/sbin/inetd -sdaemon 146 1 0 10:28:48 ? 0:00 /usr/lib/nfs/statdroot 165 1 0 10:29:02 ? 0:11 /usr/lib/autofs/automountdroot 317 1 0 10:29:13 ? 0:00 /usr/sbin/rpc.bootparamdroot 169 1 0 10:29:02 ? 0:00 /usr/sbin/syslogdroot 173 1 0 10:29:02 ? 0:00 /sbin/sh /etc/rc2.d/S74xntpd startroot 2867 141 0 10:05:23 ? 0:00 in.telnetdroot 182 1 0 10:29:03 ? 0:00 /usr/sbin/cronroot 198 1 0 10:29:03 ? 0:00 /usr/lib/lpschedroot 227 1 0 10:29:05 ? 0:00 /usr/lib/utmpdroot 217 1 0 10:29:04 ? 0:00 /usr/lib/power/powerdroot 618 1 0 10:29:23 ? 0:00 /opt/CiscoMGC/bin/critagt -droot 235 1 0 10:29:05 ? 0:00 /usr/lib/sendmail -bd -q15mroot 238 237 0 10:29:06 ? 0:00 /opt/TimesTen32/32/bin/timestensubd -id 0root 239 237 0 10:29:06 ? 0:00 /opt/TimesTen32/32/bin/timestensubd -id 1root 240 237 0 10:29:06 ? 0:00 /opt/TimesTen32/32/bin/timestensubd -id 2root 241 237 0 10:29:06 ? 0:00 /opt/TimesTen32/32/bin/timestensubd -id 3root 242 237 0 10:29:06 ? 0:00 /opt/TimesTen32/32/bin/timestensubd -id 4root 243 237 0 10:29:06 ? 0:00 /opt/TimesTen32/32/bin/timestensubd -id 5root 244 237 0 10:29:06 ? 0:00 /opt/TimesTen32/32/bin/timestensubd -id 6root 245 237 0 10:29:06 ? 0:00 /opt/TimesTen32/32/bin/timestensubd -id 7root 290 1 0 10:29:12 ? 0:00 /usr/sbin/voldroot 620 616 0 10:29:23 ? 0:00 /usr/lib/saf/ttymonroot 315 1 0 10:29:13 ? 0:01 /usr/sbin/in.rarpd -aroot 621 618 0 10:29:23 ? 0:05 /opt/CiscoMGC/bin/snmpdm -tcplocal -droot 622 618 0 10:29:24 ? 0:00 /opt/CiscoMGC/bin/mib2agt -dmgcusr 610 1 0 10:29:18 ? 0:02 procMroot 623 618 0 10:29:24 ? 0:00 /opt/CiscoMGC/bin/hostagtroot 624 618 0 10:29:24 ? 0:01 /opt/CiscoMGC/bin/fsagtmgcusr 774 610 0 10:31:18 ? 0:17 ../bin/mmdbd -X 30007mgcusr 626 610 0 10:29:24 ? 0:19 ../bin/LogServerd -X 30013root 627 610 0 10:29:24 ? 0:05 ../bin/almM -X 30002mgcusr 669 610 0 10:29:24 ? 0:08 ../bin/cdrDmpr -X 30005mgcusr 637 610 0 10:29:24 ? 6:11 ../bin/amDmpr -X 30004mgcusr 681 610 0 10:29:25 ? 0:11 ../bin/pom -X 30008mgcusr 690 610 0 10:29:42 ? 0:02 ../bin/replicator -X 3000d -C ../ etc/XECfgParm.dat -tmgcusr 670 610 0 10:29:24 ? 0:01 ../bin/cfgM -X 30001mgcusr 673 610 0 10:29:25 ? 0:43 ../bin/measMgr -X 30003mgcusr 689 610 0 10:29:42 ? 1:29 ../bin/engine -X 3000emgcusr 776 610 0 10:31:19 ? 0:01 ../bin/TCAP -X 30010root 691 610 0 10:29:42 ? 0:01 ../bin/mmSAgt -X 30009root 692 610 0 10:29:43 ? 0:04 ../bin/sagt -X 3000aroot 693 610 0 10:29:43 ? 0:01 ../bin/provSAgt -X 3000broot 775 610 1 10:31:18 ? 37:37 ../bin/ioChanMgr -X 3000fmgcusr 777 610 0 10:31:23 ? 0:12 ../bin/MGCP -X 30016mgcusr 778 610 0 10:31:23 ? 0:27 ../bin/ISDNL3 -X 3000cmgcusr 779 610 0 10:31:23 ? 0:26 ../bin/ISDNL3 -X 30011mgcusr 780 610 0 10:31:23 ? 0:30 ../bin/ISDNL3 -X 30014mgcusr 781 610 0 10:31:23 ? 0:01 ../bin/ISDNL3 -X 30015mgcusr 782 610 0 10:31:23 ? 0:42 ../bin/SS7 -X 30017root 783 610 0 10:31:23 ? 0:05 ../bin/foverd -X 30012mgcusr2 5458 5456 0 11:07:28 pts/0 0:00 -tcshroot 5456 141 0 11:07:28 ? 0:00 in.rlogindroot 367 1 0 14:21:02 ? 0:00 /usr/sbin/nscdmgcusr 2869 2867 0 10:05:23 pts/1 0:00 -cshroot 3101 2869 0 10:06:49 pts/1 0:00 ps -efThe response should indicate that there are between 60 and 100 processes active. If the response indicates that there are more than 100 active processes, you should contact the Cisco TAC for assistance. Refer to the "Obtaining Technical Assistance" section for more information on contacting the Cisco TAC.
Verifying the Number of Users
You should check the number of users on the Cisco MGC on a daily basis. To do this, log into the active Cisco MGC and enter the following UNIX command:
whoThe system returns a response similar to the following:
mgcusr pts/0 May 29 11:07 (mgcusr-u5.somecompany.com)mgcusr2 pts/1 May 30 10:05 (mgcusr2-u6.somecompany.com)Only known login IDs should be listed in the response. If the response indicates that there are unknown login IDs, or login sessions that have lasted a very long time, you should contact the Cisco TAC for assistance. Refer to the "Obtaining Technical Assistance" section for more information on contacting the Cisco TAC.
Verifying Available Memory on the Cisco SLTs
You should check the amount of available memory on your Cisco Signaling Link Terminals (SLTs) on a daily basis. To do this, perform the following steps:
Step 1
show memThe system returns a response similar to the following:
Head Total(b) Used(b) Free(b) Lowest(b) Largest(b)Processor 80CF71E0 16813600 7885028 8928572 8900652 8891892I/O 1D00000 19922944 6975904 12947040 12938256 12937500Ensure that the memory used is less than 90 percent of the total available memory. If this is the case, the procedure is complete. If the response indicates that the Cisco SLT has a small amount of available memory, you may need to add additional memory to the Cisco SLT to handle your system's call processing load.
Note
If this is the case, consider also performing this procedure during a less active call processing time, to determine an average amount of available memory.
Step 2
Periodic Maintenance Procedures
This section contains procedures that are either performed on automatically, on a scheduled basis, by the system or should be performed by you on a regular basis to keep the Cisco MGC node operating smoothly. You should schedule the procedures that are performed manually as you see fit. These maintenance procedures include
•
•
•
•
Note
Automatic Disk Space Monitoring
The Cisco MGC software includes a script called disk monitor (diskmonitor.sh) that periodically checks the amount of disk space used within the configurable set of disk partitions. Disk monitor ensures that there is sufficient disk space available in each disk partition for the system to continue to operate at peak performance. To do this, disk monitor deletes (trims) the older log files in the /opt/CiscoMGC/var/log and /opt/CiscoMGC/var/spool directories until the disk space usage is within the specified threshold (set using the XECfgParm.dat parameter, diskmonitor.Threshold).
The disk monitor can also track the number of configurations stored in the configuration library (which is found in the /opt/CiscoMGC/etc/CONFIB_LIB directory) and trim the older configurations when the number of configurations exceeds the maximum value you have set in the associated XECfgpParm.dat disk monitor parameter. The process manager runs the disk monitor script once every minute.
The process of administering the configuration library is handled automatically by the Cisco MGC software. The user sets the disk monitor parameter to establish the maximum number of configurations allowed in the configuration library, and the system will trim the older configurations as necessary.
Disk monitor is controlled using the following parameters in the XECfgParms.dat file:
•
•
•
•
•
•
As of Release 7.4(11), disk monitor performs the following steps in its inspection of disk utilization levels:
1.
a.
b.
c.
2.
a.
b.
c.
d.
If any disk partition exceeds the configurable usage threshold, the Cisco MGC generates a DISK alarm (a major alarm), a warning of a disk partition overrun, and a warning of insufficient disk space. Refer to the "DISK" section for information about the corrective actions required to resolve a DISK alarm.
Some other files, such as call trace files, take up large amounts of disk space and are not trimmed by disk monitor. You may have to periodically delete call trace files. Call trace files are created when you perform call traces as part of troubleshooting a problem. These files can be rather large, and leaving them on your disk could cause problems. For more information about deleting call trace files, refer to the "Deleting Unnecessary Files to Increase Available Disk Space" section.
Caution
Configuring Disk Monitor
Configuration of the disk monitor can only be done while the Cisco MGC software is turned off. For this reason, disk monitor is typically configured only during the initial installation. For more information on configuring the disk monitor during initial installation, refer to the XECfgParms.dat section of the Cisco Media Gateway Controller Software Release 7 Installation and Configuration Guide.
You can perform the configuration after initial installation. To do this, perform the following steps:
Caution
If your system uses a single Cisco MGC in a simplex configuration, performing this procedure causes you to drop all calls.
Step 1
If any alarms are pending, you can determine the appropriate courses of action by searching for the corrective actions for those alarms in the "Alarm Troubleshooting Procedures" section. If the alarms are not in that section, corrective action is not required. More information on those alarms can be found in the Cisco Media Gateway Controller Software Release 7 Messages Reference Guide.
Step 2
Step 3
•
•
Note
•
•
•
•
Caution
Note
Automatic System Log Rotation
As the system operates, the Cisco MGC software creates the system logs that are stored in a file stored in the /opt/CiscoMGC/var/log directory. The name of the system log file is set by the XECfgParm.dat file parameter, logFileNamePrefix (the default value is platform). The Cisco MGC software stops writing to the current system log file, archives the contents of that file, and commences writing to a new system log file. This process is referred to as log rotation.
Log rotation occurs as a result of one of the following conditions:
•
•
•
•
When the system rotates the system log file, the current system log file is archived and a new system log file is opened. The archived log file is stored in the $BASEDIR/var/spool directory. Once the Cisco MGC software is up and running, the log server takes over the actual file rotation responsibility of renaming the active file to a historical file with a new file name with the following format: logFileNamePrefix_yyyymmddhhmmss.log, where the time stamp indicates the date/time from the system at the time of rotation.
Rotating System Logs Manually
You can also run the log rotation script manually to force the current system log file to be archived. To do this, log into the active Cisco MGC as root, and enter the following UNIX command:
/opt/CiscoMGC/bin/log_rotate.shThe system creates a new current system log file and archived log file, as described in the "Automatic System Log Rotation" section.
Creating a Disaster Recovery Plan
You should formulate a disaster recovery plan for your Cisco MGC node to ensure that your system can be restored to service quickly after it has been taken out-of-service by a natural or man-made disaster. A key element in your disaster recovery plan should be ensuring that regular backups of your system's software are performed. Refer to the "Backing Up System Software" section for more information about backup operations. We also recommend that the backup data for your system be stored in a secure location, in a site separate from the equipment, to ensure that they are not affected by the same disaster.
For information on recovering from a natural or man-made disaster, refer to the "Recovering from Cisco MGC Host(s) Failure" section.
Backing Up System Software
You should perform regularly scheduled system software backups on both the active and standby
Cisco MGCs to protect critical system data such as configuration files, which are irreplaceable if lost. If a catastrophic failure occurs, it is much easier to restore system information from backup data than to recreate it. Furthermore, such a failure could cause critical configuration information to be lost if it has not been backed up. We recommend that you create a backup schedule, ensuring that small or incremental backups are performed daily, and a large or full backup once a week.
Note
There are two backup methods available for the Cisco MGC software, one for software releases up to 7.4(10), and another for software releases from 7.4(11) and up. These backup methods are described in the following sections:
•
•
Backup Procedures for Cisco MGC Software up to Release 7.4(10)
This backup method uses a script to backup the configuration data for the Cisco MGC software on to either a local tape drive or on to a remote machine. This script also allows you to perform full or partial backups. Backup of the Main Memory Database (MMDB) is performed by a separate script. These scripts do not enable you to schedule automatic backup times. You must perform these backups manually.
Note
The following sections provide the backup procedures:
•
•
•
•
Note
Storing a Full Backup Operation on a Local Tape
Use this procedure to store the results of a full backup operation (everything under the base directory) to a tape inserted in the local tape drive. To do this, complete the following steps:
Step 1
For example, enter the following command to change to the /opt/CiscoMGC/local directory:
cd /opt/CiscoMGC/localStep 2
Step 3
./backup.shThe system returns a response similar to the following:
MGC backup utility-----------------------------Destination currently set to Local tape (/dev/rmt/0h)Enter:<N> set destination to remote NFS server<L> set destination to Local tape (/dev/rmt/0h)<F> for Full (everything you have)<P> for Partial (changable part of the system)<Q> to quitSelect backup mode:Step 4
a ./ 0 tape blocksa ./var/ 0 tape blocksa ./var/log/ 0 tape blocksa ./var/log/platform.log 1 tape blocksa ./var/log/mml.log 1 tape blocksa ./var/spool/ 0 tape blocksa ./var/trace/ 0 tape blocksa ./var/audit_cron.log 1 tape blocks...#Step 5
Storing a Partial Backup Operation on a Local Tape
Use this procedure to store a partial backup operation (the contents of the etc, local, var, and dialPlan subdirectories under the MGC base directory) to a tape inserted in a local tape drive. To do this, complete the following steps:
Step 1
For example, enter the following command to change to the /opt/CiscoMGC/local directory:
cd /opt/CiscoMGC/localStep 2
Step 3
./backup.shThe system returns a response similar to the following:
MGC backup utility-----------------------------Destination currently set to Local tape (/dev/rmt/0h)Enter:<N> set destination to remote NFS server<L> set destination to Local tape (/dev/rmt/0h)<F> for Full (everything you have)<P> for Partial (changable part of the system)<Q> to quitSelect backup mode:Step 4
a ./ 0 tape blocksa ./var/ 0 tape blocksa ./var/log/ 0 tape blocksa ./var/log/platform.log 1 tape blocksLa ./var/log/mml.log 1 tape blocksa ./var/spool/ 0 tape blocksa ./var/trace/ 0 tape blocksa ./var/audit_cron.log 1 tape blocks...#Step 5
Storing a Full Backup Operation on a Remote Machine
Use this procedure to store a full backup operation (everything under the MGC software base directory) to an NFS mountable directory on a remote machine. The remote machine must be set up with an NFS mountable directory that can be written to by the machine being backed up. The NFS setup of the remote machine is beyond the scope of this procedure.
Note
To back up the entire Cisco MGC software directory to a remote machine, complete the following steps:
Step 1
For example, enter the following command to change to the /opt/CiscoMGC/local directory:
cd /opt/CiscoMGC/localStep 2
Step 3
./backup.shThe system returns a response similar to the following:
MGC backup utility-----------------------------Destination currently set to Local tape (/dev/rmt/0h)Enter:<N> set destination to remote NFS server<L> set destination to Local tape (/dev/rmt/0h)<F> for Full (everything you have)<P> for Partial (changable part of the system)<Q> to quitSelect backup mode:Step 4
Step 5
Enter server name: remote_hostnameWhere: remote_hostname—Name of your desired remote server.
The system then prompts you for the associated directory name on your remote server.
Step 6
Enter remote directory : remote_directoryWhere: remote_directory—Name of the associated directory on your remote server.
The system then prompts you to select a backup mode.
Step 7
a ./ 0 tape blocksa ./var/ 0 tape blocksa ./var/log/ 0 tape blocks...backup to va-panthers:/backup/va-blade20000317105337.tar complete#The filename on the remote NFS server is the host name of the machine with the date in YYYYMMDDHHMMSS format and ".tar" appended.
Storing a Partial Backup Operation on a Remote Machine
Use this procedure to store a partial backup operation (the contents of the etc, local, var, and dialPlan subdirectories under the MGC base directory) to an NFS mountable directory on a remote machine. The remote machine must be set up with an NFS mountable directory that can be written to by the machine being backed up. The NFS setup of the remote machine is beyond the scope of this procedure.
Note
To back up a portion of the Cisco MGC software directory to a remote machine, complete the following steps:
Step 1
For example, enter the following command to change to the /opt/CiscoMGC/local directory:
cd /opt/CiscoMGC/localStep 2
Step 3
./backup.shThe system returns a response similar to the following:
MGC backup utility-----------------------------Destination currently set to Local tape (/dev/rmt/0h)Enter:<N> set destination to remote NFS server<L> set destination to Local tape (/dev/rmt/0h)<F> for Full (everything you have)<P> for Partial (changable part of the system)<Q> to quitSelect backup mode:Step 4
Step 5
Enter server name: remote_hostnameWhere: remote_hostname—Name of your desired remote server.
The system then prompts you for the associated directory name on your remote server.
Step 6
Enter remote directory : remote_directoryWhere: remote_directory—Name of the associated directory on your remote server.
The system then prompts you to select a backup mode.
Step 7
Select backup mode: Pa ./ 0 tape blocksa ./var/ 0 tape blocksa ./var/log/ 0 tape blocks...backup to va-panthers:/backup/va-blade20000317105337P.tar complete#The filename on the remote NFS server is the host name of the machine with the date in YYYYMMDDHHMMSS format and "P.tar" appended.
Performing a Backup Operation on the Main Memory Database
Use this procedure to store your dial plan data, which is stored in the MMDB, in a single file.
Note
Step 1
For example, enter the following UNIX command to change to the /opt/CiscoMGC/local directory:
cd /opt/CiscoMGC/localStep 2
./backupDb.sh filenameWhere filename is the name of the database backup file.
For example, to backup the contents of the MMDB to a file called dplan, you would enter the following command:
./backupDb.sh dplanThe system returns a response similar to the following:
Exporting database contents for DSN=howdydb into dplanThe Backup process is being initiated for the datastore howdydbFiles for /opt/TimesTen32/datastore/howdydb are being backed up onto standard outputBackup Complete
Backup Procedures for Cisco MGC Software from Release 7.4(11) and up
This backup method uses a script to backup the configuration data for the Cisco MGC software, select UNIX administrative files, and the Main Memory Database (MMDB). This script only performs full backups. This script enables you to perform manual backups, schedule and administer automatic backups, and view a history of the last 30 backup operations performed.
Note
Note
Note
The following sections provide the backup procedures:
•
•
•
•
•
Performing a Manual Backup Operation
To perform a manual backup operation, enter the following UNIX command on the Cisco MGC:
mgcbackup -d path [-r retries -t retry_time]Where:
•
Note
Note
•
Note
Cisco MGC.
•
For example, to perform a manual backup operation where the backup file is saved to a directory path called /dev/rmt/h0, with a maximum of three attempts, each 60 seconds apart, you would enter the following UNIX command:
mgcbackup -d /dev/rmt/h0 -r 3 -t 60The backup file is stored in the specified directory path in the following format:
mgc_hostname_yyyymmdd_hhmmss_backupWhere:
•
•
•
Scheduling an Automatic Backup Operation
To schedule an automatic backup operation, perform the following steps:
Note
Step 1
mgcbackup -sThe system returns a response similar to the following:
Backup Schedule Menu--------------------1. Add a scheduled backup2. Delete a scheduled backup3. List scheduled backups4. ExitSelection:Step 2
The system returns a response similar to the following:
Add a Scheduled Backup----------------------Enter the name of the backup:Step 3
Note
After you enter the name of your automatic backup, the system returns a response similar to the following:
Enter the directory to place the backup file:Step 4
Note
Note
After you enter your directory path, the system returns a response similar to the following:
Enter the number of retries (default=0):Step 5
Note
Note
After you enter the number of retries, the system returns a response similar to the following:
Enter the time between retries (default=30 seconds):Step 6
Cisco MGC.
Note
After you enter the time between attempts, the system returns a response similar to the following:
Enter the day of the week (default=everyday):Step 7
•
•
•
•
•
•
•
•
•
•
After you enter your day(s) of the week setting, the system returns a response similar to the following:
Enter the time (HH:MM):Step 8
Note
Note
After you enter your time setting, the system returns a response similar to the following:
Press enter to continue:Step 9
When the automatic backup operation is performed, the backup file is stored in the specified directory path in the following format:
mgc_hostname_yyyymmdd_hhmmss_backup.tarWhere:
•
•
•
Listing Scheduled Automatic Backup Operations
To list the scheduled automatic backup operations, perform the following steps:
Step 1
mgcbackup -sThe system returns a response similar to the following:
Backup Schedule Menu--------------------1. Add a scheduled backup2. Delete a scheduled backup3. List scheduled backups4. ExitSelection:Step 2
The system returns a response similar to the following:
Scheduled Backups-----------------Name Retries Timeout Day Time DirectoryBack1 5 60 everyday 12:00 /var/ciscoMybackup 0 30 weekdays 04:00 /var/ciscoPress enter to continue:Step 3
Removing an Automatic Backup Operation from the Schedule
To remove an automatic backup operation from the schedule, perform the following steps:
Step 1
mgcbackup -sThe system returns a response similar to the following:
Backup Schedule Menu--------------------1. Add a scheduled backup2. Delete a scheduled backup3. List scheduled backups4. ExitSelection:Step 2
The system returns a response similar to the following:
Delete a Scheduled Backup-------------------------Enter the name of the backup:Step 3
The system returns a response similar to the following:
Press enter to continue:Step 4
Listing the Backup Operation History
To see a history of the last 30 backup operations, perform the following steps:
Step 1
mgcbackup -lThe system returns a response similar to the following:
Status FileSuccess /var/Cisco/mgc_venus_20011010_153003_backupSuccess /var/Cisco/mgc_venus_20011011_153003_backupSuccess /var/Cisco/mgc_venus_20011012_153003_backupPress enter to continue:
Note
Step 2
Regular Operations
This section contains procedures that you can perform on your Cisco MGC as needed. The regular operations are described in the following sections:
•
•
Managing MML Sessions
The operations you can use to manage an MML session are described in the following sections:
•
•
•
•
Displaying Previously Entered MML Commands
You can use the h MML command to redisplay an MML command or a series of MML commands, depending on the number or range that you enter. If you do not enter a number or range, the last MML command entered is displayed.
To redisplay the last MML command entered, log in to the active Cisco MGC, start an MML session, and enter the following command:
hThe system returns a response similar to the following:
Media Gateway Controller - MGC-01 2000-01-12 15:19:51M RTRV"RTRV-TC:ALL"/* command 1 */To redisplay a particular MML command that you entered, log in to the active Cisco MGC, start an MML session, and enter the following command:
h::numberWhere number is the number of the MML command you want to display. The last MML command you entered is equal to 1, the command you entered before that would be equal to 2, and so on.
For example, to redisplay the tenth most recently entered MML command, you would enter the following command:
h::10The system returns a response similar to the following:
Media Gateway Controller - MGC-01 2000-01-12 15:19:51M RTRV"RTRV-SC:ALL"/* command 10 */To redisplay a range of MML command that you entered, log in to the active Cisco MGC, start an MML session, and enter the following command:
h::start_num,end_numWhere:
•
•
For example, to redisplay all of the commands from the second to the fifth most recently entered MML commands, you would enter the following command:
h::2,5The system returns a response similar to the following:
Media Gateway Controller - MGC-01 2000-01-12 15:19:51M RTRV"RTRV-SC:ALL"/* command 5 */"RTRV-SOFTW:ALL"/* command 4 */"RTRV-TC:ALL"/* command 3 */"STP-AUD"/* command 2 */Displaying Information About MML Commands
You can use the help MML command to display information on all MML commands or detailed information on individual commands. To display information on a specific MML command, log in to the active Cisco MGC, start an MML session, and enter the following command:
help:command_nameWhere command_name is the name of the MML command for which you want information.
For example, if you wanted information on the set-log MML command, you would enter the following command:
help:set-logThe system would return a response similar to the following:
Media Gateway Controller - MGC-03 2000-03-20 10:04:28M RTRVSET-LOG -- Set Logging Levels-----------------------------Purpose: This MML command is used to set the logging level of aprocess or all processes.Format: set-log:<proc>:<log level>set-log:all:<log level>Input * proc -- The various actively and passively monitoredDescription: processes running on the MGC. Use the RTRV-SOFTW:ALLcommand to display all processes.* log level -- Sets the logging level for the specifiedprocess. Logging levels are as follows:- CRIT -- Critical level messages.- DEBUG -- Debug-level messages (lowest level).- ERR -- Error condition messages.- INFO -- Informational messages.- WARN -- Warning condition messages.- TRACE -- Trace messages.Example: The MML command shown in the following example retrievesthe logging level of the ENG-01 process:mml> RTRV-LOG:ENG-01Media Gateway Controller - MGC-01 2000-01-16 09:38:03M RTRV"ENG-01:DEBUG";Comments: This command was introduced in Release 7.4. Forinformation concerning backward compatibility, use theHELP:CHG-LOG command.Note: DSKM-01, the disk monitor process, does not makeuse of log levels and therefore does not acceptlog-level change requests.To display information on all of the MML commands, log in to the active Cisco MGC, start an MML session, and enter the following command:
helpThe system returns a response similar to the following:
MGC-01 - Media Gateway Controller 2001-06-12 14:37:34M RTRVAvailable commands (in alphabetical order):ack-alm:<comp>:"<alm cat>" Acknowledges an alarm category on acomponentblk-cic:<ptcode>:CIC=<number>[,RNG=<slaves>]Blocks a circuit or a circuit rangechg-dpl::CUSTGRPID="<customer group ID>"Reloads a dialing planchg-log:<proc>:<log level> This command has been replaced byset-log. Please refer to help onset-log for further informationclr-alm:<comp>:"<alm cat>" Clears an alarm category on acomponentclr-meas:<comp>:"<meas cat>" Resets a measurement category on acomponentclr-tcap-trans::T=<number> Clears all TCAP transactionsolder than value of T in secondsdiaglog:<file name>:START|STOP Starts/stops diagnostics logh[::<number>[,<number>]] Displays a history of commands for aspecified backward number or range;the last command by defaulthelp[:<command name>] Displays the list of MML commands orthe help information on a specifiedcommandnuman-add:<comp>:custgrpid=<cust group ID>,<param name>=<param value>,...Adds an element to a dial plan tablenuman-dlt:<comp>:custgrpid=<cust group ID>Deletes an element from a dial plantablenuman-ed:<comp>:custgrpid=<cust group ID>,<param name>=<param value>,...Edits an element in a dial plan tablenuman-rtrv:<comp>:custgrpid=<cust group ID>Retrieves an element from a dial plantablenuman-rtrv:<comp>:custgrpid=<cust group ID>,"all"Retrieves all elements from a dial plantableprov-add:<comp>:name=<MML name>,<param name>=<param value>,...Adds the componentprov-cpy Commits provisioning dataprov-dlt:<comp>:name=<MML name> Deletes the componentprov-dply Deploys provisioning dataprov-ed:<comp>:name=<MML name>,<param name>=<param value>,...Modifies the component attributesprov-exp:<tid>:dirname="<export directory name>"Exports provisioning data to the givenexport directory nametid can be one of the following:allconfigtrunktrkgrpnumanroutingexport directory name can be anydirectory name, in double quotes,which will be created under thecust_specific directoryprov-rtrv:<comp>:name=<MML name> Retrieves the component attributesprov-rtrv:all Retrieves all the componentsprov-rtrv:rttrnkgrp:"all" Retrieves all route trunk groupinformationprov-rtrv:rttrnk:"all" Retrieves all route trunk informationprov-rtrv:rtlist:"all" Retrieves all route list informationprov-rtrv:session Retrieves provisioning sessioninformation if one existsprov-rtrv:variants Retrieves all variantsprov-sta::srcver=<version>,dstver=<version>Starts a provisioning sessionprov-stp Stops the current provisioningsessionprov-stp:<session name>:confirm Stops the specified provisioningsessionprov-sync Synchronizes provisioning dataprt-call:<sig path>|<trk grp>:[CIC=<number>|SPAN=<number>[BC=<number>]][,LOG=<logname>] [,EVT]Prints diagnostic information about anactive call into the log filequery-cic:<ptcode>:CIC=<number>[,RNG=<slaves>][,RSLV]Performs a circuit query for a circuitor a circuit range with an optionalRESOLVE parameterquit Ends the sessionr[::<number>] Repeats a previously entered commandwith a specified backward number;the last command by defaultreset-cic:<ptcode>:CIC=<number>[,RNG=<slaves>]Resets a circuit or a circuit rangertrv-admin-state:<target>:<param>Retrieves the administrative stateof the target;target can be a MGC or gateway ortrunk group or sigPath;param can be one of the followingcombinations:[span=number] or[span=number,]bc=number[,RNG=number]orcic=number[,RNG=number]rtrv-alms Displays all active alarmsrtrv-alms::CONT Displays all active alarms and listensfor alarm events until Ctrl-Crtrv-aud-gw:<sig path MGCP> Retrieves result of an auditing processof a gatewayrtrv-aud-gw:all Retrieves results of auditing processesof all gatewaysrtrv-cfg:<cfg table> Displays contents of a configurationtable where table can be:alarmCategories | components |componentTypes | measCategories |services | tablesrtrv-cic:<ptcode>:CIC=<number>[,RNG=<slaves>]Retrieves bearer channels of a pointcodertrv-ctr:<comp>:"<meas cat>" Retrieves a measurement of a componentrtrv-dest:<path> Retrieves state of a destination,<path> is one of the following:<eisuppath> | <faspath> | <ipfaspath> |<naspath> | <tcapippath> |<ptcode(destination only)>rtrv-dest:all Retrieves state of all destinationsrtrv-lnk-ctr:<C7 link/set> Retrieves all measurements of a link orlink setrtrv-lnk-ctr:all Retrieves all measurements of all linksrtrv-log:all Displays logging level of all processesrtrv-log:<proc> Displays logging level of a processrtrv-lset:<C7 link set> Displays state of a link setrtrv-lssn:all Displays state of local SSNrtrv-mml Displays all active MML sessionsrtrv-ne Displays attributes of the NetworkElementrtrv-ovld Displays overload level and number ofmessages in a queuertrv-rssn:all Displays state of remote SSNrtrv-rte:<ptcode> Retrieves all SS7 routes for a pointcodertrv-rte:all Retrieves SS7 routes for all pointcodesrtrv-sc:<c7iplnk>|<tdmlnk>|<iplnk> Displays attributes of a signalingchannelrtrv-sc:<lnkset> Displays attributes of a link setrtrv-sc:all Displays attributes of all signalingchannels and link setsrtrv-sc-trc Displays the names of all filescurrently open for the various tracesin progressrtrv-softw:<proc> Displays status of a process orprocess grouprtrv-softw:all Displays status of all known processesrtrv-sp-ctr:<ptcode> Retrieves all measurements of a pointcodertrv-sp-ctr:all Retrieves all measurements of all pointcodesrtrv-spc:<ptcode> Retrieves route set of a point codertrv-spc:all Retrieves route sets of all point codesrtrv-ss7-slt:<C7 link> Retrieves result of an MTP SLT test ona linkrtrv-ss7-srt:<ptcode>:LSET="<C7 link/set>"Retrieves result of an MTP SRT test ona point codertrv-tc:<sig path>&<sig path>... Displays state of bearers per signalingpath(s)rtrv-tc:all Displays state of all bearersrtrv-tc-held:<sig path>&<sig path>...Displays state of bearers per signalingpath(s) held by gatewayrtrv-tc-held:all Displays state of all bearers, held bygatewayrtrv-tcap-trans Displays number of active TCAPtransactionsset-admin-state:<target>:<param>,LOCK|UNLOCK|RESETSets the administrative state ofthe target;target can be a MGC or gateway ortrunk group or sigPath;param can be one of the followingcombinations:[span=number] or[span=number,]bc=number[,RNG=number]orcic=number[,RNG=number]Changes service state of an ASPset-dest-state:<path>:IS|OOSChanges service state of a destination,<path> is one of the following:<eisuppath> | <faspath> | <ipfaspath> |<naspath> | <tcapippath> |<ptcode(destination only)>set-lnk-state:<c7iplnk>|<tdmlnk (c7 only)>|<lnkset>:IS|OOS|FOOS|INH|UNHChanges service state of a link or alinksetset-log:<proc>:<log level> Sets logging level for process <proc>set-log:all:<log level> Sets logging level for all processes.set-log:<proc>:debug,confirm Sets debug logging level for <proc>logLevel can be:DEBUG | TRACE | INFO | WARN | ERR |CRITwhen setting to debug level, the confirmparameter is mandatoryset-lssn-state:<SSN>:IS|OOS Changes service state of a local SSNset-sc-state:<c7iplnk>|<tdmlnk>|<iplnk(non-NAS)>:IS|OOSChanges service state of a signaling channelset-spc-state:<ptcode>:IS|OOS...Changes service state of a point codesnd:ext:<string> Sends a message to an external processsnd:ext:"help" Displays a list of commands availablefor an external process (providedby external process, not MML)sta-aud Starts auditing processsta-aud-gw:<sig path MGCP> Starts auditing process of a gatewaysta-aud-gw:all Starts auditing processes of allgatewayssta-abn-trc:<sig path>|all:paramsStarts dumping diagnostic info forabnormally terminated calls on entireMGC or a specified signal path or apoint code ,optional params are:CONFIRM - confirms tracing over all orsignal path or point code(not needed when using span ortrunk - otherwise required)log="filename" output file name inthe ../var/trace directoryspan=x, where x is the span number ofinteresttrk=y, where y is the trunk numbertc=c, where c is the traffic channelof interestrng=b, where b is the range of spansprd=n, where n is the period inseconds that this trace needs to berun for (default is half minutes or30 seconds)sta-sc-trc:<sig path>|<trkgrp>:paramsStarts tracing on a signal path or apoint code or a trunk group,optional params are:CONFIRM - confirms tracing over asignal path or point code or trunkgroup (not needed when using span ortrunk - otherwise required)log="filename" output file name inthe ../var/trace directoryspan=x, where x is the span number ofinteresttrk=y, where y is the trunk numbertc=c, where c is the traffic channelof interestrng=b, where b is the range of spansprd=n, where n is the period inseconds that this trace needs to berun for (default is 30 minutes or1800 seconds)sta-softw:<proc> Starts a process or process groupsta-ss7-slt:<C7 link> Starts an MTP SLT test on a linksta-ss7-srt:<ptcode>:LSET="<C7 link/set>"Starts an MTP SRT test on a point codesta-tcap-trc Starts TCAP tracingstp-abn-trc:<sig path>|<trkgrp> Stops abnormal tracing on a signal pathstp-abn-trc:all Stops abnormal tracing on all signal pathsstp-aud Stops auditing processstp-call:<target>:<param> Stops call(s) in progress for the giventarget;target can be a MGC or gateway ortrunk group or sigPath;param can be one of the followingcombinations:[span=number,]confirm or[span=number,]bc=number,[RNG=number,]confirm orcic=number,[RNG=number,]confirmstp-sc-trc:<sig path>|<trkgrp> Stops tracing on a signal path or trunkgroupstp-sc-trc:all Stops tracing on all signal pathsstp-softw:<proc>:[kill] Stops a process or all processes in agroupstp-softw:all:[kill] Shuts down the platform andapplications except Process Managerstp-tcap-trc Stops TCAP tracingsw-over::CONFIRM Forces a switchover to a stand-byplatformtst-cot:<ptcode>:CIC=<number> Performs a COT test on a circuitunblk-cic:<ptcode>:CIC=<number>[,RNG=<slaves>]Unblocks a circuit or a circuit rangevld-cic:<ptcode>:CIC=<number> Performs a circuit validationReentering Previously Entered MML Commands
You can use the r MML command reenter an MML command, either a specific MML command or the last MML command you entered.
To reenter the last MML command entered, log in to the active Cisco MGC, start an MML session, and enter the following command:
rThe system returns a response appropriate to the previously entered command. For example, if the previously entered command was rtrv-spc:all, a response similar to the following would be returned:
MGC-01 - Media Gateway Controller 2001-06-08 10:20:38M RTRV"dpc1:DPC=244.001.040,DNW=2:OPC=244.001.004:IS""dpc2:DPC=244.001.041,DNW=2:OPC=244.001.004:IS""dpc4:DPC=244.001.044,DNW=2:OPC=244.001.004:AOOS""dpc5:DPC=244.001.045,DNW=2:OPC=244.001.004:AOOS""dpc8:DPC=244.018.030,DNW=2:OPC=244.001.004:AOOS""dpc9:DPC=244.018.031,DNW=2:OPC=244.001.004:AOOS""dpc10:DPC=244.018.032,DNW=2:OPC=244.001.004:AOOS""dpc11:DPC=244.018.033,DNW=2:OPC=244.001.004:AOOS"To reenter a particular MML command that you entered, log in to the active Cisco MGC, start an MML session, and enter the following command:
r::numberWhere number is the number of the MML command you want to reenter. The last MML command you entered is equal to 1, the command you entered before that would be equal to 2, and so on.
For example, to reenter the tenth most recently entered MML command, you would enter the following command:
r::10The system returns a response appropriate to the previously entered command.
Retrieving Active MML Sessions
To retrieve information on the active MML sessions, log in to the active Cisco MGC, start an MML session, and enter the following command:
rtrv-mmlThe system returns a response similar to the following:
Media Gateway Controller - MGC-01 2000-01-12 15:19:51M RTRVmml5:guestThe response lists the session number (mml5 in the example) and the user ID of the session owner (guest in the example).
Ending an MML Session
You can use the quit MML command to end your current MML session.
Managing Signaling Channels
The operations you can use to manage an MML session are described in the following sections:
•
•
•
•
•
•
•
•
Retrieving Signaling Channel Attributes
You can retrieve attributes for an individual signaling channel or linkset, or for all signaling channels and linksets.
To retrieve the attributes for an individual signaling channel or linkset, log in to the active Cisco MGC, start an MML session, and enter the following command:
rtrv-sc:sig_channel | linksetWhere:
•
•
For example, to retrieve attributes for a signaling channel called iplink1, enter the following command:
rtrv-sc:iplink1The system returns a response similar to the following:
Media Gateway Controller 2000-03-26 20:26:18M RTRV"iplink1:nassvc1,LID=0:IS"To retrieve attributes for all of the signaling channels and linksets, log in to the active Cisco MGC, start an MML session, and enter the following command:
rtrv-sc:allThe system returns a response similar to the following, which shows the signaling links to and from the Cisco MGCs and the associated media gateways (different SS7 solutions might use different media gateways).
Media Gateway Controller 2000-03-26 19:23:23M RTRV"iplink1:nassvc1,LID=0:IS" /* IP Link 1 for NAS 1 */"iplink2:nassvc2,LID=0:IS" /* IP Link 1 for NAS 2 */"iplink3:nassvc3,LID=0:IS" /* IP Link 1 for NAS 3 */"iplink4:nassvc1,LID=0:IS" /* IP Link 2 for NAS 1 */"iplink5:nassvc2,LID=0:IS" /* IP Link 2 for NAS 2 */"iplink6:nassvc3,LID=0:IS" /* IP Link 2 for NAS 3 */"c7iplink1:ls01,LID=0:IS" /* Link 1 in Linkset 1 */"c7iplink2:ls01,LID=1:IS" /* Link 2 in Linkset 1 */"c7iplink3:ls02,LID=0:IS" /* Link 1 in Linkset 2 */"c7iplink4:ls02,LID=1:IS" /* Link 2 in Linkset 2 */
Note
Understanding Signaling Channels
Signaling channels are bidirectional transport mechanisms for call-control signaling between the Cisco MGC and other devices, such as the Cisco SLTs, that provide necessary delivery reliability for higher-layer protocols. All types of signaling channels have basically the same functionality and are managed similarly. Unless otherwise noted, all commands, counters, and alarms apply to all types of signaling channels.
The basic types of signaling channels on the Cisco MGC are
•
•
•
•
•
The following sections describe the information returned by the system when you enter the rtrv-sc MML command.
Signaling channel or linkset name
The first field lists the MML name of the signaling channel or linkset.
Parent Name
The second field lists the MML name of the parent of the signaling channel or linkset.
Link ID
The LID field lists the associated link identification number.
Subsystem Number
The SSN field lists the associated subsystem number.
Primary Service State
The PST field shows the current primary service state of the destination. Table 3-8 lists the valid primary service state values:
Secondary Service State
The SST field shows the current secondary service state of the specified signaling channel. The valid states are listed below:
•
•
•
•
•
•
•
•
•
•
•
•
•
•
•
•
•
•
•
•
•
•
•
•
Retrieving Signaling Destination Service States
Retrieving state information about all external point codes and signal paths is a task that performed daily. For more information about this and other daily task refer to the "Daily Tasks" section.
To retrieve information about a specific DPC or non-ISUP signaling service, log in to the active
Cisco MGC, start an MML session, and enter the following command:rtrv-dest: point_code | sig_srvWhere:
•
•
The system returns a response similar to the following:
MGC-01 - Media Gateway Controller 2001-06-12 14:53:03M RTRV"dpc1:PKG=SS7-ANSI,ASSOC=SWITCHED,PST=IS,SST=RCNG"For more information on the response to this command, refer to the "Understanding the Destination State Information" section.
If the destination is in a primary service state other than IS, attempt to bring it into service, as described in the "Setting the Service State of a Destination" section
Note
Retrieving the Service State of a Linkset
To retrieve the service state of a linkset, log in to the active Cisco MGC, start an MML session, and enter the following command:
rtrv-lset:linksetWhere linkset is the MML name of the desired linkset.
For example, to retrieve the service state of a linkset called ls1, you would enter the following command:
rtrv-lset:ls1The system returns a response similar to the following:
Media Gateway Controller - MGC-01 2000-01-12 15:19:51M RTRVISThe valid service states for a linkset are identical to the primary service state listings for signaling channels, as found in the "Understanding Signaling Channels" section. If the linkset is in any other state than IS, attempt to bring the linkset into service, as described in the "Setting the Service State of a Link or Linkset" section.
Retrieving the State of Point Codes
To retrieve the current state for the route set for one point code, log in to the active Cisco MGC, start an MML session, and enter the following command:
rtrv-spc:point_codeWhere point_code is the MML name for the associated point code.
The system returns a response similar to the following:
MGC-01 - Media Gateway Controller 2001-06-12 16:10:21M RTRV"dpc1:DPC=244.001.040,DNW=2:OPC=244.001.004:AOOS"To retrieve the current state for the route sets for all point codes, log in to the active Cisco MGC, start an MML session, and enter the following command:
rtrv-spc:allThe system returns a response similar to the following:
MGC-01 - Media Gateway Controller 2001-06-12 16:04:59M RTRV"dpc1:DPC=244.001.040,DNW=2:OPC=244.001.004:IS""dpc2:DPC=244.001.041,DNW=2:OPC=244.001.004:IS""dpc4:DPC=244.001.044,DNW=2:OPC=244.001.004:IS""dpc5:DPC=244.001.045,DNW=2:OPC=244.001.004:IS""dpc8:DPC=244.018.030,DNW=2:OPC=244.001.004:IS""dpc9:DPC=244.018.031,DNW=2:OPC=244.001.004:IS""dpc10:DPC=244.018.032,DNW=2:OPC=244.001.004:IS""dpc11:DPC=244.018.033,DNW=2:OPC=244.001.004:IS"The valid service states for a linkset are identical to the primary service state listings for signaling channels, as found in the "Understanding Signaling Channels" section. If the linkset is in any other state than IS, attempt to bring the linkset into service, as described in the "Setting the Service State of a Signaling Point Code" section.
Retrieving the State of SS7 Routes
To retrieve the current state for an SS7 route, log in to the active Cisco MGC, start an MML session, and enter the following command:
rtrv-rte:point_codeWhere point_code is the MML name for the associated point code.
The system returns a response similar to the following:
MGC-01 - Media Gateway Controller 2001-06-12 16:17:55M RTRV"dpc1:linkset1,APC=244.001.040,PRIO=1,PST=AOOS,SST=NA""dpc1:UNK,APC=000.000.000,PRIO=2,PST=IS,SST=NA"To retrieve the current state for all of SS7 routes, log in to the active Cisco MGC, start an MML session, and enter the following command:
rtrv-rte:allThe system returns a response similar to the following:
MGC-01 - Media Gateway Controller 2001-06-12 16:15:51M RTRV"dpc1:linkset1,APC=244.001.040,PRIO=1,PST=AOOS,SST=NA""dpc1:UNK,APC=000.000.000,PRIO=2,PST=IS,SST=NA""dpc2:linkset2,APC=244.001.041,PRIO=1,PST=AOOS,SST=NA""dpc2:UNK,APC=000.000.000,PRIO=3,PST=IS,SST=NA""dpc4:linkset4,APC=244.001.044,PRIO=1,PST=AOOS,SST=NA""dpc4:UNK,APC=000.000.000,PRIO=4,PST=AOOS,SST=NA""dpc5:linkset5,APC=244.001.045,PRIO=1,PST=AOOS,SST=NA""dpc5:UNK,APC=000.000.000,PRIO=5,PST=AOOS,SST=NA""dpc8:linkset8,APC=244.018.030,PRIO=1,PST=AOOS,SST=NA""dpc8:UNK,APC=000.000.000,PRIO=6,PST=AOOS,SST=NA""dpc9:linkset9,APC=244.018.031,PRIO=1,PST=AOOS,SST=NA""dpc9:UNK,APC=000.000.000,PRIO=7,PST=AOOS,SST=NA""dpc10:linkset10,APC=244.018.032,PRIO=1,PST=AOOS,SST=NA""dpc10:UNK,APC=000.000.000,PRIO=8,PST=AOOS,SST=NA"The valid service states for a linkset are identical to the primary service state listings for signaling channels, as found in the "Understanding Signaling Channels" section. If the linkset is in any other state than IS, attempt to bring the linkset into service, as described in the "Setting the Service State of a Destination" section.
Retrieving the State of All Local Subsystem Numbers
To retrieve the state of all local subsystem number (SSNs), log in to the active Cisco MGC, start an MML session, and enter the following command:
rtrv-lssn:allThe system returns a response similar to the following:
Media Gateway Controller - MGC-01 2000-01-12 15:19:51M RTRV"TCAP-01:SSN=1,PST=IS""TCAP-01:SSN=2,PST=OOS"The response indicates the name of the associated process, the SSN, and the state (either in-service or out-of-service). If any of the local SSNs are out of service, proceed to the "Setting the Service State of a Local Subsystem Number" section.
Retrieving the State of All Remote Subsystem Numbers
To retrieve the state of all remote SSNs, log in to the active Cisco MGC, start an MML session, and enter the following command:
rtrv-rssn:allThe system returns a response similar to the following:
Media Gateway Controller - MGC-01 2000-01-12 15:19:51M RTRV"stp1:PC=007.007.007,SSN=1,PST=OOS""stp2:PC=008.008.008,SSN=1,PST=OOS""stp3:PC=009.009.009,SSN=2,PST=OOS"The response indicates the name of the associated process, the SSN, and the state (either in-service or out-of-service). If any of the remote SSNs are out of service, proceed to the "SS7 Network Related Problems" section.
Retrieving TCAP Transactions
To retrieve the number of active transaction capabilities application part (TCAP) transactions, log in to the active Cisco MGC, start an MML session, and enter the following command:
rtrv-tcap-transThe system returns a response similar to the following:
Media Gateway Controller - MGC-01 2000-01-12 15:19:51M RTRV"TCAP-01:TRANS=0"Clearing TCAP Transactions
To clear all TCAP transactions that are older than a period you specify, log in to the active Cisco MGC, start an MML session, and enter the following command:
clr-tcap-trans::t=numberWhere number is the time period, in seconds, after which you want to clear TCAP transactions.
For example, to clear all TCAP transactions that are older than 60 seconds, you would enter the following command:
clr-tcap-trans::t=60Enabling Blocking/Unblocking Messages
You may want to modify the properties of an IP FAS signaling service to enable your system to send blocking (BLO) and unblocking (UBL) messages when bearer channels go IS and OOS, respectively. The process of modifying the properties of a signaling service is referred to as dynamic reconfiguration. For more information about dynamic reconfiguration, refer to the "Understanding Dynamic Reconfiguration" section.
Caution
Note
To enable your system to send BLO and UBL messages, perform the following steps:
Step 1
Step 2
prov-ed:ipfaspath:name="comp_name",PropagateSvcMsgBlock=trueWhere comp_name is the MML name for the IP FAS signaling service on which you are enabling BLO/UBL messages.
For example, to enable the sending of BLO/UBL messages on an IP FAS signaling service named ipfas1, you would enter the following command:
prov-ed:ipfaspath:name="ipfas1",PropagateSvcMsgBlock=trueStep 3
Enabling Group Service Reset Messages
You may want to modify the properties of an SS7 signaling service to enable your system to send SS7 group service reset (GSR) messages for all CICs during point code initialization, so that the Cisco MGC to synchronize its bearer channel blocking state with that of the end office. The process of modifying the properties of a signaling service is referred to as dynamic reconfiguration. For more information about dynamic reconfiguration, refer to the "Understanding Dynamic Reconfiguration" section.
Caution
Note
To enable the sending of GSR messages, perform the following steps:
Step 1
Step 2
prov-ed:ss7path:name="comp_name",GRSEnabled=trueWhere: comp_name—MML name for the SS7 signaling service on which you are enabling the sending of GRS messages.
For example, to enable the sending of GRS messages on an SS7 signaling service named ss7svc1, you would enter the following command:
prov-ed:ss7path:name="ss7svc1",GRSEnabled=trueStep 3
Managing Bearer Channels
The operations you can use to manage bearer channels are described in the following sections:
•
•
•
Verifying Proper Replication of Calls
Ensure that the standby Cisco MGC becomes fully operational and that the replication of calls in progress has been completed by performing the steps in the following procedure:
Caution
Step 1
rtrv-tc:allThe system returns a different set of responses, depending on which release of the MGC software you are running and the type of configuration you are using on the associated media gateway.
When the Cisco MGC software is used on a nailed network, the system returns a response similar to the following:
Media Gateway Controller - MGC-01 2000-04-05 08:26:36M RTRV"dpc1:CIC=1,PST=IS,CALL=IDLE,BLK=NONE""dpc1:CIC=2,PST=IS,CALL=IDLE,BLK=NONE""dpc1:CIC=3,PST=IS,CALL=IDLE,BLK=NONE""dpc1:CIC=4,PST=IS,CALL=IDLE,BLK=NONE""dpc1:CIC=5,PST=IS,CALL=IDLE,BLK=NONE""dpc1:CIC=6,PST=IS,CALL=IDLE,BLK=NONE""dpc1:CIC=7,PST=IS,CALL=IDLE,BLK=NONE""dpc1:CIC=8,PST=IS,CALL=IDLE,BLK=NONE""dpc1:CIC=9,PST=IS,CALL=IDLE,BLK=NONE"When the Cisco MGC software is used on a switched network, the system returns a response similar to the following:
Media Gateway Controller - MGC-04 2000-04-05 08:05:54M RTRV"dpc1:CIC=1,PST=IS,CALL=IDLE,GW_STAT=CXN_IS,BLK=NONE""dpc1:CIC=2,PST=IS,CALL=IDLE,GW_STAT=CXN_IS,BLK=NONE""dpc1:CIC=3,PST=IS,CALL=IDLE,GW_STAT=CXN_IS,BLK=NONE""dpc1:CIC=4,PST=IS,CALL=IDLE,GW_STAT=CXN_IS,BLK=NONE""dpc1:CIC=5,PST=IS,CALL=IDLE,GW_STAT=CXN_IS,BLK=NONE""dpc1:CIC=6,PST=IS,CALL=IDLE,GW_STAT=CXN_IS,BLK=NONE""dpc1:CIC=7,PST=IS,CALL=IDLE,GW_STAT=CXN_IS,BLK=NONE""dpc1:CIC=8,PST=IS,CALL=IDLE,GW_STAT=CXN_IS,BLK=NONE""dpc1:CIC=9,PST=IS,CALL=IDLE,GW_STAT=CXN_IS,BLK=NONE"
Note
Step 2
Step 3
Calls in progress should say CALL=IN for both systems.
If necessary, you can force the active Cisco MGC to do a maintenance switchover (see the "Performing a Manual Switchover" section) and repeat the above procedure for that system.
Retrieving the States of Bearers Held By a Media Gateway
You can retrieve the states of bearer channels being held by a media gateway. To retrieve the state of a group bearer channels associated with one or more signaling destination(s) that are being held by a media gateway, log in to the active Cisco MGC, start an MML session, and enter the following command:
rtrv-tc-held:sig_dest| &sign_dest...Where sig_dest is a logical signaling destination, such as an SS7 point code, FAS path, IP FAS path, or DPNSS path. You can display a complete list of configured components by performing the procedure in the "Retrieving component data" section.
When none of the group of bearer channels associated with the specified signaling destination(s) are being held by a media gateway, the system returns a response similar to the following:
MGC-01 - Media Gateway Controller 2001-06-12 16:28:39M RTRV"dpc1"/* No bearer channels in held state */When bearer channels associated with the specified signaling destination(s) are being held by a media gateway, the system returns a response similar to the following:
MGC-01 - Media Gateway Controller 2001-06-12 16:28:39M RTRV"dpc1:CIC=1,PST=IS,CALL=IDLE,GW_STAT=CXN_IS,BLK=NONE""dpc1:CIC=1,PST=IS,CALL=IDLE,GW_STAT=CXN_IS,BLK=NONE""dpc1:CIC=2,PST=IS,CALL=IDLE,GW_STAT=CXN_IS,BLK=NONE""dpc1:CIC=3,PST=IS,CALL=IDLE,GW_STAT=CXN_IS,BLK=NONE""dpc1:CIC=4,PST=IS,CALL=IDLE,GW_STAT=CXN_IS,BLK=NONE""dpc1:CIC=5,PST=IS,CALL=IDLE,GW_STAT=CXN_IS,BLK=NONE""dpc1:CIC=6,PST=IS,CALL=IDLE,GW_STAT=CXN_IS,BLK=NONE""dpc1:CIC=7,PST=IS,CALL=IDLE,GW_STAT=CXN_IS,BLK=NONE""dpc1:CIC=8,PST=IS,CALL=IDLE,GW_STAT=CXN_IS,BLK=NONE""dpc1:CIC=9,PST=IS,CALL=IDLE,GW_STAT=CXN_IS,BLK=NONE"To retrieve the state of all bearer channels held by a media gateway, log in to the active Cisco MGC, start an MML session, and enter the following command:
rtrv-tc-held:allWhen none of the bearer channels are being held by a media gateway, the system returns a response similar to the following:
Retrieving results. This could take a few moments...MGC-01 - Media Gateway Controller 2001-06-12 16:28:39M RTRV"opc"/* No bearer channels in held state */"dpc1"/* No bearer channels in held state */"dpc2"/* No bearer channels in held state */When bearer channels are being held by a media gateway, the system returns a response similar to the following:
MGC-01 - Media Gateway Controller 2001-06-12 16:28:39M RTRV"dpc1:CIC=1,PST=IS,CALL=IDLE,GW_STAT=CXN_IS,BLK=NONE""dpc1:CIC=1,PST=IS,CALL=IDLE,GW_STAT=CXN_IS,BLK=NONE""dpc1:CIC=2,PST=IS,CALL=IDLE,GW_STAT=CXN_IS,BLK=NONE""dpc1:CIC=3,PST=IS,CALL=IDLE,GW_STAT=CXN_IS,BLK=NONE""dpc1:CIC=4,PST=IS,CALL=IDLE,GW_STAT=CXN_IS,BLK=NONE""dpc1:CIC=5,PST=IS,CALL=IDLE,GW_STAT=CXN_IS,BLK=NONE""dpc1:CIC=6,PST=IS,CALL=IDLE,GW_STAT=CXN_IS,BLK=NONE""dpc1:CIC=7,PST=IS,CALL=IDLE,GW_STAT=CXN_IS,BLK=NONE""dpc1:CIC=8,PST=IS,CALL=IDLE,GW_STAT=CXN_IS,BLK=NONE""dpc1:CIC=9,PST=IS,CALL=IDLE,GW_STAT=CXN_IS,BLK=NONE""dpc2:CIC=10,PST=IS,CALL=IDLE,GW_STAT=CXN_IS,BLK=NONE""dpc2:CIC=11,PST=IS,CALL=IDLE,GW_STAT=CXN_IS,BLK=NONE""dpc2:CIC=12,PST=IS,CALL=IDLE,GW_STAT=CXN_IS,BLK=NONE""dpc2:CIC=13,PST=IS,CALL=IDLE,GW_STAT=CXN_IS,BLK=NONE""dpc2:CIC=14,PST=IS,CALL=IDLE,GW_STAT=CXN_IS,BLK=NONE""dpc2:CIC=15,PST=IS,CALL=IDLE,GW_STAT=CXN_IS,BLK=NONE""dpc2:CIC=16,PST=IS,CALL=IDLE,GW_STAT=CXN_IS,BLK=NONE""dpc2:CIC=17,PST=IS,CALL=IDLE,GW_STAT=CXN_IS,BLK=NONE""dpc2:CIC=18,PST=IS,CALL=IDLE,GW_STAT=CXN_IS,BLK=NONE"Blocking CICs
You may need to block a CIC or a range of CICs on your Cisco MGC. Blocking a single CIC causes a BLA message to be sent to the destination SSP. Blocking a range of CICs causes a CGB message to be sent to the destination SSP. The range option only can be used to block CICs within a given trunk (T1 or E1).
To block a single CIC, log in to your active Cisco MGC, start an MML session and enter the following command:
blk-cic:dest_pc:CIC=numberWhere:
•
•
For example, to block CIC number 1, which is associated with a DPC called dpc1, you would enter the following command:
blk-cic:dpc1:cic=1To block a range of CICs, log in to your active Cisco MGC, start an MML session, and enter the following command:
blk-cic:dest_pc:CIC=number,RNG=rangeWhere:
•
•
•
Note
For example, to block CIC number 1 through 20, which are associated with a DPC called dpc1, you would enter the following command:
blk-cic:dpc1:cic=1,rng=20To verify that the CIC(s) have been successfully blocked, retrieve the status of the affected CICs as described in the "Verifying CIC States" section. When you want to return the CIC(s) to service, you must unblock the CIC(s) as described in the "Unblocking CICs" section.
Retrieving the Administrative State
The administrative state refers to the state of CICs (on the Cisco MGC) and spans and bearer channels (on the associated media gateway). There are three possible states: locked, unlocked, and shutdown. You can use the rtrv-admin-state MML command to determine the administrative state of several objects in the Cisco SS7 solution environment, including the Cisco MGC, an associated MGCP media gateway, a trunk group, a signaling service, spans and bearer channels associated with a signaling service (for non-ISUP trunks), and CICs associated with a signaling service (for ISPU trunks).
When you retrieve the administrative state of a object that consists of groups of CICs or spans and bearer channels, you receive an inferred target state, based on the following criteria:
•
•
•
If you want to change the administrative state of a component, refer to the "Setting the Administrative State" section.
The following procedures describe how you can use the rtrv-admin-state MML command:
•
•
•
•
•
•
Retrieving the Administrative State of a Cisco MGC
To retrieve the administrative state of a Cisco MGC, log in to the active Cisco MGC, start an MML session, and enter the following command:
rtrv-admin-state:mgcWhere mgc is the MML name of the Cisco MGC host.
The system returns a response similar to the following:
Media Gateway Controller - MGC-03 2000-02-17 14:27:52M COMPLD"mgca:PST=UNLOCK,LOCK=0,UNLOCK=384,SHUTDOWN=0"If you want to change the administrative state of the Cisco MGC, refer to the "Setting the Administrative State of a Cisco MGC" section.
Retrieving the Administrative State of a Media Gateway
To retrieve the administrative state of an associated media gateway, log in to the active Cisco MGC, start an MML session, and enter the following command:
rtrv-admin-state:gatewayWhere gateway is the MML name of the associated media gateway.
Note
The system returns a response similar to the following:
Media Gateway Controller - MGC-03 2000-02-17 14:27:52M COMPLD"mgw1:PST=UNLOCK,LOCK=0,UNLOCK=384,SHUTDOWN=0"If you want to change the administrative state of the media gateway, refer to the "Setting the Administrative State of a Media Gateway" section.
Retrieving the Administrative State of a Trunk Group
To retrieve the administrative state of a trunk group, log in to the active Cisco MGC, start an MML session, and enter the following command:
rtrv-admin-state:trkgrpWhere trkgrp is the MML name of the trunk group.
Note
The system returns a response similar to the following:
Media Gateway Controller - MGC-03 2000-02-17 14:27:52M COMPLD"trunkgrp1:PST=UNLOCK,LOCK=0,UNLOCK=384,SHUTDOWN=0"If you want to change the administrative state of the trunk group, refer to the "Setting the Administrative State of a Trunk Group" section.
Retrieving the Administrative State of a Signaling Service
To retrieve the administrative state of a signaling service, log in to the active Cisco MGC, start an MML session, and enter the following command:
rtrv-admin-state:sig_srvWhere sig_srv is the MML name of the signaling service. The following signaling service types are valid for this command:
•
•
•
Cisco MGC over IP (that is, FE box<-sig/tdm->media gateway<-NI2/IP-> Cisco MGC).•
•
The system returns a response similar to the following:
Media Gateway Controller - MGC-03 2000-02-17 14:27:52M COMPLD"ss7svc1:PST=UNLOCK,LOCK=0,UNLOCK=384,SHUTDOWN=0"If you want to change the administrative state of the signaling service, refer to the "Setting the Administrative State of a Signaling Service" section.
Retrieving the Administrative State of Spans
To retrieve the administrative state of a single span, log in to the active Cisco MGC, start an MML session, and enter the following command:
rtrv-admin-state:sig_srv,span=xWhere:
•
–
–
–
Cisco MGC over IP (that is, FE box<-sig/tdm->media gateway<-NI2/IP-> Cisco MGC).–
–
•
For example, to determine the administrative state of span number 2 associated with a signaling service called ss7svc1, you would enter the following command:
rtrv-admin-state:ss7svc1,span=2The system returns a response similar to the following:
Media Gateway Controller - MGC-03 2000-02-17 14:27:52M COMPLD"ss7svc1:PST=UNLOCK,LOCK=0,UNLOCK=384,SHUTDOWN=0"To retrieve the administrative state of a bearer channel or a range of bearer channels in a span, log in to the active Cisco MGC, start an MML session, and enter the following command:
rtrv-admin-state:sig_srv,span=x,bc=y[,rng=range]Where:
•
–
–
–
Cisco MGC over IP (that is, FE box<-sig/tdm->media gateway<-NI2/IP-> Cisco MGC).–
–
•
•
•
For example, to determine the administrative state of bearer channels numbers 2 through 6, associated with a signaling service called ss7svc1, you would enter the following command:
rtrv-admin-state:ss7svc1,span=2,bc=2,rng=5The system returns a response similar to the following:
Media Gateway Controller - MGC-03 2000-02-17 14:27:52M COMPLD"ss7svc1:PST=UNLOCK,LOCK=0,UNLOCK=384,SHUTDOWN=0"If you want to change the administrative state of the spans, refer to the "Setting the Administrative State of Spans" section.
Retrieving the Administrative State of CICs
To retrieve the administrative state of a CIC or a range of CICs, log in to the active Cisco MGC, start an MML session, and enter the following command:
rtrv-admin-state:sig_srv,cic=number[,rng=range]Where:
•
–
–
–
Cisco MGC over IP (that is, FE box<-sig/tdm->media gateway<-NI2/IP-> Cisco MGC).–
–
•
•
For example, to determine the administrative state of CICs 2 through 11 associated with a signaling service called ss7svc1, you would enter the following command:
rtrv-admin-state:ss7svc1,cic=2,rng=9The system returns a response similar to the following:
Media Gateway Controller - MGC-03 2000-02-17 14:27:52M COMPLD"ss7svc1:PST=UNLOCK,LOCK=0,UNLOCK=384,SHUTDOWN=0"If you want to change the administrative state of the CICs, refer to the "Setting the Administrative State of CICs" section.
Provisioning your Cisco MGC
The operations you can use to provision your Cisco MGC are described in the following sections:
•
•
•
•
•
For more detailed information about provisioning your Cisco MGC, refer to the Cisco Media Gateway Controller Software Release 7 Provisioning Guide.
Starting a Provisioning Session
You may need to start a provisioning session as part of your system operations. To do this, log into the active Cisco MGC, start an MML session, and enter the following command:
prov-sta::srcver="curr_ver",dstver="mod_ver"Where:
•
–
–
Note
•
For example, to use a configuration version called ver1 as the basis for a version to be called ver2, you would enter the following command:
prov-sta::srcver="ver1",dstver="ver2"Once a provisioning session is underway, you may use the prov-add, prov-ed, or prov-dlt MML commands to add, modify, and delete components on your system. If you want to add components to your system, refer to the Cisco Media Gateway Controller Software Release 7 Provisioning Guide. If you want to modify or delete components on your system, refer to the "Invoking Dynamic Reconfiguration" section.
There are two ways to close your provisioning session: saving and activating your provisioning changes, as described in the "Saving and Activating your Provisioning Changes" section or ending your provisioning session without saving and activating your changes, as described in the "Ending a Provisioning Session Without Activating your Changes" section.
Saving and Activating your Provisioning Changes
When you have completed making provisioning changes in your session, you must enter a command to save and activate your changes. There are two different provisioning MML commands that do this: prov-cpy and prov-dply.
Caution
The prov-cpy MML command is used to save and activate your changes on the active Cisco MGC. This command is typically used to save and activate changes on a Cisco MGC in a simplex configuration. However, you can use the prov-cpy MML command on Cisco MGCs in high-availability or continuous-service configurations, to save and activate your changes on the active Cisco MGC. If you choose to do this, you should enter the prov-sync MML command immediately afterwards, to have your changes saved and activated on the standby Cisco MGC.
Note
Caution
Note
The prov-dply MML command is used to save and activate your changes on the active and standby
Cisco MGCs. This command is typically used to save and activate changes on Cisco MGCs in high-availability or continuous-service configurations. This command should not be used on a Cisco MGC in a simplex configuration.
Note
Ending a Provisioning Session Without Activating your Changes
You may find that you want to end a provisioning session without saving and activating the changes you have entered during your session. If this is the case, you can enter the prov-stp MML command. This command ends your current provisioning session and your changes are not entered.
Invoking Dynamic Reconfiguration
You can dynamically reconfigure, that is modify or delete, select components that you have provisioned on your Cisco MGC. The following procedure lists the sequence of actions you must perform (actual steps to take depend on the provisioning tool you use):
Note
Step 1
Step 2
Note
Step 3
Save and activate your provisioning changes as described in the "Saving and Activating your Provisioning Changes" section.
Step 4
Note
Understanding Dynamic Reconfiguration
Dynamic reconfiguration is a function in the Cisco MGC software that allows you to modify or delete Cisco MGC components while the Cisco MGC software is still in service. Dynamic reconfiguration can be performed without shutting down or restarting either the Cisco MGC software or the Sun host platform.
The Cisco MGC component types that can be dynamically reconfigured are listed below. No other component types can be dynamically reconfigured.
•
•
•
•
•
•
•
•
•
Table 3-1 lists the preconditions that must be met for the component before any modification or deletion action can be performed as part of dynamic reconfiguration. There are no preconditions for adding components as part of dynamic reconfiguration.
Table 3-9 Dynamic Reconfiguration Preconditions
CICs
Call state of the CIC must be IDLE (refer to the "Verifying CIC States" section) and the service state of the associated DPC must be set to OOS (refer to the "Setting the Service State of a Destination" section).
or
Block type for the CIC must be set to locally blocked (refer to the "Blocking CICs" section) and the associated media gateway span and timeslot must be set to OOS (refer to the documentation for the media gateway).
Note
Point codes (DPC, OPC, or APC) and SS7 routes
Service state of the point code and SS7 route must be set to OOS (refer to the "Setting the Service State of a Destination" section).
Signaling links (TDM, ATM, or SS7)
Service state of the signaling link must be set to OOS (refer to the "Setting the Service State of a Link or Linkset" section).
Signaling services
Service state of the signaling service must be set to OOS (refer to the "Setting the Service State of a Signaling Channel" section).
SS7 subsystems
Service state of the subsystems and routes must be set to OOS (refer to the "Setting the Service State of a Local Subsystem Number" section).
Trunk groups
Component properties (linksets, signaling services, and trunk groups)
None.
For example, if you want to change the settings for a DPC or remove it altogether, you must first set the service state of the DPC to OOS, before attempting to make changes. If you do not set the service state to OOS, your dynamic reconfiguration request is rejected with an error message.
During dynamic reconfiguration, the system goes through two phases. First, it validates the service states of all objects being changed. If any error is encountered, no reconfiguration takes place on any of the objects. Error messages indicate which components are in error. The format of the error message is "Component's MML name, process rejecting change, reason for rejecting the change, remedy."
If no errors are encountered during the validation phase, the update phase proceeds. This is where the new configuration data is loaded by all of the processes. At the beginning of the update phase, an SNMP alarm is displayed to indicate update starting. At the end of the update phase, the alarm clears, and, if commit/deploy was initiated by MML, the MML response is returned.
To change the current configuration of a component using dynamic reconfiguration, you can only use the provisioning tools provided with the Cisco MGC, MML provisioning commands or an SNMP provisioning agent (such as the Cisco MGC Manager [CMM] or the Voice Services Provisioning Tool [VSPT]).
Provisioning or configuring by using any other means can cause errors during the dynamic reconfiguration process. Using these tools is required because the dynamic reconfiguration process relies on the provisioning tools to validate the data values and, more importantly, to crosscheck the dependencies of the objects. For example, the provisioning tool ensures that adding a signal transfer point (STP) first requires the existence of the associated route.
Retrieving Provisioning Data
You can use the prov-rtrv MML command to retrieve information about your current provisioning settings. The ways in which you can use this command to retrieve provisioning data are described in the following sections:
•
•
•
•
•
Retrieving Data for an Individual Component
You can retrieve provisioning data on any individual component on your system. To do this, log in to the active Cisco MGC, start an MML session, and enter the following command:
prov-rtrv:component:name=MML_nameWhere:
•
•
For example, to view the provisioning data for a point code called opc, you would enter the following command:
prov-rtrv:ptcode:name="opc"The system returns a response similar to the following:
MGC-01 - Media Gateway Controller 2000-08-25 16:28:56M RTRV""session=active:ptcode"/*NAME = opcDESC = Originating Point CodeNETADDR = 201.1.100NETIND = 2*/The response to the command is dependent upon the component type associated with the desired component. For example, to view the properties for an SS7 signaling service called ss7svc1, you would enter the following command:
prov-rtrv:sigsvcprop:name="ss7svc1"The system returns a response similar to the following:
MGC-01 - Media Gateway Controller 2001-06-01 10:09:47M RTRV"session=active:sigsvcprop"/*adjDestinations = 16AlarmCarrier = 0BOrigStartIndex = 0BothwayWorking = 1BTermStartIndex = 0CctGrpCarrier = 2CGBA2 = 0CircHopCount = 0CLIPEss = 0CotInTone = 2010CotOutTone = 2010CotPercentage = 0dialogRange = 0ExtCOT = LoopForwardCLIinIAM = 1ForwardSegmentedNEED = 1GLARE = 0GRA2 = 0GRSEnabled = falseInternationalPrefix = 0layerRetries = 2layerTimer = 10MaxACL = 3maxMessageLength = 250mtp3Queue = 1024NationalPrefix = 0NatureOfAddrHandling = 0Normalization = 0OMaxDigits = 24OMinDigits = 0OOverlap = 0OwnClli = naRedirMax = 3ReleaseMode = AsyncrestartTimer = 10RoutePref = 0sendAfterRestart = 16slsTimer = 300srtTimer = 300sstTimer = 300standard = ANSI92SwitchID = 0TMaxDigits = 24TMinDigits = 0TOverlap = 0variant = SS7-ANSIVOIPPrefix = 0*/Retrieving Data for All Components
You can retrieve data on all of the components provisioned on your system. To do this, log in to the active Cisco MGC, start an MML session, and enter the following command:
prov-rtrv:allThe system returns a response similar to the following:
MGC-01 - Media Gateway Controller 2001-06-12 17:12:49M RTRV"session=active:all"/*NAME COMPID Parent Name TID Description---- -------- ----------- --- -----------"ether1" 00050003 "MGC-01" CARD "Ethernet Card 1""ether2" 00050004 "MGC-01" CARD "Ethernet Card 2""enif1" 00060003 "ether1" ENETIF "Ethernet IF 1""enif2" 00060004 "ether2" ENETIF "Ethernet IF 2""ls1" 00080001 "dpc1" LNKSET "link set 1 to 2600-202-INET-6a""ls2" 00080004 "dpc2" LNKSET "link set 2 to 2600-203-INET-6a""ls-itu" 00080005 "stp1" LNKSET "Lkset stp1,1-6-1""va-5300-202-1" 00100001 "va-5300-202" IPLNK "link 1 to va-5300-202""va-5300-202-2" 00100002 "va-5300-202" IPLNK "link 2 to va-5300-202""va-5300-203-1" 00100003 "va-5300-203" IPLNK "link 1 to va-5300-203""va-5300-203-2" 00100004 "va-5300-203" IPLNK "link 2 to va-5300-203""va-5800-5-1" 00100005 "va-5800-5" IPLNK "link 1 to va-5300-202""va-5800-5-2" 00100006 "va-5800-5" IPLNK "link 2 to va-5800-5""route1" 00110001 "MGC-01" SS7ROUTE "route to dpc1 via ls1""rt3" 00110005 "MGC-01" SS7ROUTE "SS7 Rte3-for scp2""rt1" 00110006 "MGC-01" SS7ROUTE "SS7 Rte1-stp1""rt2" 00110007 "MGC-01" SS7ROUTE "SS7 Rte2-for scp1""route2" 0011000a "MGC-01" SS7ROUTE "route to dpc2 via ls2""opc2" 00130002 "MGC-01" PTCODE "Own Pointcode""dpc2" 00130004 "MGC-01" PTCODE "TDM Switch dpc2 Pointcode""opc1" 00130006 "MGC-01" PTCODE "Own Pointcode""dpc1" 00130007 "MGC-01" PTCODE "TDM Switch dpc1 Pointcode""va-5300-202" 00140001 "nas1" NASPATH "Serviceto nas1""va-5300-203" 00140002 "nas2" NASPATH "Serviceto nas2""va-5800-5" 00140003 "nas1" NASPATH "Serviceto nas1""ss7svc2" 00150002 "dpc2" SS7PATH "SS7 service to dpc2""ss7svc1" 00150005 "dpc1" SS7PATH "SS7 service to dpc1""nas1" 00160001 "MGC-01" EXTNODE "va-5300-202""nas2" 00160002 "MGC-01" EXTNODE "va-5300-203""nas8" 00160003 "MGC-01" EXTNODE "va-5800-5""ls1link1" 001d0001 "ls1" C7IPLNK "link 1 of ls1 to va-2600-202""ls2link1" 001d0002 "ls2" C7IPLNK "link 1 of ls2 to va-2600-202""ls1link2" 001d0003 "ls1" C7IPLNK "link 2 of ls1 to va-2600-203""ls2link2" 001d0004 "ls2" C7IPLNK "link 2 of ls2 to va-2600-203""lk-3" 001d0005 "ls-itu" C7IPLNK "SS7ITU 2600-91""stp1" 001e0001 "MGC-01" APC "STP 1""scp1" 001e0002 "MGC-01" APC "SCP1 for PC/SSN""scp2" 001e0003 "MGC-01" APC "SCP2 for PC/SSN""ss7subsys3" 001f0003 "MGC-01" SS7SUBSYS "pc_ssn scp2 rte-ssn 254""ss7subsys1" 001f0004 "MGC-01" SS7SUBSYS "ssn 254(800)""ss7subsys2" 001f0005 "MGC-01" SS7SUBSYS "pc_ssn scp1 rte-ssn 254"*/Retrieving Data for All Components of a Particular Type
You can retrieve provisioning data on all components of a particular type on your system. To do this, log in to the active Cisco MGC, start an MML session, and enter the following command:
prov-rtrv:component:"all"Where: component is the MML component type associated with the desired component group. You can find a complete list of MML component types in the Cisco Media Gateway Controller Software Release 7 Provisioning Guide.
For example, to view the provisioning data for all point codes, you would enter the following command:
prov-rtrv:ptcode:"all"The system returns a response similar to the following:
MGC-01 - Media Gateway Controller 2001-06-12 17:16:42M RTRV"session=active:ptcode"/*NAME NETADDR NETIND---- ------- ------opc2 2.11.1 2dpc2 2.2.2 2opc1 2.10.2 2dpc1 1.1.1 2*/Retrieving Data on the Current Provisioning Session
You can retrieve provisioning data on the current provisioning session. To do this, log in to the active Cisco MGC, start an MML session, and enter the following command:
prov-rtrv:sessionThe system returns a response similar to the following:
MGC-02 - Media Gateway Controller 2001-06-13 13:39:19M RTRV"session=jtest:session"/*Session ID = mml1SRCVER = activeDSTVER = jtest*/Retrieving Data on Supported Signaling Protocols
You can retrieve protocol data for the current provisioning session. To do this, log in to the active
Cisco MGC, start an MML session, and enter the following command:prov-rtrv:variantsThe system returns a response similar to the following:
MGC-01 - Media Gateway Controller 2001-06-12 17:18:25M RTRV"session=active:variants"/*MDO File name Protcol Family Switch Type------------- -------------- -----------ANSISS7_CLEAR SS7-ANSI 20ANSISS7_MCI SS7-ANSI 0ANSISS7_NOATPTX SS7-ANSI 0ANSISS7_SPRINT SS7-ANSI 0ANSISS7_STANDARD SS7-ANSI 0ATT_41459 ISDNPRI 17ATT_41459_C2 ISDNPRI 17BELL_1268 ISDNPRI 22BELL_1268_C3 ISDNPRI 22BTNUP_BTNR167 SS7-UK 5BTNUP_IUP SS7-UK 5BTNUP_NRC SS7-UK 5DPNSS_BTNR188 DPNSS 26EISUP EISUP 0ETS_300_102 ISDNPRI 27ETS_300_102_C1 ISDNPRI 27ETS_300_102_C6 ISDNPRI 27ETS_300_121 SS7-ITU 0ETS_300_172 ISDNPRI 29ETS_300_356 SS7-ITU 0HKTA_2202 SS7-ITU 0ISUPV1_POLI SS7-ITU 0ISUPV2_32DIG SS7-ITU 0ISUPV2_CZECH SS7-ITU 0ISUPV2_FINNISH96 SS7-ITU 0ISUPV2_FRENCH SS7-ITU 0ISUPV2_GERMAN SS7-ITU 0ISUPV2_JAPAN SS7-Japan 10ISUPV2_KPNPB SS7-ITU 0ISUPV2_NTT SS7-Japan 0ISUPV2_SPANISH SS7-ITU 0ISUPV2_SWISS SS7-ITU 0ISUPV2_TELEFONICA SS7-ITU 0ISUPV2_VIETNAM SS7-ITU 0ISUPV3_UK SS7-UK 0ISUPV3_UK_AXE10 SS7-UK 15ISUPV3_UK_AXE10_BTNETCHAT SS7-UK 15ISUPV3_UK_BTNETCHAT SS7-UK 0Q721_BASE SS7-ITU 5Q721_BRAZILIAN SS7-ITU 5Q721_CHINA SS7-China 5Q721_FRENCH SS7-ITU 5Q721_PHILLIPINE SS7-ITU 5Q761_ARGENTINA SS7-ITU 0Q761_ARGENTINA_C2 SS7-ITU 0Q761_AUSTRL SS7-ITU 0Q761_AUSTRL_C2 SS7-ITU 0Q761_BASE SS7-ITU 0Q761_BELG_BCOM SS7-ITU 0Q761_BELG_ISUP_CUJO SS7-ITU 0Q761_BELG_MOBI SS7-ITU 0Q761_CHILE SS7-ITU 0Q761_CHINA SS7-China 0Q761_CHINA_MOB SS7-China 0Q761_CHINA_MOB SS7-ITU 0Q761_DANISH SS7-ITU 0Q761_INDIA SS7-ITU 0Q761_KOREAN SS7-ITU 0Q761_NEWZEALAND SS7-ITU 0Q761_PERU SS7-ITU 0Q761_PORTUGAL SS7-ITU 0Q761_SIEMENS_MOBI SS7-ITU 0Q761_SINGAPORE SS7-ITU 0Q761_TAIWAN SS7-ITU 0Q761_THAILAND SS7-ITU 0Q767_BASE SS7-ITU 0Q767_BRAZIL SS7-ITU 0Q767_COLOMBIA SS7-ITU 0Q767_GUATEMALA SS7-ITU 0Q767_INDONESIA SS7-ITU 0Q767_ITAL SS7-ITU 0Q767_ITAL_INTERCONNECT SS7-ITU 0Q767_MEXICAN SS7-ITU 0Q767_RUSS SS7-ITU 0Q767_SPAN SS7-ITU 0Q767_SWED SS7-ITU 0Q767_TELSTRA SS7-ITU 0Q767_TURKISH SS7-ITU 0T113_BELL SS7-ANSI 0dummy AVM 0dummy MGCP 0dummy SGCP 0dummy TCAPOverIP 0dummy VSI 0*/Provisioning a Dial Plan
You can provision dial plans on your Cisco MGC using the commands listed below. For more information on provisioning and maintaining dial plans, refer to the Cisco Media Gateway Controller Software Release 7 Dial Plan Guide.
•
•
•
•
•
Note
Importing Provisioning Data
You can import provisioning data files (created using the prov-exp MML command) and execute the MML commands contained in those files in batch mode to copy the set up from another system, or return a system to a baseline configuration. Refer to the "Exporting Provisioning Data" section for more information on exporting provisioning data.
To import the provisioning data files and execute the MML commands in batch mode, log in to the active Cisco MGC, and enter the following UNIX command:
mml -b export_directory_path/filenameWhere:
•
•
The provisioning data files must be provisioned in the following order:
•
•
•
•
•
For example, to import the provisioning data stored in the config.mml file, which is located in the /opt/ CiscoMGC/etc/cust_specific/saved_config directory, you would enter the following command:
mml -b /opt/CiscoMGC/etc/cust_specific/saved_config/config.mmlExporting Provisioning Data
You can use the prov-exp MML command to export the current provisioning set up of your Cisco MGC in MML-command form to a file or files. This allows you to copy the provisioning data from one Cisco MGC and set up another Cisco MGC with that same provisioning data or to restored a Cisco MGC to a baseline provisioning environment. Refer to "Importing Provisioning Data" section for information on importing the provisioning data created by the prov-exp MML command.
To export part of the current configuration of your Cisco MGC to a file, log in to the active Cisco MGC, start an MML session, and enter the following command:
prov-exp:tid:dirname="export_directory_name"Where:
•
–
–
–
•
For example, to export the core configuration data to a file stored in the /opt/CiscoMGC/etc/ cust_specific/saved_config directory, you would enter the following command:
prov-exp:config:dirname="saved_config"To export all of the current configuration of your Cisco MGC to several files, log in to the active Cisco MGC, start an MML session, and enter the following command:
prov-exp:all:dirname="export_directory_name"Where export_directory_name is the name of the directory to which the data is exported. This directory is a subdirectory within the /opt/CiscoMGC/etc/cust_specific directory established at installation.
The system creates the following files in the specified directory when this command is entered:
•
•
•
•
•
For example, to export all of the provisioning data into files stored in the /opt/CiscoMGC/etc/ cust_specific saved_config directory, you would enter the following command:
prov-exp:all:dirname="saved_config"Managing Automatic Congestion Control
The Cisco MGC supports Automatic Congestion Control (ACC). ACC dynamically regulates incoming traffic on the Cisco MGC to levels that can be handled effectively by rejecting a percentage of new calls when the Cisco MGC is congested. ACC increases the throughput of completed calls through the telephone network during periods of overload.
During periods of overload on the Cisco MGC, a user-defined percentage (depending on internal congestion level) of incoming calls are rejected and an ISUP release message is sent to the adjacent signaling point. That ISUP release message has a clear cause of Switch Equipment Congestion and contains an Automatic Congestion Level (ACL) value that indicates the overload level of the
Cisco MGC. For a call that is in progress when overload occurs and the call clears normally, the ISUP release message has a clear cause of Normal Call Clearing and an ACL value associated with the current overload level of the Cisco MGC.ACC is controlled by parameters that are found in the XECfgParm.dat file and by a property associated with the signaling service or trunk group, which are described in the following sections:
•
•
•
•
Understanding Overload Level Percentage Parameters
The overload level (or congestion level) of the Cisco MGC is measured in three levels (1, 2, and 3, with 3 being the highest). Each overload level has three associated thresholds, one for overload onset, one for overload abatement, and one more for the percentage of calls that are rejected during an overload condition. These thresholds are defined by parameters found in the XECfgParm.dat file.
The XECfgParm.dat parameters that are used to set the overload level thresholds are listed below.
•
•
•
•
•
•
•
•
•
You can configure the onset, abatement, and rejection thresholds for CPU utilization using these XECfgparm.dat parameters. The default values for these parameters enable the Cisco MGC to operate in conformance with Q.543, section 3. You can modify these values experimentally, based on your network's traffic patterns, to enhance the performance of your Cisco MGC.
Note
Caution
The overload level is tracked using three measurements, which are described in Table 3-10.
Table 3-10 Overload Level Measurement Types
Mean CPU utilization level
Per CPU utilization interval (user-defined)
Mean of the average CPU utilization levels over the duration of the CPU utilization interval is compared to the overload level thresholds.
Engine thread utilization level
Per CPU utilization interval (user-defined)
Utilization level for the engine thread with the highest average usage level over the duration of the CPU utilization interval is compared to the overload level thresholds. There are three engine threads:
•
•
•
Note
((*.numOfThreads = 2) + 1 = 3).Call processing engine queue occupancy level
Per new call
Current size of queue is divided by the capacity of the queue and compared to the queue occupancy overload thresholds. The queue occupancy overload thresholds are equal to half of the value of the corresponding overload level thresholds.
Note
Overload conditions are most likely to be caused by high CPU utilization levels, since the Cisco MGC software uses multi-threaded processing, which almost eliminates the possibility that the size of the call processing engine queue would exceed the queue occupancy overload thresholds. For information on viewing the current overload level, refer to the "Retrieving Overload Level" section.
When any of the three overload measurement types indicate that an overload onset threshold has been passed, the Cisco MGC generates an alarm associated based on the overload level. Table 3-11 details the overload level to alarm relationship. For more information on these alarms, refer to the Cisco Media Gateway Controller Software Release 7 Messages Reference Guide.
Table 3-11 Alarm Associations for Cisco MGC Overload Levels
1
OverloadLight
2
OverloadMedium
3
OverloadHeavy
The alarms are automatically cleared when the associated overload measurement is re-taken and a new overload level has been reached, either dropping to the associated abatement threshold or rising to a higher onset threshold. For example, if, over three consecutive CPU utilization interval timer periods, the CPU utilization level measurement indicated that the overload level is 3 for the first period, that the overload level is 1 for the second period, and that the overload level is 2 for the third period, the system would go through the following process:
1.
2.
3.
4.
5.
6.
7.
8.
Note
Note
Understanding the CPU Timer Interval Parameter
The XECfgParm.dat parameter, CPUTimerInterval, is used to specify the interval, in milliseconds, at which the average CPU utilization level of the Cisco MGC is sampled. The default value is 3000. We recommend that you stay within the range of 1000 to 4000 milliseconds. A lower interval rate provides a quicker response to internal congestion, while a higher interval rate provides a more accurate sample.
Note
Note
Caution
Understanding the Maximum ACL Value
When the Cisco MGC is overloaded, an ACL value is sent to adjacent signaling points in an ISUP release message. Since ANSI- and ITU-based signaling points have different maximum ACL values, the
Cisco MGC uses a property, MaxACL, associated with an SS7 signaling service or trunk group, to map the ACC maximum overload level value to the maximum ACL value used by the adjacent signaling point.ANSI-based signaling points have a maximum ACL value of 3, ITU-based signaling points have a maximum ACL value of 2, and the ACC maximum overload level value is 3. When MaxACL is set to 3, the ACC maximum overload value is mapped to the ANSI standard, (the default value for MaxACL is 3). When MaxACL is set to 2, the ACC maximum overload value is mapped to the ITU standard. MaxACL also has a third possible setting, 0, which disables the sending of ACL indications in the ISUP release message. Table 3-12 shows how the MaxACL settings map the ACC maximum overload value to the ANSI and ITU congestion standards.
Note
Modifying the Maximum ACL Value
To modify the maximum ACL value using MML commands, perform the following steps:
Note
Step 1
Step 2
prov-ed:component:name="comp_name",MaxACL=numWhere:
•
–
–
•
•
For example, to modify the internal maximum ACL value on a trunk group named trunk1, which is adjacent to a signaling point that uses the ITU congestion standard, you would enter the following command:
prov-ed:trnkgrp:name="trunk1",MaxACL=2For example, to modify the internal maximum ACL value on an SS7 signaling service named ss7svc1, which is adjacent to a signaling point that uses the ITU congestion standard, you would enter the following command:
prov-ed:ss7path:name="ss7svc1",MaxACL=2Step 3
Retrieving Overload Level
To retrieve the current overload level of your system, log in to the active Cisco MGC, start an MML session, and enter the following command:
rtrv-ovldThe system returns a response that identifies the current overload level (0 through 3) and number of messages in the call engine queue.
Media Gateway Controller - MGC-01 2000-01-12 15:19:51M RTRV"ENGG-01: OVLD=0,MSGQ=0"Managing your Cisco MGC Platform
The operations you can use to manage your Cisco MGC platform are described in the following sections:
•
•
•
•
•
Performing a Manual Switchover
In the continuous service configuration, you can swap the roles of the active Cisco MGC and the standby Cisco MGC by invoking the appropriate MML command from the management interface of the active Cisco MGC. A switchover can be done only from the active Cisco MGC, because only the active Cisco MGC can command the standby Cisco MGC to take over. If there is only one Cisco MGC processing all calls, a manual switchover request is rejected.
Manual switchovers are typically performed for the following reasons:
•
•
•
When you need to order a manual switchover to perform maintenance or upgrade procedures on one or both of the Cisco MGCs, use the following steps or all calls might be killed by the call engine. Starting with both the active and standby Cisco MGCs operating normally, you can invoke a manual switchover from one system to the other by completing the following steps:
Step 1
Step 2
If any alarms are pending, you must correct the situation that caused the alarms. Search for the corrective actions required to clear any alarms in the "Alarm Troubleshooting Procedures" section. If the alarms do not appear in that section, corrective action is not required for those alarms. Refer to the Cisco Media Gateway Controller Software Release 7 Messages Reference Guide for more information on those alarms.
Step 3
Step 4
prov-sync
Caution
Step 5
Step 6
Caution
Switchover can also cause call processing to fail if debugging is turned on.
Caution
Step 7
sw-over::confirmSite alarms are automatically set until the OOS Cisco MGC is returned to an IS state.
Step 8
Verifying Successful Completion of a Switchover
You can determine whether a switchover (automatic or manual) was successfully completed by retrieving the status of each Cisco MGC. Once all of the processes to come up (the time it takes for this to happen depends on the amount of traffic), determine the platform state of both Cisco MGCs, as described in the "Verifying the Platform State of the Cisco MGC Hosts" section. If the platform state of both Cisco MGCs was as expected, the switchover was successfully completed. If one of the Cisco MGCs does not return the expected platform state, the switchover was not successfully completed. Refer to the "Recovering from a Switchover Failure" section.
Understanding Switchover
Cisco MGCs can be arranged in an Active-Standby configuration in which one MGC host runs active traffic while checkpointing information to the standby Cisco MGC. In the continuous service configuration, the active Cisco MGC is paired with an identical standby Cisco MGC that automatically takes over if a failure or switchover occurs. The continuous service architecture of the Cisco MGC increases the reliability, availability, and failure-aversion capabilities of the system.
The primary goal of the Cisco MGC failover subsystem is to ensure call preservation when there is a system failure. This is achieved by interconnecting two Cisco MGCs while the system carries out the logical functions of call control. At any point, one Cisco MGC is in the active role and the other Cisco MGC is in the standby role. The active Cisco MGC carries out the call control function and updates the standby Cisco MGC about call-processing events. The standby Cisco MGC maintains the same system state (from the call-processing point of view) as the active Cisco MGC. In the event of a critical failure on the active Cisco MGC, the standby switches to the active role and takes over the call control function, ensuring that all established calls are preserved.
Note
Switchovers can occur automatically (also known as failovers) when a critical alarm is generated, or a switchover can be performed manually, typically as part of a maintenance or troubleshooting procedure. For more information on performing a manual switchover, refer to the "Performing a Manual Switchover" section.
Note
Fault-Tolerant Components
The following component processes of the Cisco MGC are fault-tolerant. In other words, each of these processes knows its own state (Active/Standby/Out-of-Service) and the corresponding state of its peer process on the standby system.
•
•
•
•
•
•
Failover Daemon
The active Cisco MGC runs the procM process. ProcM automatically starts when the Cisco MGC is booted and, in turn, starts the alarm manager, configuration manager, call engine, IOCCs, and other processes, including foverd.
The continuous service architecture is controlled by the failover daemon. The failover daemons on both Cisco MGC hosts coordinate the active, standby, and OOS states of those hosts.
The alarm manager process also plays a significant role in a continuous service system. The alarm manager raises the alarm when a critical event occurs and clears the alarm when the condition that caused the alarm is cleared. See the Cisco Media Gateway Controller Software Release 7 Messages Reference Guide for detailed information regarding alarms, specifically which alarms are critical.
The foverd process directs manual switchovers. The switchover configuration provides the following:
•
•
•
A critical event is typically a critical process dying or the failure of a subsystem or component that can critically affect call processing. A forced failover occurs automatically when the conditions governing it are met; it is system-initiated and not user-initiated. When a critical event occurs, the alarm manager sends a specific message to the foverd process, indicating the occurrence of the critical event.
When the failover daemon receives notification that a critical event has occurred on the active Cisco MGC, the failover daemon initiates a forced switchover to the standby Cisco MGC. The standby Cisco MGC transitions immediately to the active state; established calls are maintained, but calls still in the process of being set up are lost.
The occurrence of a critical event on system A results in its peer, system B, becoming active while system A goes to an OOS state. Until the critical event that triggered the failover on system A is cleared, its state remains OOS. When the critical event is cleared, the alarm manager sends another message, known as a Clear Alarm message, to the foverd process. The foverd process drives system A to a standby state (if the peer system (B) is still in the active state).
When the critical event is cleared, the failed controller (A) comes back online. It can then become the standby for the currently active Cisco MGC (B). Initially, system A is still OOS. The platform state of system A continues to be OOS until the critical event is cleared.
Established calls are maintained during a switchover because the Call Engine checkpoints call information from the active Cisco MGC to the standby Cisco MGC. In addition, the state of the SS7 network is checkpointed by the MTP3 IOCC. The MTP2 terminal functionality resides on the Cisco SLTs to enable the fault-tolerant MTP3 solution.
The Cisco SLTs are responsible for SS7 MTP2 message processing. The Cisco SLTs communicate directly with the Cisco MGC hosts (active and standby) using RUDP, but they send SS7 traffic only to the active Cisco MGC.
Note
Circuit Auditing
An auditing process discovers discrepancies in circuit states between the Cisco MGC and the media gateways it controls. During a switchover, discrepancies might exist as to the state of bearer circuits (CICs) between the newly active Cisco MGC and the bearer devices it controls. Discrepancies in circuit states between the active Cisco MGC and the bearer devices could also occur as the result of control messages to the bearer devices that get lost.
The circuit auditing mechanism can be run periodically at configured intervals or after an automatic or manual switchover. It can also be initiated manually using the MML command, sw-over::confirm. The audit capability is always initiated automatically on indication of critical error conditions from solution components, adjacent SS7 switches, or when critical Cisco MGC conditions occur. The circuit-auditing mechanism detects and resolves circuit state discrepancies that it discovers and resynchronizes the Cisco MGC and the bearer devices.
Caution
The circuit auditing mechanism is a function of the call engine process in the active Cisco MGC. The call engine subsystem starts a thread to perform the circuit-auditing function upon notification of a switchover event from the fault manager.
The circuit auditing mechanism commands the bearer devices to reflect the circuit state of the Cisco MGC. If a bearer device believes the circuit to be in use and the Cisco MGC does not, the Cisco MGC releases the circuit. However, if the Cisco MGC shows that a bearer circuit is in use and discovers that the bearer device does not show that circuit as in use, the Cisco MGC does not attempt to rebuild the call, but releases all associated resources. Even though the Cisco MGC is the controlling authority, the only course of action when a discrepancy is discovered during a circuit audit is to release all of the allocated resources, which means dropping the call.
Checkpointing
Checkpointing of calls ensures that established calls are preserved in the event of a switchover. The Call Engine sends checkpoint events to the local checkpoint process at one point during call setup and at one point in the call release phase.
Checkpointing is also applied to the following protocol supervisory messages and MML commands that change the logical state of the bearer circuits:
•
•
The local checkpointing process is responsible for securing these events to disk if the standby Cisco MGC is unavailable and for forwarding those events to the remote checkpointing process once it does become available. If the standby Cisco MGC is running, checkpoint events are batched and forwarded to the remote checkpointing process.
The remote checkpointing process is responsible for handling the checkpoint events from the active Cisco MGC, delivering only established calls to the remote call engine. The remote call engine process begins checkpointing events for calls when it begins active call processing.
The following scenarios are supported:
•
•
•
•
Checkpointing is also implemented to support forward Cisco MGC software migration by one release. You can manually take the standby Cisco MGC out of service, upgrade the software to the new release, and resynchronize calls with the active Cisco MGC. For detailed procedures on upgrading the Cisco MGC software, refer to the Cisco Media Gateway Controller Software Release 7 Installation and Configuration Guide.
Verifying the Patch Level of the Cisco MGC
As of Release 7.4(12) of the Cisco MGC software, you can verify the patch level of your Cisco MGC software by performing the following steps:
Step 1
pkginfo | grep PatchThe system returns a response similar to the following:
application CSCOgp003 Cisco Media Gateway Controller Software Patch Packageapplication CSCOgp009 Cisco Media Gateway Controller Software Patch Packageapplication CSCOgs003 Cisco Media Gateway Controller Software Patch Packagesystem SUNWswmt Patch UtilitiesLook for the Cisco MGC patch with the largest number to determine the current patch level. In the example, the current protocol patch level is patch 9 (CSCOgp009), while the system patch level is patch 3 (CSCOgs003).
Note
Step 2
http://www.cisco.com/kobayashi/sw-center/sw-voice.shmtl
Select your software version from the list and a list of currently available patches displays.
If you find that your patch level matches the current patch level on the web page, the procedure is complete. Otherwise, proceed to Step 3.
Step 3
Step 4
Step 5
Caution
Note
cd /opt/CiscoMGC/binchk_inv [>file_path]
Note
Where file_path is an optional parameter used when you want to redirect the output of the utility to a file. If you do not redirect the output to a file, the results are written to your screen.
For example, to redirect the results of the check inventory utility to a file called inv.out, you would enter the following command:
chk_inv >/opt/CiscoMGC/local/inv.outStep 6
Caution
Note
Step 7
Step 8
Retrieving Configuration Table Data
You can use the rtrv-cfg MML command to retrieve data from the configuration tables. The procedures to retrieve data from the various configuration tables are found in the following sections:
•
•
•
•
Retrieving alarm category data
You can retrieve data from the alarm categories configuration table. To do this, log in to the active
Cisco MGC, start an MML session, and enter the following command:rtrv-cfg:alarmcategoriesThe system returns a list of the alarm categories for the Cisco MGC, which begins as follows:
MGC-02 - Media Gateway Controller 2001-06-12 15:37:59M RTRV"Config Fail""XE Rsrc Fail""Gen Fail""SW Fail""SOFTW REQ"...For a complete listing of the alarm categories for the Cisco MGC, refer to the Cisco Media Gateway Controller Software Release 7 Messages Reference Guide.
Retrieving component data
You can retrieve data from the components configuration table. To do this, log in to the active
Cisco MGC, start an MML session, and enter the following command:rtrv-cfg:componentsThe system returns a list of the configured components on the Cisco MGC, which begins as follows:
MGC-01 - Media Gateway Controller 2001-06-12 15:00:46M RTRV"MGC-02: KEY=00010001, PARENT=00000000, DESCR=Media Gateway Controller""CFGG-01: KEY=00020001, PARENT=00010001, DESCR=Config Mgr Subsystem""ALGG-01: KEY=00020002, PARENT=00010001, DESCR=Alarm Mgr Subsystem""MSGG-01: KEY=00020003, PARENT=00010001, DESCR=Measurement Mgr Subsystem""ENGG-01: KEY=00020004, PARENT=00010001, DESCR=Engine Subsystem""IOSG-01: KEY=00020005, PARENT=00010001, DESCR=IO Subsystem"...Retrieving component type data
You can retrieve data from the component types configuration table. To do this, log in to the active
Cisco MGC, start an MML session, and enter the following command:rtrv-cfg:componenttypesThe system returns a list of the component types for the Cisco MGC, which begins as follows:
MGC-02 - Media Gateway Controller 2001-06-12 15:24:01M RTRV"LPC""Proc Group""Proc""Equipment""IO Card"...For a complete listing of the component types for the Cisco MGC, refer to the Cisco Media Gateway Controller Software Release 7 Provisioning Guide.
Retrieving measurement category data
You can retrieve data from the measurement categories configuration table. To do this, log in to the active
Cisco MGC, start an MML session, and enter the following command:rtrv-cfg:meascategoriesThe system returns a list of the measurement categories for the Cisco MGC, which begins as follows:
MGC-02 - Media Gateway Controller 2001-06-12 15:26:56M RTRV"ALL-COUNTERS""LIF-GROUP""LIF: SES""LIF: ES""LIF: CODE VIOLATION"...For a complete listing of the measurement categories for the Cisco MGC, refer to the "Cisco Media Gateway Controller Measurements."
Retrieving services data
You can retrieve data from the services configuration table. To do this, log in to the active Cisco MGC, start an MML session, and enter the following command:
rtrv-cfg:servicesThe system returns a list of the services on the Cisco MGC, which begins as follows:
MGC-02 - Media Gateway Controller 2001-06-12 15:32:24M RTRV"ProcessManagement""ProcessManagement_hi_pri"...Retrieving tables data
You can retrieve data from the tables configuration table. To do this, log in to the active Cisco MGC, start an MML session, and enter the following command:
rtrv-cfg:tablesThe system returns a list of the tables for the Cisco MGC, which begins as follows:
MGC-02 - Media Gateway Controller 2001-06-12 15:33:47M RTRV"alarmCategories""componentTypes""components""measCategories""services"...Retrieving default configuration parameters data
You can retrieve data from the default configuration parameters table. To do this, log in to the active Cisco MGC, start an MML session, and enter the following command:
rtrv-cfg:dfltcfgparmsThe system returns a list of the default configuration parameters for the Cisco MGC, which begins as follows:
MGC-02 - Media Gateway Controller 2001-06-12 15:34:49M RTRV"*.disableMeas""*.sm_meas_baseaddr""*.platformId"...Retrieving the Logging Level of Software Processes
You can use the rtrv-log MML command to retrieve the current logging level of a single process or of all of the processes. For more information on processes, refer to "Understanding Processes" section.
To retrieve the current logging level of a single process, log in to the active Cisco MGC, start an MML session, and enter the following command:
rtrv-log:processWhere process is the MML name of the desired process. For a list of valid process names, refer to the "Understanding Processes" section.
For example, to retrieve the current logging level of the call engine process (eng-01), you would enter the following command:
rtrv-log:eng-01The system returns a response similar to the following:
Media Gateway Controller - MGC-01 2000-01-16 09:38:03M RTRV"ENG-01:INFO"To retrieve the current logging level of all of the processes, log in to the active Cisco MGC, start an MML session, and enter the following command:
rtrv-log:allThe system returns a response similar to the following:
Media Gateway Controller - MGC-01 2000-01-16 09:38:03M RTRV"ENG-01:INFO"
Note
Managing System Measurements
The operations you can use to manage the Cisco MGC's system measurements are described in the following sections:
•
•
Retrieving Measurements
You can view and search the measurements results stored in the measurements log file using the alarm and measurement viewer included in the Cisco MGC viewer toolkit. For more information on viewing and searching measurement files, refer to the "Viewing and Searching System Measurement Files" section.
Each measurement (or counter) is uniquely defined by its measurement category and component identification number. You can retrieve individual measurements using the following MML command from the active Cisco MGC:
rtrv-ctr:comp:"meas_cat"Where:
•
•
For example, to view the ISUP IAM transmission measurement totals for a component called dpc1, enter the following MML command:
rtrv-ctr:dpc1:"ISUP: XMIT IAM TOT"The system returns a message similar to the following:
MGC-01 - Media Gateway Controller 2000-07-11 10:15:50M RTRV"dpc1:CAT=\"ISUP: XMIT IAM TOT\",INT=300,VAL=353""dpc1:CAT=\"ISUP: XMIT IAM TOT\",INT=1800,VAL=2501"Clearing Measurements
Each measurement (or counter) is uniquely defined by its measurement category and component identification number. You can retrieve individual measurements using the following MML command from the active Cisco MGC:
clr-ctr:comp:"meas_cat"Where:
•
•
For example, to clear the ISUP IAM transmission measurement totals for a component called dpc1, enter the following MML command:
clr-ctr:dpc1:"ISUP: XMIT IAM TOT"Retrieving Link or Linkset Measurements
You can use the rtrv-lnk-ctr MML command to retrieve the system measurements for a single link, all the links in a linkset, or all links. For a complete list of system measurements, refer to "Cisco Media Gateway Controller Measurements".
To retrieve a list of system measurements for a single link, log in to the active Cisco MGC, start an MML session, and enter the following command:
rtrv-lnk-ctr:linkWhere link is the MML name of the SS7 link.
For example, to view the measurements for a link called ls1link1, you would enter the following command:
rtrv-lnk-ctr:ls1link1The system returns a response similar to the following:
MGC-03 - Media Gateway Controller 2000-08-22 16:32:23M RTRV"ls1link1:CAT=\"SC: RCV FRM TOT\",INT=900,VAL=0""ls1link1:CAT=\"SC: RCV FRM TOT\",INT=3600,VAL=0""ls1link1:CAT=\"SC: RCV FRM TOT\",INT=86400,VAL=0""ls1link1:CAT=\"SC: XMIT FRM TOT\",INT=900,VAL=0""ls1link1:CAT=\"SC: XMIT FRM TOT\",INT=3600,VAL=0""ls1link1:CAT=\"SC: XMIT FRM TOT\",INT=86400,VAL=0""ls1link1:CAT=\"SC: RCV BAD TOT\",INT=900,VAL=0""ls1link1:CAT=\"SC: RCV BAD TOT\",INT=3600,VAL=0""ls1link1:CAT=\"SC: RCV BAD TOT\",INT=86400,VAL=0""ls1link1:CAT=\"C7LNK: MSU DROP-CONG\",INT=1800,VAL=0""ls1link1:CAT=\"C7LNK: DUR UNAVAIL\",INT=1800,VAL=0""ls1link1:CAT=\"SC: RCV BAD CRC\",INT=900,VAL=0""ls1link1:CAT=\"SC: RCV BAD CRC\",INT=3600,VAL=0""ls1link1:CAT=\"SC: RCV BAD CRC\",INT=86400,VAL=0""ls1link1:CAT=\"C7LNK: DUR IS\",INT=1800,VAL=0""ls1link1:CAT=\"C7LNK: RCV SIO TOT\",INT=1800,VAL=0""ls1link1:CAT=\"C7LNK: XMIT SIO TOT\",INT=1800,VAL=0""ls1link1:CAT=\"C7LNK: RCV SU ERR\",INT=1800,VAL=0"To retrieve a list of system measurements for the links that make up a linkset, log in to the active
Cisco MGC, start an MML session, and enter the following command:rtrv-lnk-ctr:linksetWhere linkset is the MML name of the SS7 linkset.
For example, to view the measurements for each link within a linkset called ls1, you would enter the following command:
rtrv-lnk-ctr:ls1link1The system returns a response similar to the following:
MGC-03 - Media Gateway Controller 2000-08-22 16:32:23M RTRV"ls1link1:CAT=\"SC: RCV FRM TOT\",INT=900,VAL=0""ls1link1:CAT=\"SC: RCV FRM TOT\",INT=3600,VAL=0""ls1link1:CAT=\"SC: RCV FRM TOT\",INT=86400,VAL=0""ls1link1:CAT=\"SC: XMIT FRM TOT\",INT=900,VAL=0""ls1link1:CAT=\"SC: XMIT FRM TOT\",INT=3600,VAL=0""ls1link1:CAT=\"SC: XMIT FRM TOT\",INT=86400,VAL=0""ls1link1:CAT=\"SC: RCV BAD TOT\",INT=900,VAL=0""ls1link1:CAT=\"SC: RCV BAD TOT\",INT=3600,VAL=0""ls1link1:CAT=\"SC: RCV BAD TOT\",INT=86400,VAL=0""ls1link1:CAT=\"C7LNK: MSU DROP-CONG\",INT=1800,VAL=0""ls1link1:CAT=\"C7LNK: DUR UNAVAIL\",INT=1800,VAL=0""ls1link1:CAT=\"SC: RCV BAD CRC\",INT=900,VAL=0""ls1link1:CAT=\"SC: RCV BAD CRC\",INT=3600,VAL=0""ls1link1:CAT=\"SC: RCV BAD CRC\",INT=86400,VAL=0""ls1link1:CAT=\"C7LNK: DUR IS\",INT=1800,VAL=0""ls1link1:CAT=\"C7LNK: RCV SIO TOT\",INT=1800,VAL=0""ls1link1:CAT=\"C7LNK: XMIT SIO TOT\",INT=1800,VAL=0""ls1link1:CAT=\"C7LNK: RCV SU ERR\",INT=1800,VAL=0""ls1link2:CAT=\"SC: RCV FRM TOT\",INT=900,VAL=0""ls1link2:CAT=\"SC: RCV FRM TOT\",INT=3600,VAL=0""ls1link2:CAT=\"SC: RCV FRM TOT\",INT=86400,VAL=0""ls1link2:CAT=\"SC: XMIT FRM TOT\",INT=900,VAL=0""ls1link2:CAT=\"SC: XMIT FRM TOT\",INT=3600,VAL=0""ls1link2:CAT=\"SC: XMIT FRM TOT\",INT=86400,VAL=0""ls1link2:CAT=\"SC: RCV BAD TOT\",INT=900,VAL=0""ls1link2:CAT=\"SC: RCV BAD TOT\",INT=3600,VAL=0""ls1link2:CAT=\"SC: RCV BAD TOT\",INT=86400,VAL=0""ls1link2:CAT=\"C7LNK: MSU DROP-CONG\",INT=1800,VAL=0""ls1link2:CAT=\"C7LNK: DUR UNAVAIL\",INT=1800,VAL=0""ls1link2:CAT=\"SC: RCV BAD CRC\",INT=900,VAL=0""ls1link2:CAT=\"SC: RCV BAD CRC\",INT=3600,VAL=0""ls1link2 CAT=\"SC: RCV BAD CRC\",INT=86400,VAL=0""ls1link2:CAT=\"C7LNK: DUR IS\",INT=1800,VAL=0""ls1link2:CAT=\"C7LNK: RCV SIO TOT\",INT=1800,VAL=0""ls1link2:CAT=\"C7LNK: XMIT SIO TOT\",INT=1800,VAL=0""ls1link2:CAT=\"C7LNK: RCV SU ERR\",INT=1800,VAL=0"To retrieve a list of system measurements for all the links on your Cisco MGC, log in to the active
Cisco MGC, start an MML session, and enter the following command:rtrv-lnk-ctr:allThe system returns a response similar to the following:
MGC-03 - Media Gateway Controller 2000-08-22 16:32:23M RTRV"ls1link1:CAT=\"SC: RCV FRM TOT\",INT=900,VAL=0""ls1link2:CAT=\"SC: RCV FRM TOT\",INT=900,VAL=0""ls1link2:CAT=\"SC: RCV FRM TOT\",INT=3600,VAL=0""ls1link2:CAT=\"SC: RCV FRM TOT\",INT=86400,VAL=0""ls1link2:CAT=\"SC: XMIT FRM TOT\",INT=900,VAL=0""ls1link2:CAT=\"SC: XMIT FRM TOT\",INT=3600,VAL=0""ls1link2:CAT=\"SC: XMIT FRM TOT\",INT=86400,VAL=0""ls1link2:CAT=\"SC: RCV BAD TOT\",INT=900,VAL=0""ls1link2:CAT=\"SC: RCV BAD TOT\",INT=3600,VAL=0""ls1link2:CAT=\"SC: RCV BAD TOT\",INT=86400,VAL=0""ls2link1:CAT=\"SC: RCV FRM TOT\",INT=900,VAL=0""ls2link1:CAT=\"SC: RCV FRM TOT\",INT=3600,VAL=0""ls2link1:CAT=\"SC: RCV FRM TOT\",INT=86400,VAL=0""ls2link1:CAT=\"SC: XMIT FRM TOT\",INT=900,VAL=0""ls2link1:CAT=\"SC: XMIT FRM TOT\",INT=3600,VAL=0""ls2link1:CAT=\"SC: XMIT FRM TOT\",INT=86400,VAL=0""ls2link1:CAT=\"C7LNK: RCV SU ERR\",INT=1800,VAL=0""ls2link2:CAT=\"SC: RCV FRM TOT\",INT=900,VAL=0""ls2link2:CAT=\"SC: RCV FRM TOT\",INT=3600,VAL=0""ls2link2:CAT=\"SC: RCV FRM TOT\",INT=86400,VAL=0""ls2link2:CAT=\"SC: XMIT FRM TOT\",INT=900,VAL=0""ls2link2:CAT=\"SC: XMIT FRM TOT\",INT=3600,VAL=0""ls2link2:CAT=\"SC: XMIT FRM TOT\",INT=86400,VAL=0""ls2link2:CAT=\"SC: RCV BAD TOT\",INT=900,VAL=0""ls2link2:CAT=\"SC: RCV BAD TOT\",INT=3600,VAL=0"Retrieving SS7 Signaling Point Measurements
You can use the rtrv-sp-ctr MML command to retrieve the system measurements for a single SS7 signaling point or for all SS7 signaling points. For a complete list of system measurements, refer to "Cisco Media Gateway Controller Measurements".
To retrieve a list of system measurements for a single SS7 signaling point, log in to the active
Cisco MGC, start an MML session, and enter the following command:rtrv-sp-ctr:point_codeWhere point_code is the MML name of the SS7 signaling point.
For example, to view the measurements for a point code called dpc2, you would enter the following command:
rtrv-sp-ctr:dpc2The system returns a response similar to the following:
MGC-02 - Media Gateway Controller 2001-06-13 14:08:39M RTRV"dpc2:CAT=\"ISUP: XMIT BLA TOT\",INT=300,VAL=0""dpc2:CAT=\"ISUP: XMIT BLA TOT\",INT=1800,VAL=0""dpc2:CAT=\"ISUP: CHAN MATE UNAVAILABLE\",INT=300,VAL=0""dpc2:CAT=\"ISUP: CHAN MATE UNAVAILABLE\",INT=1800,VAL=0""dpc2:CAT=\"SP: cInit out\",INT=900,VAL=0""dpc2:CAT=\"SP: cInit out\",INT=3600,VAL=0""dpc2:CAT=\"SP: cInit out\",INT=86400,VAL=8""dpc2:CAT=\"SP: PDU in\",INT=900,VAL=0""dpc2:CAT=\"SP: PDU in\",INT=3600,VAL=0""dpc2:CAT=\"SP: PDU in\",INT=86400,VAL=50""dpc2:CAT=\"ISUP: XMIT CGB TOT\",INT=300,VAL=0""dpc2:CAT=\"ISUP: XMIT CGB TOT\",INT=1800,VAL=0""dpc2:CAT=\"ISUP: RCV BLA TOT\",INT=300,VAL=0""dpc2:CAT=\"ISUP: RCV BLA TOT\",INT=1800,VAL=0""dpc2:CAT=\"ISUP: XMIT CQR TOT\",INT=300,VAL=0""dpc2:CAT=\"ISUP: XMIT CQR TOT\",INT=1800,VAL=0""dpc2:CAT=\"ISUP: RCV CQM TOT\",INT=300,VAL=0""dpc2:CAT=\"ISUP: RCV CQM TOT\",INT=1800,VAL=0""dpc2:CAT=\"ISUP: XMIT CVR TOT\",INT=300,VAL=0""dpc2:CAT=\"ISUP: XMIT CVR TOT\",INT=1800,VAL=0""dpc2:CAT=\"ISUP: RCV LPA TOT\",INT=300,VAL=0""dpc2:CAT=\"ISUP: RCV LPA TOT\",INT=1800,VAL=0""dpc2:CAT=\"ISUP: XMIT RSC TOT\",INT=300,VAL=0""dpc2:CAT=\"ISUP: XMIT RSC TOT\",INT=1800,VAL=0""dpc2:CAT=\"ISUP: XMIT ACM TOT\",INT=300,VAL=0""dpc2:CAT=\"ISUP: XMIT ACM TOT\",INT=1800,VAL=0""dpc2:CAT=\"ISUP: XMIT UBA TOT\",INT=300,VAL=0""dpc2:CAT=\"ISUP: XMIT UBA TOT\",INT=1800,VAL=0""dpc2:CAT=\"ISUP: XMIT MSG TOT\",INT=300,VAL=0""dpc2:CAT=\"ISUP: XMIT MSG TOT\",INT=1800,VAL=0""dpc2:CAT=\"ISUP: XMIT CCR TOT\",INT=300,VAL=0""dpc2:CAT=\"ISUP: XMIT CCR TOT\",INT=1800,VAL=0""dpc2:CAT=\"ISUP: RCV UBA TOT\",INT=300,VAL=0""dpc2:CAT=\"ISUP: RCV UBA TOT\",INT=1800,VAL=0""dpc2:CAT=\"ISUP: RCV MSG TOT\",INT=300,VAL=0""dpc2:CAT=\"ISUP: RCV MSG TOT\",INT=1800,VAL=0""dpc2:CAT=\"ISUP: UNEX MSG TOT\",INT=300,VAL=0""dpc2:CAT=\"ISUP: UNEX MSG TOT\",INT=1800,VAL=0""dpc2:CAT=\"ISUP: XMIT IAM TOT\",INT=300,VAL=0""dpc2:CAT=\"ISUP: XMIT IAM TOT\",INT=1800,VAL=0""dpc2:CAT=\"ISUP: RCV IAM TOT\",INT=300,VAL=0""dpc2:CAT=\"ISUP: RCV IAM TOT\",INT=1800,VAL=0""dpc2:CAT=\"ISUP: UNREC MSG TOT\",INT=300,VAL=0""dpc2:CAT=\"ISUP: UNREC MSG TOT\",INT=1800,VAL=0""dpc2:CAT=\"ISUP: RCV CFN TOT\",INT=300,VAL=0""dpc2:CAT=\"ISUP: RCV CFN TOT\",INT=1800,VAL=0""dpc2:CAT=\"ISUP: RCV CCR TOT\",INT=300,VAL=0""dpc2:CAT=\"ISUP: RCV CCR TOT\",INT=1800,VAL=0""dpc2:CAT=\"ISUP: XMIT ANM TOT\",INT=300,VAL=0""dpc2:CAT=\"ISUP: XMIT ANM TOT\",INT=1800,VAL=0""dpc2:CAT=\"ISUP: XMIT COT TOT\",INT=300,VAL=0""dpc2:CAT=\"ISUP: XMIT COT TOT\",INT=1800,VAL=0""dpc2:CAT=\"ISUP: RCV ANM TOT\",INT=300,VAL=0""dpc2:CAT=\"ISUP: RCV ANM TOT\",INT=1800,VAL=0""dpc2:CAT=\"ISUP: RCV INR TOT\",INT=300,VAL=0""dpc2:CAT=\"ISUP: RCV INR TOT\",INT=1800,VAL=0""dpc2:CAT=\"ISUP: RCV COT TOT\",INT=300,VAL=0""dpc2:CAT=\"ISUP: RCV COT TOT\",INT=1800,VAL=0""dpc2:CAT=\"ISUP: XMIT BLO TOT\",INT=300,VAL=0""dpc2:CAT=\"ISUP: XMIT BLO TOT\",INT=1800,VAL=0""dpc2:CAT=\"ISUP: ABN REL TOT\",INT=300,VAL=0""dpc2:CAT=\"ISUP: ABN REL TOT\",INT=1800,VAL=0""dpc2:CAT=\"ISUP: XMIT REL TOT\",INT=300,VAL=0""dpc2:CAT=\"ISUP: XMIT REL TOT\",INT=1800,VAL=0""dpc2:CAT=\"ISUP: RCV CVR TOT\",INT=300,VAL=0""dpc2:CAT=\"ISUP: RCV CVR TOT\",INT=1800,VAL=0""dpc2:CAT=\"ISUP: RCV CGU TOT\",INT=300,VAL=0""dpc2:CAT=\"ISUP: RCV CGU TOT\",INT=1800,VAL=0""dpc2:CAT=\"ISUP: XMIT SUS TOT\",INT=300,VAL=0""dpc2:CAT=\"ISUP: XMIT SUS TOT\",INT=1800,VAL=0""dpc2:CAT=\"ISUP: XMIT CVT TOT\",INT=300,VAL=0""dpc2:CAT=\"ISUP: XMIT CVT TOT\",INT=1800,VAL=0""dpc2:CAT=\"ISUP: XMIT GRA TOT\",INT=300,VAL=0""dpc2:CAT=\"ISUP: XMIT GRA TOT\",INT=1800,VAL=0""dpc2:CAT=\"ISUP: RCV SUS TOT\",INT=300,VAL=0""dpc2:CAT=\"ISUP: RCV SUS TOT\",INT=1800,VAL=0""dpc2:CAT=\"ISUP: RCV FOT TOT\",INT=300,VAL=0""dpc2:CAT=\"ISUP: RCV FOT TOT\",INT=1800,VAL=0""dpc2:CAT=\"ISUP: RCV GRS TOT\",INT=300,VAL=0""dpc2:CAT=\"ISUP: RCV GRS TOT\",INT=1800,VAL=0""dpc2:CAT=\"ISUP: XMIT CFN TOT\",INT=300,VAL=0""dpc2:CAT=\"ISUP: XMIT CFN TOT\",INT=1800,VAL=0""dpc2:CAT=\"ISUP: XMIT UBL TOT\",INT=300,VAL=0""dpc2:CAT=\"ISUP: XMIT UBL TOT\",INT=1800,VAL=0""dpc2:CAT=\"ISUP: RCV CVT TOT\",INT=300,VAL=0""dpc2:CAT=\"ISUP: RCV CVT TOT\",INT=1800,VAL=0""dpc2:CAT=\"ISUP: XMIT LPA TOT\",INT=300,VAL=0""dpc2:CAT=\"ISUP: XMIT LPA TOT\",INT=1800,VAL=0""dpc2:CAT=\"ISUP: XMIT FAC TOT\",INT=300,VAL=0""dpc2:CAT=\"ISUP: XMIT FAC TOT\",INT=1800,VAL=0""dpc2:CAT=\"ISUP: RCV FAC TOT\",INT=300,VAL=0""dpc2:CAT=\"ISUP: RCV FAC TOT\",INT=1800,VAL=0""dpc2:CAT=\"ISUP: RCV CGUA TOT\",INT=300,VAL=0""dpc2:CAT=\"ISUP: RCV CGUA TOT\",INT=1800,VAL=0""dpc2:CAT=\"ISUP: RCV UBL TOT\",INT=300,VAL=0""dpc2:CAT=\"ISUP: RCV UBL TOT\",INT=1800,VAL=0""dpc2:CAT=\"ISUP: XMIT USR TOT\",INT=300,VAL=0""dpc2:CAT=\"ISUP: XMIT USR TOT\",INT=1800,VAL=0""dpc2:CAT=\"ISUP: XMIT CGUA TOT\",INT=300,VAL=0""dpc2:CAT=\"ISUP: XMIT CGUA TOT\",INT=1800,VAL=0""dpc2:CAT=\"ISUP: RCV USR TOT\",INT=300,VAL=0""dpc2:CAT=\"ISUP: RCV USR TOT\",INT=1800,VAL=0""dpc2:CAT=\"ISUP: RCV ACM TOT\",INT=300,VAL=0""dpc2:CAT=\"ISUP: RCV ACM TOT\",INT=1800,VAL=0""dpc2:CAT=\"ISUP: XMIT FOT TOT\",INT=300,VAL=0""dpc2:CAT=\"ISUP: XMIT FOT TOT\",INT=1800,VAL=0""dpc2:CAT=\"ISUP: XMIT PAM TOT\",INT=300,VAL=0""dpc2:CAT=\"ISUP: XMIT PAM TOT\",INT=1800,VAL=0""dpc2:CAT=\"ISUP: RCV CGB TOT\",INT=300,VAL=0""dpc2:CAT=\"ISUP: RCV CGB TOT\",INT=1800,VAL=0""dpc2:CAT=\"ISUP: RCV RLC TOT\",INT=300,VAL=0""dpc2:CAT=\"ISUP: RCV RLC TOT\",INT=1800,VAL=0""dpc2:CAT=\"ISUP: RCV REL TOT\",INT=300,VAL=0""dpc2:CAT=\"ISUP: RCV REL TOT\",INT=1800,VAL=0""dpc2:CAT=\"ISUP: RCV CRM TOT\",INT=300,VAL=0""dpc2:CAT=\"ISUP: RCV CRM TOT\",INT=1800,VAL=0""dpc2:CAT=\"ISUP: XMIT CGBA TOT\",INT=300,VAL=0""dpc2:CAT=\"ISUP: XMIT CGBA TOT\",INT=1800,VAL=0""dpc2:CAT=\"ISUP: XMIT RLC TOT\",INT=300,VAL=0""dpc2:CAT=\"ISUP: XMIT RLC TOT\",INT=1800,VAL=0""dpc2:CAT=\"C7SP: SP DUR UNAVAIL\",INT=300,VAL=0""dpc2:CAT=\"C7SP: SP DUR UNAVAIL\",INT=1800,VAL=0""dpc2:CAT=\"ISUP: XMIT CRM TOT\",INT=300,VAL=0""dpc2:CAT=\"ISUP: XMIT CRM TOT\",INT=1800,VAL=0""dpc2:CAT=\"ISUP: RCV UCIC TOT\",INT=300,VAL=0""dpc2:CAT=\"ISUP: RCV UCIC TOT\",INT=1800,VAL=0""dpc2:CAT=\"ISUP: RCV CGBA TOT\",INT=300,VAL=0""dpc2:CAT=\"ISUP: RCV CGBA TOT\",INT=1800,VAL=0""dpc2:CAT=\"C7SP: XMIT MSU DROP/RTE\",INT=1800,VAL=0""dpc2:CAT=\"ISUP: XMIT GRS TOT\",INT=300,VAL=0""dpc2:CAT=\"ISUP: XMIT GRS TOT\",INT=1800,VAL=0""dpc2:CAT=\"ISUP: RCV RSC TOT\",INT=300,VAL=0""dpc2:CAT=\"ISUP: RCV RSC TOT\",INT=1800,VAL=0""dpc2:CAT=\"ISUP: XMIT RES TOT\",INT=300,VAL=0""dpc2:CAT=\"ISUP: XMIT RES TOT\",INT=1800,VAL=0""dpc2:CAT=\"ISUP: XMIT UCIC TOT\",INT=300,VAL=0""dpc2:CAT=\"ISUP: XMIT UCIC TOT\",INT=1800,VAL=0""dpc2:CAT=\"ISUP: RCV RES TOT\",INT=300,VAL=0""dpc2:CAT=\"ISUP: RCV RES TOT\",INT=1800,VAL=0""dpc2:CAT=\"ISUP: RCV PAM TOT\",INT=300,VAL=0""dpc2:CAT=\"ISUP: RCV PAM TOT\",INT=1800,VAL=0""dpc2:CAT=\"ISUP: RCV GRA TOT\",INT=300,VAL=0""dpc2:CAT=\"ISUP: RCV GRA TOT\",INT=1800,VAL=0""dpc2:CAT=\"ISUP: XMIT EXM TOT\",INT=300,VAL=0""dpc2:CAT=\"ISUP: XMIT EXM TOT\",INT=1800,VAL=0""dpc2:CAT=\"ISUP: XMIT CGU TOT\",INT=300,VAL=0""dpc2:CAT=\"ISUP: XMIT CGU TOT\",INT=1800,VAL=0""dpc2:CAT=\"ISUP: RCV EXM TOT\",INT=300,VAL=0""dpc2:CAT=\"ISUP: RCV EXM TOT\",INT=1800,VAL=0""dpc2:CAT=\"ISUP: XMIT INF TOT\",INT=300,VAL=0""dpc2:CAT=\"ISUP: XMIT INF TOT\",INT=1800,VAL=0""dpc2:CAT=\"ISUP: XMIT CQM TOT\",INT=300,VAL=0""dpc2:CAT=\"ISUP: XMIT CQM TOT\",INT=1800,VAL=0""dpc2:CAT=\"ISUP: RCV INF TOT\",INT=300,VAL=0""dpc2:CAT=\"ISUP: RCV INF TOT\",INT=1800,VAL=0""dpc2:CAT=\"ISUP: RCV BLO TOT\",INT=300,VAL=0""dpc2:CAT=\"ISUP: RCV BLO TOT\",INT=1800,VAL=0""dpc2:CAT=\"SP: cInit in\",INT=900,VAL=0""dpc2:CAT=\"SP: cInit in\",INT=3600,VAL=0""dpc2:CAT=\"SP: cInit in\",INT=86400,VAL=17""dpc2:CAT=\"ISUP: XMIT CPG TOT\",INT=300,VAL=0""dpc2:CAT=\"ISUP: XMIT CPG TOT\",INT=1800,VAL=0""dpc2:CAT=\"SP: PDU out\",INT=900,VAL=0""dpc2:CAT=\"SP: PDU out\",INT=3600,VAL=0""dpc2:CAT=\"SP: PDU out\",INT=86400,VAL=99""dpc2:CAT=\"ISUP: RCV CQR TOT\",INT=300,VAL=0""dpc2:CAT=\"ISUP: RCV CQR TOT\",INT=1800,VAL=0""dpc2:CAT=\"ISUP: XMIT CRA TOT\",INT=300,VAL=0""dpc2:CAT=\"ISUP: XMIT CRA TOT\",INT=1800,VAL=0""dpc2:CAT=\"ISUP: RCV CPG TOT\",INT=300,VAL=0""dpc2:CAT=\"ISUP: RCV CPG TOT\",INT=1800,VAL=0""dpc2:CAT=\"ISUP: XMIT INR TOT\",INT=300,VAL=0""dpc2:CAT=\"ISUP: XMIT INR TOT\",INT=1800,VAL=0""dpc2:CAT=\"ISUP: RCV CRA TOT\",INT=300,VAL=0""dpc2:CAT=\"ISUP: RCV CRA TOT\",INT=1800,VAL=0"To retrieve a list of system measurements for all the SS7 signaling points on your Cisco MGC, log in to the active Cisco MGC, start an MML session, and enter the following command:
rtrv-sp-ctr:allThe system returns a response similar to the following:
MGC-02 - Media Gateway Controller 2001-06-13 14:08:39M RTRV"opc2"/* No active counters found for this component/category */"dpc2:CAT=\"ISUP: XMIT BLA TOT\",INT=300,VAL=0""dpc2:CAT=\"ISUP: XMIT BLA TOT\",INT=1800,VAL=0""dpc2:CAT=\"ISUP: CHAN MATE UNAVAILABLE\",INT=300,VAL=0""dpc2:CAT=\"ISUP: CHAN MATE UNAVAILABLE\",INT=1800,VAL=0""dpc2:CAT=\"SP: cInit out\",INT=900,VAL=0""dpc2:CAT=\"SP: cInit out\",INT=3600,VAL=0""dpc2:CAT=\"SP: cInit out\",INT=86400,VAL=8""dpc2:CAT=\"SP: PDU in\",INT=900,VAL=0""dpc2:CAT=\"SP: PDU in\",INT=3600,VAL=0""dpc2:CAT=\"SP: PDU in\",INT=86400,VAL=50""dpc2:CAT=\"ISUP: XMIT CGB TOT\",INT=300,VAL=0""dpc2:CAT=\"ISUP: XMIT CGB TOT\",INT=1800,VAL=0""dpc2:CAT=\"ISUP: RCV BLA TOT\",INT=300,VAL=0""dpc2:CAT=\"ISUP: RCV BLA TOT\",INT=1800,VAL=0""dpc2:CAT=\"ISUP: XMIT CQR TOT\",INT=300,VAL=0""dpc2:CAT=\"ISUP: XMIT CQR TOT\",INT=1800,VAL=0""dpc2:CAT=\"ISUP: RCV CQM TOT\",INT=300,VAL=0""dpc2:CAT=\"ISUP: RCV CQM TOT\",INT=1800,VAL=0""dpc2:CAT=\"ISUP: XMIT CVR TOT\",INT=300,VAL=0""dpc2:CAT=\"ISUP: XMIT CVR TOT\",INT=1800,VAL=0""dpc2:CAT=\"ISUP: RCV LPA TOT\",INT=300,VAL=0""dpc2:CAT=\"ISUP: RCV LPA TOT\",INT=1800,VAL=0""dpc2:CAT=\"ISUP: XMIT RSC TOT\",INT=300,VAL=0""dpc2:CAT=\"ISUP: XMIT RSC TOT\",INT=1800,VAL=0""dpc2:CAT=\"ISUP: XMIT ACM TOT\",INT=300,VAL=0""dpc2:CAT=\"ISUP: XMIT ACM TOT\",INT=1800,VAL=0""dpc2:CAT=\"ISUP: XMIT UBA TOT\",INT=300,VAL=0""dpc2:CAT=\"ISUP: XMIT UBA TOT\",INT=1800,VAL=0""dpc2:CAT=\"ISUP: XMIT MSG TOT\",INT=300,VAL=0""dpc2:CAT=\"ISUP: XMIT MSG TOT\",INT=1800,VAL=0""dpc2:CAT=\"ISUP: XMIT CCR TOT\",INT=300,VAL=0""dpc2:CAT=\"ISUP: XMIT CCR TOT\",INT=1800,VAL=0""dpc2:CAT=\"ISUP: RCV UBA TOT\",INT=300,VAL=0""dpc2:CAT=\"ISUP: RCV UBA TOT\",INT=1800,VAL=0""dpc2:CAT=\"ISUP: RCV MSG TOT\",INT=300,VAL=0""dpc2:CAT=\"ISUP: RCV MSG TOT\",INT=1800,VAL=0""dpc2:CAT=\"ISUP: UNEX MSG TOT\",INT=300,VAL=0""dpc2:CAT=\"ISUP: UNEX MSG TOT\",INT=1800,VAL=0""dpc2:CAT=\"ISUP: XMIT IAM TOT\",INT=300,VAL=0""dpc2:CAT=\"ISUP: XMIT IAM TOT\",INT=1800,VAL=0""dpc2:CAT=\"ISUP: RCV IAM TOT\",INT=300,VAL=0""dpc2:CAT=\"ISUP: RCV IAM TOT\",INT=1800,VAL=0""dpc2:CAT=\"ISUP: UNREC MSG TOT\",INT=300,VAL=0""dpc2:CAT=\"ISUP: UNREC MSG TOT\",INT=1800,VAL=0""dpc2:CAT=\"ISUP: RCV CFN TOT\",INT=300,VAL=0""dpc2:CAT=\"ISUP: RCV CFN TOT\",INT=1800,VAL=0""dpc2:CAT=\"ISUP: RCV CCR TOT\",INT=300,VAL=0""dpc2:CAT=\"ISUP: RCV CCR TOT\",INT=1800,VAL=0""dpc2:CAT=\"ISUP: XMIT ANM TOT\",INT=300,VAL=0""dpc2:CAT=\"ISUP: XMIT ANM TOT\",INT=1800,VAL=0""dpc2:CAT=\"ISUP: XMIT COT TOT\",INT=300,VAL=0""dpc2:CAT=\"ISUP: XMIT COT TOT\",INT=1800,VAL=0""dpc2:CAT=\"ISUP: RCV ANM TOT\",INT=300,VAL=0""dpc2:CAT=\"ISUP: RCV ANM TOT\",INT=1800,VAL=0""dpc2:CAT=\"ISUP: RCV INR TOT\",INT=300,VAL=0""dpc2:CAT=\"ISUP: RCV INR TOT\",INT=1800,VAL=0""dpc2:CAT=\"ISUP: RCV COT TOT\",INT=300,VAL=0""dpc2:CAT=\"ISUP: RCV COT TOT\",INT=1800,VAL=0""dpc2:CAT=\"ISUP: XMIT BLO TOT\",INT=300,VAL=0""dpc2:CAT=\"ISUP: XMIT BLO TOT\",INT=1800,VAL=0""dpc2:CAT=\"ISUP: ABN REL TOT\",INT=300,VAL=0""dpc2:CAT=\"ISUP: ABN REL TOT\",INT=1800,VAL=0""dpc2:CAT=\"ISUP: XMIT REL TOT\",INT=300,VAL=0""dpc2:CAT=\"ISUP: XMIT REL TOT\",INT=1800,VAL=0""dpc2:CAT=\"ISUP: RCV CVR TOT\",INT=300,VAL=0""dpc2:CAT=\"ISUP: RCV CVR TOT\",INT=1800,VAL=0""dpc2:CAT=\"ISUP: RCV CGU TOT\",INT=300,VAL=0""dpc2:CAT=\"ISUP: RCV CGU TOT\",INT=1800,VAL=0""dpc2:CAT=\"ISUP: XMIT SUS TOT\",INT=300,VAL=0""dpc2:CAT=\"ISUP: XMIT SUS TOT\",INT=1800,VAL=0""dpc2:CAT=\"ISUP: XMIT CVT TOT\",INT=300,VAL=0""dpc2:CAT=\"ISUP: XMIT CVT TOT\",INT=1800,VAL=0""dpc2:CAT=\"ISUP: XMIT GRA TOT\",INT=300,VAL=0""dpc2:CAT=\"ISUP: XMIT GRA TOT\",INT=1800,VAL=0""dpc2:CAT=\"ISUP: RCV SUS TOT\",INT=300,VAL=0""dpc2:CAT=\"ISUP: RCV SUS TOT\",INT=1800,VAL=0""dpc2:CAT=\"ISUP: RCV FOT TOT\",INT=300,VAL=0""dpc2:CAT=\"ISUP: RCV FOT TOT\",INT=1800,VAL=0""dpc2:CAT=\"ISUP: RCV GRS TOT\",INT=300,VAL=0""dpc2:CAT=\"ISUP: RCV GRS TOT\",INT=1800,VAL=0""dpc2:CAT=\"ISUP: XMIT CFN TOT\",INT=300,VAL=0""dpc2:CAT=\"ISUP: XMIT CFN TOT\",INT=1800,VAL=0""dpc2:CAT=\"ISUP: XMIT UBL TOT\",INT=300,VAL=0""dpc2:CAT=\"ISUP: XMIT UBL TOT\",INT=1800,VAL=0""dpc2:CAT=\"ISUP: RCV CVT TOT\",INT=300,VAL=0""dpc2:CAT=\"ISUP: RCV CVT TOT\",INT=1800,VAL=0""dpc2:CAT=\"ISUP: XMIT LPA TOT\",INT=300,VAL=0""dpc2:CAT=\"ISUP: XMIT LPA TOT\",INT=1800,VAL=0""dpc2:CAT=\"ISUP: XMIT FAC TOT\",INT=300,VAL=0""dpc2:CAT=\"ISUP: XMIT FAC TOT\",INT=1800,VAL=0""dpc2:CAT=\"ISUP: RCV FAC TOT\",INT=300,VAL=0""dpc2:CAT=\"ISUP: RCV FAC TOT\",INT=1800,VAL=0""dpc2:CAT=\"ISUP: RCV CGUA TOT\",INT=300,VAL=0""dpc2:CAT=\"ISUP: RCV CGUA TOT\",INT=1800,VAL=0""dpc2:CAT=\"ISUP: RCV UBL TOT\",INT=300,VAL=0""dpc2:CAT=\"ISUP: RCV UBL TOT\",INT=1800,VAL=0""dpc2:CAT=\"ISUP: XMIT USR TOT\",INT=300,VAL=0""dpc2:CAT=\"ISUP: XMIT USR TOT\",INT=1800,VAL=0""dpc2:CAT=\"ISUP: XMIT CGUA TOT\",INT=300,VAL=0""dpc2:CAT=\"ISUP: XMIT CGUA TOT\",INT=1800,VAL=0""dpc2:CAT=\"ISUP: RCV USR TOT\",INT=300,VAL=0""dpc2:CAT=\"ISUP: RCV USR TOT\",INT=1800,VAL=0""dpc2:CAT=\"ISUP: RCV ACM TOT\",INT=300,VAL=0""dpc2:CAT=\"ISUP: RCV ACM TOT\",INT=1800,VAL=0""dpc2:CAT=\"ISUP: XMIT FOT TOT\",INT=300,VAL=0""dpc2:CAT=\"ISUP: XMIT FOT TOT\",INT=1800,VAL=0""dpc2:CAT=\"ISUP: XMIT PAM TOT\",INT=300,VAL=0""dpc2:CAT=\"ISUP: XMIT PAM TOT\",INT=1800,VAL=0""dpc2:CAT=\"ISUP: RCV CGB TOT\",INT=300,VAL=0""dpc2:CAT=\"ISUP: RCV CGB TOT\",INT=1800,VAL=0""dpc2:CAT=\"ISUP: RCV RLC TOT\",INT=300,VAL=0""dpc2:CAT=\"ISUP: RCV RLC TOT\",INT=1800,VAL=0""dpc2:CAT=\"ISUP: RCV REL TOT\",INT=300,VAL=0""dpc2:CAT=\"ISUP: RCV REL TOT\",INT=1800,VAL=0""dpc2:CAT=\"ISUP: RCV CRM TOT\",INT=300,VAL=0""dpc2:CAT=\"ISUP: RCV CRM TOT\",INT=1800,VAL=0""dpc2:CAT=\"ISUP: XMIT CGBA TOT\",INT=300,VAL=0""dpc2:CAT=\"ISUP: XMIT CGBA TOT\",INT=1800,VAL=0""dpc2:CAT=\"ISUP: XMIT RLC TOT\",INT=300,VAL=0""dpc2:CAT=\"ISUP: XMIT RLC TOT\",INT=1800,VAL=0""dpc2:CAT=\"C7SP: SP DUR UNAVAIL\",INT=300,VAL=0""dpc2:CAT=\"C7SP: SP DUR UNAVAIL\",INT=1800,VAL=0""dpc2:CAT=\"ISUP: XMIT CRM TOT\",INT=300,VAL=0""dpc2:CAT=\"ISUP: XMIT CRM TOT\",INT=1800,VAL=0""dpc2:CAT=\"ISUP: RCV UCIC TOT\",INT=300,VAL=0""dpc2:CAT=\"ISUP: RCV UCIC TOT\",INT=1800,VAL=0""dpc2:CAT=\"ISUP: RCV CGBA TOT\",INT=300,VAL=0""dpc2:CAT=\"ISUP: RCV CGBA TOT\",INT=1800,VAL=0""dpc2:CAT=\"C7SP: XMIT MSU DROP/RTE\",INT=1800,VAL=0""dpc2:CAT=\"ISUP: XMIT GRS TOT\",INT=300,VAL=0""dpc2:CAT=\"ISUP: XMIT GRS TOT\",INT=1800,VAL=0""dpc2:CAT=\"ISUP: RCV RSC TOT\",INT=300,VAL=0""dpc2:CAT=\"ISUP: RCV RSC TOT\",INT=1800,VAL=0""dpc2:CAT=\"ISUP: XMIT RES TOT\",INT=300,VAL=0""dpc2:CAT=\"ISUP: XMIT RES TOT\",INT=1800,VAL=0""dpc2:CAT=\"ISUP: XMIT UCIC TOT\",INT=300,VAL=0""dpc2:CAT=\"ISUP: XMIT UCIC TOT\",INT=1800,VAL=0""dpc2:CAT=\"ISUP: RCV RES TOT\",INT=300,VAL=0""dpc2:CAT=\"ISUP: RCV RES TOT\",INT=1800,VAL=0""dpc2:CAT=\"ISUP: RCV PAM TOT\",INT=300,VAL=0""dpc2:CAT=\"ISUP: RCV PAM TOT\",INT=1800,VAL=0""dpc2:CAT=\"ISUP: RCV GRA TOT\",INT=300,VAL=0""dpc2:CAT=\"ISUP: RCV GRA TOT\",INT=1800,VAL=0""dpc2:CAT=\"ISUP: XMIT EXM TOT\",INT=300,VAL=0""dpc2:CAT=\"ISUP: XMIT EXM TOT\",INT=1800,VAL=0""dpc2:CAT=\"ISUP: XMIT CGU TOT\",INT=300,VAL=0""dpc2:CAT=\"ISUP: XMIT CGU TOT\",INT=1800,VAL=0""dpc2:CAT=\"ISUP: RCV EXM TOT\",INT=300,VAL=0""dpc2:CAT=\"ISUP: RCV EXM TOT\",INT=1800,VAL=0""dpc2:CAT=\"ISUP: XMIT INF TOT\",INT=300,VAL=0""dpc2:CAT=\"ISUP: XMIT INF TOT\",INT=1800,VAL=0""dpc2:CAT=\"ISUP: XMIT CQM TOT\",INT=300,VAL=0""dpc2:CAT=\"ISUP: XMIT CQM TOT\",INT=1800,VAL=0""dpc2:CAT=\"ISUP: RCV INF TOT\",INT=300,VAL=0""dpc2:CAT=\"ISUP: RCV INF TOT\",INT=1800,VAL=0""dpc2:CAT=\"ISUP: RCV BLO TOT\",INT=300,VAL=0""dpc2:CAT=\"ISUP: RCV BLO TOT\",INT=1800,VAL=0""dpc2:CAT=\"SP: cInit in\",INT=900,VAL=0""dpc2:CAT=\"SP: cInit in\",INT=3600,VAL=0""dpc2:CAT=\"SP: cInit in\",INT=86400,VAL=17""dpc2:CAT=\"ISUP: XMIT CPG TOT\",INT=300,VAL=0""dpc2:CAT=\"ISUP: XMIT CPG TOT\",INT=1800,VAL=0""dpc2:CAT=\"SP: PDU out\",INT=900,VAL=0""dpc2:CAT=\"SP: PDU out\",INT=3600,VAL=0""dpc2:CAT=\"SP: PDU out\",INT=86400,VAL=99""dpc2:CAT=\"ISUP: RCV CQR TOT\",INT=300,VAL=0""dpc2:CAT=\"ISUP: RCV CQR TOT\",INT=1800,VAL=0""dpc2:CAT=\"ISUP: XMIT CRA TOT\",INT=300,VAL=0""dpc2:CAT=\"ISUP: XMIT CRA TOT\",INT=1800,VAL=0""dpc2:CAT=\"ISUP: RCV CPG TOT\",INT=300,VAL=0""dpc2:CAT=\"ISUP: RCV CPG TOT\",INT=1800,VAL=0""dpc2:CAT=\"ISUP: XMIT INR TOT\",INT=300,VAL=0""dpc2:CAT=\"ISUP: XMIT INR TOT\",INT=1800,VAL=0""dpc2:CAT=\"ISUP: RCV CRA TOT\",INT=300,VAL=0""dpc2:CAT=\"ISUP: RCV CRA TOT\",INT=1800,VAL=0""opc1"/* No active counters found for this component/category */"dpc1:CAT=\"ISUP: XMIT BLA TOT\",INT=300,VAL=0""dpc1:CAT=\"ISUP: XMIT BLA TOT\",INT=1800,VAL=0""dpc1:CAT=\"ISUP: CHAN MATE UNAVAILABLE\",INT=300,VAL=0""dpc1:CAT=\"ISUP: CHAN MATE UNAVAILABLE\",INT=1800,VAL=0""dpc1:CAT=\"SP: cInit out\",INT=900,VAL=0""dpc1:CAT=\"SP: cInit out\",INT=3600,VAL=0""dpc1:CAT=\"SP: cInit out\",INT=86400,VAL=1""dpc1:CAT=\"SP: PDU in\",INT=900,VAL=0""dpc1:CAT=\"SP: PDU in\",INT=3600,VAL=0""dpc1:CAT=\"SP: PDU in\",INT=86400,VAL=13""dpc1:CAT=\"ISUP: XMIT CGB TOT\",INT=300,VAL=0""dpc1:CAT=\"ISUP: XMIT CGB TOT\",INT=1800,VAL=0""dpc1:CAT=\"ISUP: RCV BLA TOT\",INT=300,VAL=0""dpc1:CAT=\"ISUP: RCV BLA TOT\",INT=1800,VAL=0""dpc1:CAT=\"ISUP: XMIT CQR TOT\",INT=300,VAL=0""dpc1:CAT=\"ISUP: XMIT CQR TOT\",INT=1800,VAL=0""dpc1:CAT=\"ISUP: RCV CQM TOT\",INT=300,VAL=0""dpc1:CAT=\"ISUP: RCV CQM TOT\",INT=1800,VAL=0""dpc1:CAT=\"ISUP: XMIT CVR TOT\",INT=300,VAL=0""dpc1:CAT=\"ISUP: XMIT CVR TOT\",INT=1800,VAL=0""dpc1:CAT=\"ISUP: RCV LPA TOT\",INT=300,VAL=0""dpc1:CAT=\"ISUP: RCV LPA TOT\",INT=1800,VAL=0""dpc1:CAT=\"ISUP: XMIT RSC TOT\",INT=300,VAL=0""dpc1:CAT=\"ISUP: XMIT RSC TOT\",INT=1800,VAL=0""dpc1:CAT=\"ISUP: XMIT ACM TOT\",INT=300,VAL=0""dpc1:CAT=\"ISUP: XMIT ACM TOT\",INT=1800,VAL=0""dpc1:CAT=\"ISUP: XMIT UBA TOT\",INT=300,VAL=0""dpc1:CAT=\"ISUP: XMIT UBA TOT\",INT=1800,VAL=0""dpc1:CAT=\"ISUP: XMIT MSG TOT\",INT=300,VAL=0""dpc1:CAT=\"ISUP: XMIT MSG TOT\",INT=1800,VAL=0""dpc1:CAT=\"ISUP: XMIT CCR TOT\",INT=300,VAL=0""dpc1:CAT=\"ISUP: XMIT CCR TOT\",INT=1800,VAL=0""dpc1:CAT=\"ISUP: RCV UBA TOT\",INT=300,VAL=0""dpc1:CAT=\"ISUP: RCV UBA TOT\",INT=1800,VAL=0""dpc1:CAT=\"ISUP: RCV MSG TOT\",INT=300,VAL=0""dpc1:CAT=\"ISUP: RCV MSG TOT\",INT=1800,VAL=0""dpc1:CAT=\"ISUP: UNEX MSG TOT\",INT=300,VAL=0""dpc1:CAT=\"ISUP: UNEX MSG TOT\",INT=1800,VAL=0""dpc1:CAT=\"ISUP: XMIT IAM TOT\",INT=300,VAL=0""dpc1:CAT=\"ISUP: XMIT IAM TOT\",INT=1800,VAL=0""dpc1:CAT=\"ISUP: UNREC MSG TOT\",INT=300,VAL=0""dpc1:CAT=\"ISUP: UNREC MSG TOT\",INT=1800,VAL=0""dpc1:CAT=\"ISUP: RCV IAM TOT\",INT=300,VAL=0""dpc1:CAT=\"ISUP: RCV IAM TOT\",INT=1800,VAL=0""dpc1:CAT=\"ISUP: RCV CFN TOT\",INT=300,VAL=0""dpc1:CAT=\"ISUP: RCV CFN TOT\",INT=1800,VAL=0""dpc1:CAT=\"ISUP: RCV CCR TOT\",INT=300,VAL=0""dpc1:CAT=\"ISUP: RCV CCR TOT\",INT=1800,VAL=0""dpc1:CAT=\"ISUP: XMIT ANM TOT\",INT=300,VAL=0""dpc1:CAT=\"ISUP: XMIT ANM TOT\",INT=1800,VAL=0""dpc1:CAT=\"ISUP: XMIT COT TOT\",INT=300,VAL=0""dpc1:CAT=\"ISUP: XMIT COT TOT\",INT=1800,VAL=0""dpc1:CAT=\"ISUP: RCV ANM TOT\",INT=300,VAL=0""dpc1:CAT=\"ISUP: RCV ANM TOT\",INT=1800,VAL=0""dpc1:CAT=\"ISUP: RCV INR TOT\",INT=300,VAL=0""dpc1:CAT=\"ISUP: RCV INR TOT\",INT=1800,VAL=0""dpc1:CAT=\"ISUP: RCV COT TOT\",INT=300,VAL=0""dpc1:CAT=\"ISUP: RCV COT TOT\",INT=1800,VAL=0""dpc1:CAT=\"ISUP: XMIT BLO TOT\",INT=300,VAL=0""dpc1:CAT=\"ISUP: XMIT BLO TOT\",INT=1800,VAL=0""dpc1:CAT=\"ISUP: ABN REL TOT\",INT=300,VAL=0""dpc1:CAT=\"ISUP: ABN REL TOT\",INT=1800,VAL=0""dpc1:CAT=\"ISUP: XMIT REL TOT\",INT=300,VAL=0""dpc1:CAT=\"ISUP: XMIT REL TOT\",INT=1800,VAL=0""dpc1:CAT=\"ISUP: RCV CVR TOT\",INT=300,VAL=0""dpc1:CAT=\"ISUP: RCV CVR TOT\",INT=1800,VAL=0""dpc1:CAT=\"ISUP: RCV CGU TOT\",INT=300,VAL=0""dpc1:CAT=\"ISUP: RCV CGU TOT\",INT=1800,VAL=0""dpc1:CAT=\"ISUP: XMIT SUS TOT\",INT=300,VAL=0""dpc1:CAT=\"ISUP: XMIT SUS TOT\",INT=1800,VAL=0""dpc1:CAT=\"ISUP: XMIT CVT TOT\",INT=300,VAL=0""dpc1:CAT=\"ISUP: XMIT CVT TOT\",INT=1800,VAL=0""dpc1:CAT=\"ISUP: XMIT GRA TOT\",INT=300,VAL=0""dpc1:CAT=\"ISUP: XMIT GRA TOT\",INT=1800,VAL=0""dpc1:CAT=\"ISUP: RCV SUS TOT\",INT=300,VAL=0""dpc1:CAT=\"ISUP: RCV SUS TOT\",INT=1800,VAL=0""dpc1:CAT=\"ISUP: RCV FOT TOT\",INT=300,VAL=0""dpc1:CAT=\"ISUP: RCV FOT TOT\",INT=1800,VAL=0""dpc1:CAT=\"ISUP: RCV GRS TOT\",INT=300,VAL=0""dpc1:CAT=\"ISUP: RCV GRS TOT\",INT=1800,VAL=0""dpc1:CAT=\"ISUP: XMIT CFN TOT\",INT=300,VAL=0""dpc1:CAT=\"ISUP: XMIT CFN TOT\",INT=1800,VAL=0""dpc1:CAT=\"ISUP: XMIT UBL TOT\",INT=300,VAL=0""dpc1:CAT=\"ISUP: XMIT UBL TOT\",INT=1800,VAL=0""dpc1:CAT=\"ISUP: RCV CVT TOT\",INT=300,VAL=0""dpc1:CAT=\"ISUP: RCV CVT TOT\",INT=1800,VAL=0""dpc1:CAT=\"ISUP: XMIT LPA TOT\",INT=300,VAL=0""dpc1:CAT=\"ISUP: XMIT LPA TOT\",INT=1800,VAL=0""dpc1:CAT=\"ISUP: XMIT FAC TOT\",INT=300,VAL=0""dpc1:CAT=\"ISUP: XMIT FAC TOT\",INT=1800,VAL=0""dpc1:CAT=\"ISUP: RCV FAC TOT\",INT=300,VAL=0""dpc1:CAT=\"ISUP: RCV FAC TOT\",INT=1800,VAL=0""dpc1:CAT=\"ISUP: RCV CGUA TOT\",INT=300,VAL=0""dpc1:CAT=\"ISUP: RCV CGUA TOT\",INT=1800,VAL=0""dpc1:CAT=\"ISUP: RCV UBL TOT\",INT=300,VAL=0""dpc1:CAT=\"ISUP: RCV UBL TOT\",INT=1800,VAL=0""dpc1:CAT=\"ISUP: XMIT USR TOT\",INT=300,VAL=0""dpc1:CAT=\"ISUP: XMIT USR TOT\",INT=1800,VAL=0""dpc1:CAT=\"ISUP: XMIT CGUA TOT\",INT=300,VAL=0""dpc1:CAT=\"ISUP: XMIT CGUA TOT\",INT=1800,VAL=0""dpc1:CAT=\"ISUP: RCV USR TOT\",INT=300,VAL=0""dpc1:CAT=\"ISUP: RCV USR TOT\",INT=1800,VAL=0""dpc1:CAT=\"ISUP: RCV ACM TOT\",INT=300,VAL=0""dpc1:CAT=\"ISUP: RCV ACM TOT\",INT=1800,VAL=0""dpc1:CAT=\"ISUP: XMIT FOT TOT\",INT=300,VAL=0""dpc1:CAT=\"ISUP: XMIT FOT TOT\",INT=1800,VAL=0""dpc1:CAT=\"ISUP: XMIT PAM TOT\",INT=300,VAL=0""dpc1:CAT=\"ISUP: XMIT PAM TOT\",INT=1800,VAL=0""dpc1:CAT=\"ISUP: RCV CGB TOT\",INT=300,VAL=0""dpc1:CAT=\"ISUP: RCV CGB TOT\",INT=1800,VAL=0""dpc1:CAT=\"ISUP: RCV RLC TOT\",INT=300,VAL=0""dpc1:CAT=\"ISUP: RCV RLC TOT\",INT=1800,VAL=0""dpc1:CAT=\"ISUP: RCV REL TOT\",INT=300,VAL=0""dpc1:CAT=\"ISUP: RCV REL TOT\",INT=1800,VAL=0""dpc1:CAT=\"ISUP: RCV CRM TOT\",INT=300,VAL=0""dpc1:CAT=\"ISUP: RCV CRM TOT\",INT=1800,VAL=0""dpc1:CAT=\"ISUP: XMIT CGBA TOT\",INT=300,VAL=0""dpc1:CAT=\"ISUP: XMIT CGBA TOT\",INT=1800,VAL=0""dpc1:CAT=\"ISUP: XMIT RLC TOT\",INT=300,VAL=0""dpc1:CAT=\"ISUP: XMIT RLC TOT\",INT=1800,VAL=0""dpc1:CAT=\"C7SP: SP DUR UNAVAIL\",INT=300,VAL=0""dpc1:CAT=\"C7SP: SP DUR UNAVAIL\",INT=1800,VAL=0""dpc1:CAT=\"ISUP: XMIT CRM TOT\",INT=300,VAL=0""dpc1:CAT=\"ISUP: XMIT CRM TOT\",INT=1800,VAL=0""dpc1:CAT=\"ISUP: RCV UCIC TOT\",INT=300,VAL=0""dpc1:CAT=\"ISUP: RCV UCIC TOT\",INT=1800,VAL=0""dpc1:CAT=\"ISUP: RCV CGBA TOT\",INT=300,VAL=0""dpc1:CAT=\"ISUP: RCV CGBA TOT\",INT=1800,VAL=0""dpc1:CAT=\"C7SP: XMIT MSU DROP/RTE\",INT=1800,VAL=0""dpc1:CAT=\"ISUP: XMIT GRS TOT\",INT=300,VAL=0""dpc1:CAT=\"ISUP: XMIT GRS TOT\",INT=1800,VAL=0""dpc1:CAT=\"ISUP: RCV RSC TOT\",INT=300,VAL=0""dpc1:CAT=\"ISUP: RCV RSC TOT\",INT=1800,VAL=0""dpc1:CAT=\"ISUP: XMIT RES TOT\",INT=300,VAL=0""dpc1:CAT=\"ISUP: XMIT RES TOT\",INT=1800,VAL=0""dpc1:CAT=\"ISUP: XMIT UCIC TOT\",INT=300,VAL=0""dpc1:CAT=\"ISUP: XMIT UCIC TOT\",INT=1800,VAL=0""dpc1:CAT=\"ISUP: RCV RES TOT\",INT=300,VAL=0""dpc1:CAT=\"ISUP: RCV RES TOT\",INT=1800,VAL=0""dpc1:CAT=\"ISUP: RCV PAM TOT\",INT=300,VAL=0""dpc1:CAT=\"ISUP: RCV PAM TOT\",INT=1800,VAL=0""dpc1:CAT=\"ISUP: RCV GRA TOT\",INT=300,VAL=0""dpc1:CAT=\"ISUP: RCV GRA TOT\",INT=1800,VAL=0""dpc1:CAT=\"ISUP: XMIT EXM TOT\",INT=300,VAL=0""dpc1:CAT=\"ISUP: XMIT EXM TOT\",INT=1800,VAL=0""dpc1:CAT=\"ISUP: XMIT CGU TOT\",INT=300,VAL=0""dpc1:CAT=\"ISUP: XMIT CGU TOT\",INT=1800,VAL=0""dpc1:CAT=\"ISUP: RCV EXM TOT\",INT=300,VAL=0""dpc1:CAT=\"ISUP: RCV EXM TOT\",INT=1800,VAL=0""dpc1:CAT=\"ISUP: XMIT INF TOT\",INT=300,VAL=0""dpc1:CAT=\"ISUP: XMIT INF TOT\",INT=1800,VAL=0""dpc1:CAT=\"ISUP: XMIT CQM TOT\",INT=300,VAL=0""dpc1:CAT=\"ISUP: XMIT CQM TOT\",INT=1800,VAL=0""dpc1:CAT=\"ISUP: RCV INF TOT\",INT=300,VAL=0""dpc1:CAT=\"ISUP: RCV INF TOT\",INT=1800,VAL=0""dpc1:CAT=\"SP: cInit in\",INT=900,VAL=0""dpc1:CAT=\"SP: cInit in\",INT=3600,VAL=0""dpc1:CAT=\"SP: cInit in\",INT=86400,VAL=5""dpc1:CAT=\"ISUP: RCV BLO TOT\",INT=300,VAL=0""dpc1:CAT=\"ISUP: RCV BLO TOT\",INT=1800,VAL=0""dpc1:CAT=\"ISUP: XMIT CPG TOT\",INT=300,VAL=0""dpc1:CAT=\"ISUP: XMIT CPG TOT\",INT=1800,VAL=0""dpc1:CAT=\"SP: PDU out\",INT=900,VAL=0""dpc1:CAT=\"SP: PDU out\",INT=3600,VAL=0""dpc1:CAT=\"SP: PDU out\",INT=86400,VAL=19""dpc1:CAT=\"ISUP: RCV CQR TOT\",INT=300,VAL=0""dpc1:CAT=\"ISUP: RCV CQR TOT\",INT=1800,VAL=0""dpc1:CAT=\"ISUP: XMIT CRA TOT\",INT=300,VAL=0""dpc1:CAT=\"ISUP: XMIT CRA TOT\",INT=1800,VAL=0""dpc1:CAT=\"ISUP: RCV CPG TOT\",INT=300,VAL=0""dpc1:CAT=\"ISUP: RCV CPG TOT\",INT=1800,VAL=0""dpc1:CAT=\"ISUP: XMIT INR TOT\",INT=300,VAL=0""dpc1:CAT=\"ISUP: XMIT INR TOT\",INT=1800,VAL=0""dpc1:CAT=\"ISUP: RCV CRA TOT\",INT=300,VAL=0""dpc1:CAT=\"ISUP: RCV CRA TOT\",INT=1800,VAL=0"Using the Cisco MGC Viewer Toolkit
This section describes the various components of the Cisco MGC viewer toolkit. The Cisco MGC viewer toolkit is used to view different types of files on the Cisco MGC. This section describes the various components and the toolkit concept as a whole.
The Cisco MGC viewer toolkit is a suite of viewing tools that were developed to run on the Cisco MGC to provide quick and efficient access to diagnostic and troubleshooting information.
The following viewers are discussed in the following subsections:
•
•
•
•
•
The Cisco MGC toolbar (Figure 3-1) is a graphical user interface (GUI) application used to launch the various viewers in the toolkit. Each application runs independently of the others, and there is a button for launching each application in the toolbar.
Figure 3-1 Cisco MGC Toolbar Window

You can run multiple instances of the Cisco MGC toolbar at one time, but only one instance of each tool can be running at a time, and different tools can be run simultaneously. If the selected application is already running, a message is displayed stating that your user ID and the application are already running. There is also a Close button on the toolbar, which is used to close the toolbar; however, closing the toolbar does not stop toolkit applications that are already running.
Caution
If you have problems reading text on any of the toolkit screens, please change the foreground color to a darker color on your display to see if that solves the problem.
Launching the Cisco MGC Toolbar
To launch the Cisco MGC toolbar, complete the following steps:
Step 1
cd /opt/CMM/binStep 2
./start.sh toolThe MGC Toolbar window is displayed.
Using the Alarm and Measurement Viewer
The alarm and measurement viewer helps you view and search records that reside in the alarm and measurement record logs. The formats of the various alarm and measurement records are specified in the Cisco Media Gateway Controller Software Release 7 Messages Reference Guide. These records are not designed for user reading, but for database loading. These viewers can help you understand these records, and they also provide useful searching functions based on the components and categories you select.
The alarm and measurement viewer offers a help file, which contains information about the viewer. To access the information, click the Help menu, select ReadMe, and the help text is displayed. You can also use this viewer to determine the current timestamp. To do this, click the Time menu, select TimeStamp. The current timestamp is displayed in a window.
You can exit the Alarm and Measurement Viewer in one of two ways: in the Query Criteria portion of the window, click Exit, or from the File menu, select Exit.
Viewing and Searching System Measurement Files
Complete the following steps to view and search various system measurement files:
Step 1
Step 2
Figure 3-2 Meas Record View Tab Window
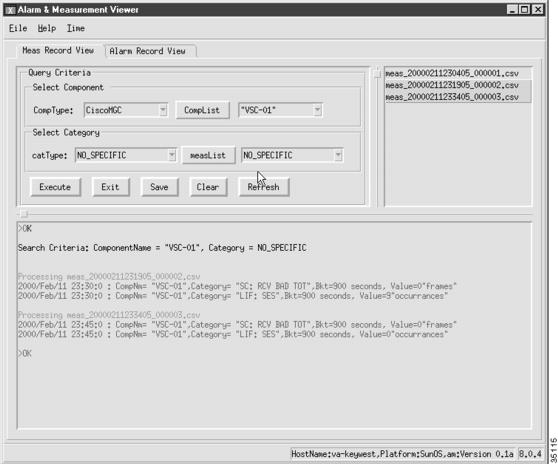
You can select multiple files in this field using any of the following techniques:
•
•
•
Step 3
Click CompList to acquire the configured components for the type you selected. The results are displayed in the drop-down list box next to the button. Select a component from that list box.
Step 4
Click measList to acquire the configured categories for the type you selected. The results are displayed in the drop-down list box next to the button. Select a category from that list box.
Step 5
Step 6
Step 7
$BASEDIR/etc/cust_specific/toolkit/measRec.log
If you perform another search and save the resulting content, the contents of the field are added into the measRec.log file, after the previously saved data. If you do not want the data to be added onto the previous data, you must change the name of the measRec.log file before you save again. To change the name of a file, refer to the procedures in the "Using the File Options Viewer" section.
If you do not find your desired data, you can update the list of system measurement files by clicking Refresh. Repeat the above steps to search through the newest files.
Viewing and Searching Alarm Record Files
Complete the following steps to view and search various system alarm files:
Step 1
Step 2
Step 3
You can select multiple files in this field using any of the following techniques:
•
•
•
Step 4
Click CompList to acquire the configured components for the type you selected. The results are displayed in the drop-down list box next to the button. Select a component from that list box.
Step 5
Figure 3-3 Alarm Record View Tab Window
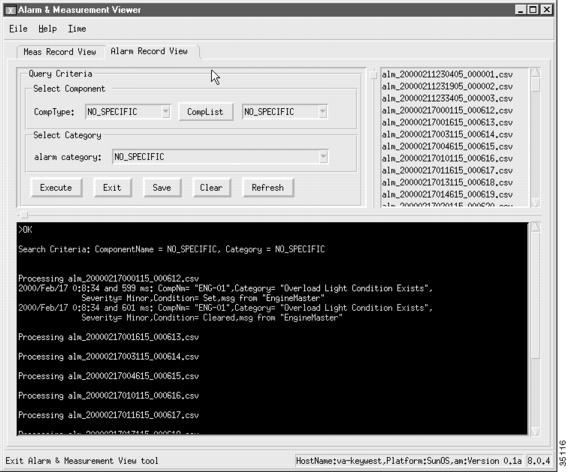
Step 6
The following list describes the text colors associated with the alarm types
•
•
•
•
•
•
Step 7
Step 8
$BASEDIR/etc/cust_specific/toolkit/alarmRec.log
If you perform another search and save that content again, the contents of the field are added into the alarmRec.log file, after the previously saved data. If you do not want the data to added onto the previous data, you must change the name of the alarmRec.log file before you save again. To change the name of a file, refer to the procedures in the "Using the File Options Viewer" section.
If you do not find your desired data, you can update the list of alarm files by clicking Refresh. Repeat the above steps to search through the newest files.
Using the Call Detail Record Viewer
CDRs contain basic call billing information, such as date and time, duration, and the calling number and called number. CDR records are written into files that contain information about telephone activity. CDR files are saved in a comma-delimited format (called a "Tag-Length-Value" or TLV file). The TLV file is a generic format that can be easily imported into most third-party mediation applications.
The CDR dumper (see Figure 1-1) provides logging capabilities on the Cisco MGC for all CDRs. Also, the CDR dumper supports external user application programming interfaces (APIs). The APIs allow users to get a real-time feed of CDRs and call detail blocks (CDBs) from the Cisco MGC that can be routed to a third-party mediation application for use in billing.
The CDR dumper operates according to the configuration set up in the XECfgParm file. When certain thresholds are met, the CDR dumper closes and saves the generated CDB records into the $BASEDIR/var/spool directory. It then passes the filename and fork to the TLV converter application.
The CDR viewer is designed to help you view and search call detail records that reside in the CDR logs. The formats of the CDBs and call data elements (CDEs) that comprise CDRs are specified in the Cisco Media Gateway Controller Software Release 7 Billing Interface Guide. These records are designed for database loading, not user reading. The CDR Viewer can help you understand these records, and it also provides useful searching functions based on the search criteria you select.
Note
You can exit the CDR viewer in one of two ways: in the Query Criteria portion of the window, click Exit, or from the File menu, select Exit.
Configuring the CDR Viewer
Whenever you start the CDR viewer, you must select several configuration settings before you can view or search the CDR files. To do this, complete the following steps.
Step 1
Step 2
The first five fields in the window cannot be modified. These fields list the directory paths and file names for the related data files.
Step 3
Figure 3-4 Config Tab Window
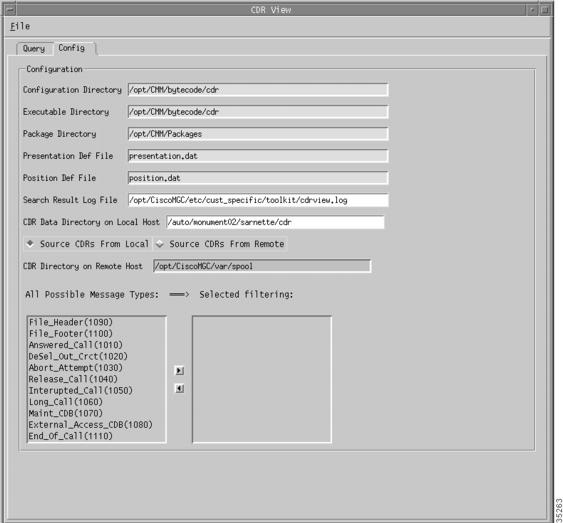
Note
Step 4
If you want to use a local host as your source for CDR information, click the Source CDRs From Local check box and proceed to Step 5.
If you want to use a remote host as your source for CDR information, click the Source CDRs From Remote check box and proceed to Step 6.
Note
Figure 3-5 ConnHost Tab WIndow
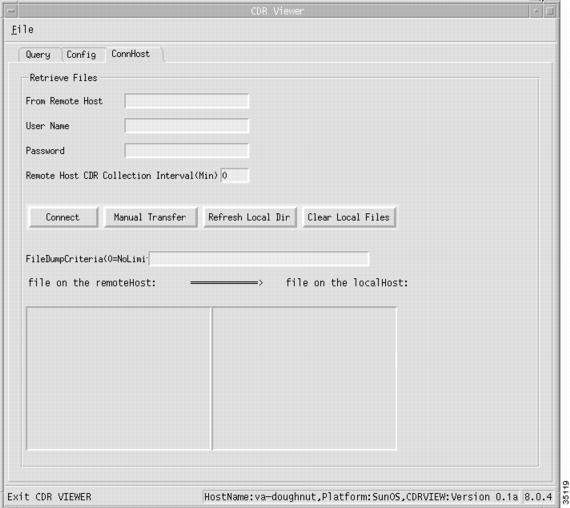
Step 5
Proceed to Step 11 to select the message type(s) for which you are searching.
Step 6
Step 7
Step 8
Step 9
Step 10
If you set the interval value above zero, after you click Connect, you are notified by a popup message box when new CDB files are deposited on the remote host. You can click OK in the message box to dynamically update the CDB files on the local host, or you can click NO to keep the local CDB file directory as it is.
If you set the interval value to zero, you are not notified of file changes on the remote host, and the CDB files on the local host are not dynamically updated.
The FileDumpCriteria(0=NoLimit) field displays the configuration information for CDRs on the Cisco MGC. This content of this field cannot be modified.
Step 11
You can select multiple files in this field using any of the following techniques:
•
•
•
You can remove message type(s) from your search criteria by selecting the desired message type(s) in the Selected filtering field and clicking the left arrow button.
Searching the CDR Files
You can search through the various alarm files by component and category. To do this, complete the following steps:
Step 1
If you have just opened the viewer, you must configure it before you can search the CDR files. Refer to "Configuring the CDR Viewer" section.
Step 2
If your CDR files are coming from a remote host, proceed to Step 3.
Step 3
Step 4
If the fields in the window are not properly data filled, perform the configuration steps for this window as described in the "Configuring the CDR Viewer" section. Once you have completed this, resume this procedure.
Step 5
Figure 3-6 Query Tab Window
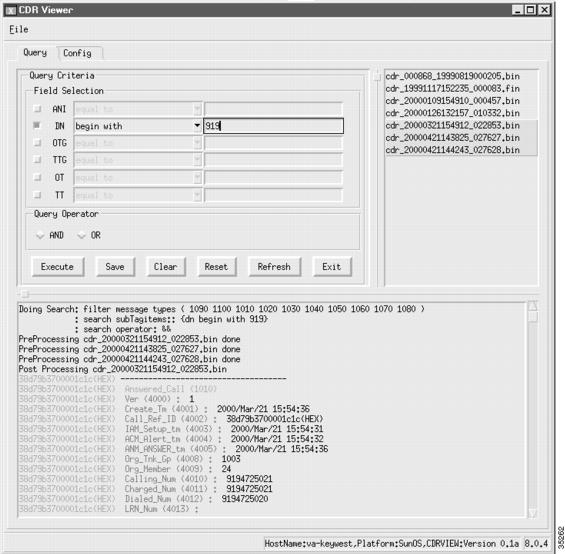
You can select multiple files in this field using any of the following techniques:
•
•
•
Step 6
If you want to remove the files from your local host, you can click Clear Local Files. If you want to update the listed files in the file on the localHost field, you can click Refresh Local Dir.
Step 7
Step 8
You can select multiple files in this field using any of the following techniques:
•
•
•
Step 9
If you want to search through your selected CDR file(s) for particular type(s) of CDRs, proceed to Step 10.
Step 10
•
•
•
•
•
•
To select a field value, click the check box next to the name. You can select as few or as many field values as you require.
Step 11
•
•
•
•
Enter a search string in the field to the right of the search qualifier you just choose.
Repeat this step for all field values that you have selected for your search.
Step 12
Step 13
Step 14
Step 15
If you perform another search and save that content again, the contents of the field are added to the same file, after the previously saved data. If you do not want the data to added to the previous data, you must change the name of the file before you save again. To change the name of a file, refer to the procedures in the "Using the File Options Viewer" section.
Step 16
Using the Config-Lib Viewer
You can use the Config-Lib viewer (Figure 3-7) to manage the contents of the configuration library. The configuration library stores the various system configurations that you created while you provisioned your Cisco MGC.
Figure 3-7 Config-Lib Viewer Window
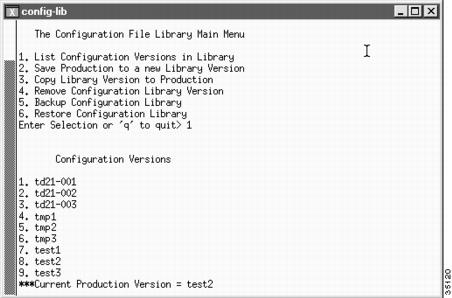
Click CONFIG-LIB on the Cisco MGC toolbar to open an xterm window and execute the config-lib script. To quit the Config-Lib Viewer, enter q at the prompt.
The Config-Lib Viewer enables you to do the following functions:
•
•
•
Note
•
Caution
•
•
Using the Log Viewer
The Log Viewer offers selection and reporting capabilities that allow you to retrieve and display log messages from the system log files.
You can exit the Log Viewer in one of two ways: click Exit, or select Exit from the File menu.
Searching Log Record Files
Complete the following steps to search through various system log files:
Step 1
Figure 3-8 Log Viewer Window

Step 2
Note
If the desired file is still not displayed, you might need to change the directory path used by the viewer. To do this, click the File menu and select Log Directory. Enter the appropriate directory path in the Log Directory field and click Modify to save the new settings. The log files contained in the directory path you specified are displayed in the Log Files field.
Step 3
The current date and time are the default values for both the start and stop values for the time period; however, using these values results in a null search (no records).
The Use Current Time as Stop Time check box, if selected, disables the Stop Date/Time drop-down list boxes and allows searching to continue to the end of the file.
Step 4
The available categories are:
•
•
•
•
•
•
•
Click the right arrow to enter your selected categories into the search. The selected categories appear in the list box to the right of the arrow buttons. To deselect a category, click one or more entries in the right list box and click the left arrow.
Step 5
The severity choices are cumulative—each level selected also displays all levels below it. For example, the ERR selection displays both ERR (error) and CRIT (critical) messages. The severity levels are
•
•
•
•
•
Click the right arrow to enter your selected categories into the search. The selected categories appear in the list box to the right of the arrow buttons. To deselect a category, click one or more entries in the right list box and click the left arrow.
Step 6
Step 7
platform.log ... : currently active logFri Apr 14 17:57:19:253 2000 | ProcessManager (PID 24929) <Debug>initialized process info for 'POM-01'Fri Apr 14 17:57:25:908 2000 | ProcessManager (PID 24929) <Debug>Received heartbeat response from process CFM-01Step 8
While the application is searching through the log files, a dialog box appears. This dialog box displays the progression of the search. It also allows you to stop searching by pressing Stop.
Your results may be lengthy, resulting in several pages of information. You can use several buttons to navigate through your results. To go to the end of your results, click Bottom. To go to the next 5-MB page of results, click More. To go to the beginning of your results, click Top.
Step 9
Step 10
Using the Trace Viewer
You can use the trace viewer as part of performing a call trace. Clicking Trace Viewer in the Cisco MGC toolbar opens the Traces Files window, which lists the call trace files from which you can choose (Figure 3-9). When you select a file, you can click View, which opens the Trace Viewer window (Figure 3-10), which allows you to perform a variety of call trace activities. For more information about call traces, refer to the "Tracing" section.
Figure 3-9 Trace Viewer Window
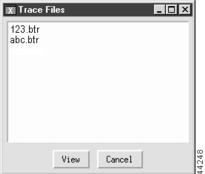
Figure 3-10 Trace Viewer Window
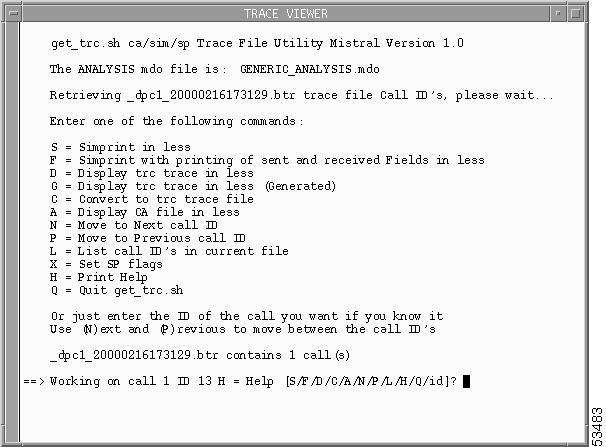
Using the Translation Verification Viewer
The translation verification viewer offers a means of interfacing with the translation verification tool. The translation verification tool provides you with a means to understand how calls are being processed based on your system's dial plan. This tool creates a simulation of a call being processed by your system's dial plan.
Note
You can exit the translation verification viewer by clicking on the File menu and selecting Exit.
Verifying a Dial Plan Translation
Complete the following steps to verify a dial plan translation:
Step 1
Step 2
Step 3
•
•
•
Figure 3-11 Dial Plan Translation Tab Window
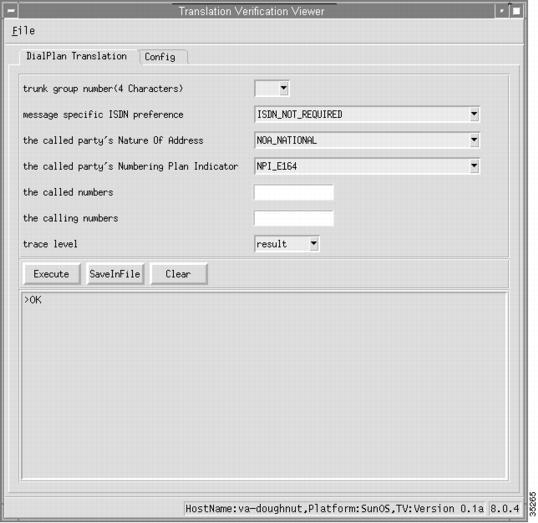
Step 4
•
•
•
•
•
•
•
•
•
•
•
•
•
•
•
•
•
•
•
•
•
•
•
•
•
•
•
•
•
•
•
•
•
•
•
•
•
•
•
•
•
•
•
•
•
•
•
Step 5
•
•
•
•
•
•
•
•
•
•
Step 6
Step 7
Step 8
•
Here is an example result trace:
>simWriter -tgnum 7001 -isdnp 1 -cdnoa 4 -cdnpi 1 -cdpn 7075511234 -cgpn 7034843368>Result of ExecutionOriginating side: A-number 7034843368B-number 7075511234Trunk group 7001Outgoing side: A-number 7034843368B-number 7075511234No suitable trunk group found!*Internal errors/warnings were encountered during translation!>OK•
Here is an example diagnostic trace:
>simWriter -tgnum 7001 -isdnp 1 -cdnoa 4 -cdnpi 1 -cdpn 7075511234 -cgpn 7034843368 -diag>Result of Execution********************************************************* START call translation verification diagnostic summary ***********************************************************performing Dial Plan Base.performing Profile Analysis (NOA).*Internal errors/warnings were encountered during translation!********************************************************* END call translation verification diagnostic summary ***********************************************************Analysing .dat files:used default Route Prefernceused default Terminating Max Digitsused default Terminating Min Digitsused default Originating Min Digitsused default Originating Max Digitsthe Originating Start Index property for tg-7001 was not found in /opt/CiscoMGC/etc/properties.datCustomer Group ID's do not match up in the sigPath and Properties filesused default Carrier Screening propertyused default AOCEnabled fieldused the default field for default directory numberused the default Database Access Error flagAnalysis complete, writing message...Message completed, running simulator...>OK•
Here is an example full trace:
>simWriter -tgnum 7001 -isdnp 1 -cdnoa 4 -cdnpi 1 -cdpn 7075511234 -cgpn 7034843368 -full>Result of Execution********************************************* START full call translation verification *********************************************Decoding generic analysis trace...the length of the trace is 82 bytes( 1)entering Dial Plan Base.( 2) tracing Dial plan, entering Dial Plan Base table with...( 1) 0 parameter(s):( 2) reading Dial Plan Base table...( 1) 1 error/warning code read:*Internal Error:Table could not be read( 1)ending Dial Plan Base...( 1)entering Call Information Reception.(13) A Number:'7034843368'(13) B Number:'7075511234'( 1)ending Call Information Reception...( 1)entering Profile Analysis (NOA).(13) Tracing call number:'7075511234' (Called party number)( 7) Trace for customer:'jst1'( 5) TreeBase:'10'( 2) tracing Dial plan, entering NOA table with...( 1) 1 parameter(s):( 4) NOA table index = 4.( 2) reading NOA table...( 1) 1 error/warning code read:*Internal Error:Table could not be read( 1)ending Profile Analysis (NOA)...( 1)end of trace reached********************************************* DONE full call translation verification ** with 0 bytes left untranslated *********************************************Analysing .dat files:used default Route Prefernceused default Terminating Max Digitsused default Terminating Min Digitsused default Originating Min Digitsused default Originating Max Digitsthe Originating Start Index property for tg-7001 was not found in /opt/CiscoMGC/etc/properties.datCustomer Group ID's do not match up in the sigPath and Properties filesused default Carrier Screening propertyused default AOCEnabled fieldused the default field for default directory numberused the default Database Access Error flagAnalysis complete, writing message...Message completed, running simulator...>OKThe content of the field identifies for you which elements of your dial plan need to be modified, if necessary.
Step 9
Step 10
Step 11
Viewing Dial Plan Translation Configuration Data
Complete the following steps to view the dial plan translation configuration data:
Step 1
Step 2
Figure 3-12 Config Tab Window
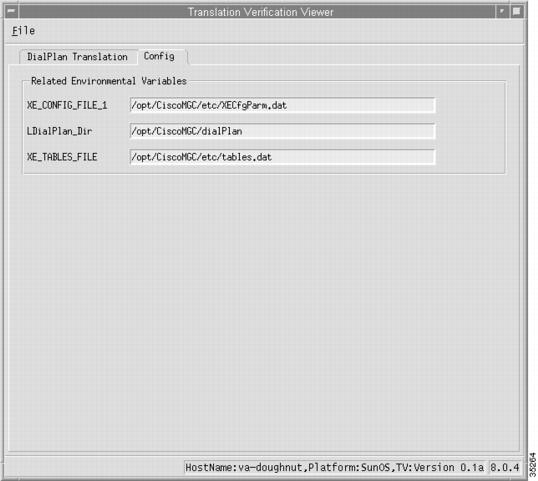
Using the File Options Viewer
The file options viewer (Figure 3-13) enables you to manage (rename, delete) the files within the $BASEDIR/etc/cust_specific/toolkit directory. This directory contains all files created by the various toolkit applications. It also enables you to manage subdirectories created under the cust_specific directory. These subdirectories are created through the MML export feature and contain configuration information in the form of MML commands.
Figure 3-13 File Options Viewer Window
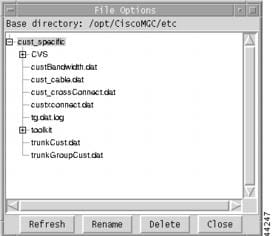
Using the MGC Backup Viewer
The MGC backup viewer enables you to backup the software configuration of your Cisco MGC host. For more information on using the MGC backup utility, refer to the "Backup Procedures for Cisco MGC Software from Release 7.4(11) and up" section.
Figure 3-14 illustrates the main window for the MGC backup viewer.
Figure 3-14 MCG Backup Viewer Window
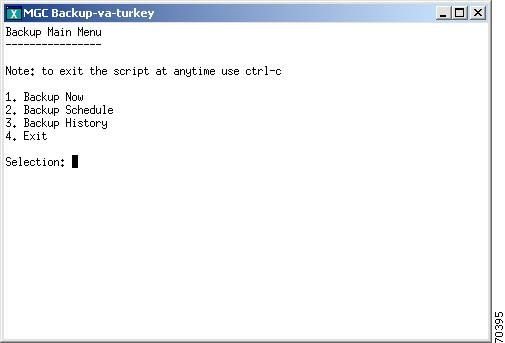
Using the MGC Restore Viewer
The MGC restore viewer enables you to restore a previously stored configuration to your Cisco MGC host. For more information on using the MGC restore utility, refer to the "Restoring Procedures for Cisco MGC Software Release 7.4(11) and up" section.
Figure 3-15 illustrates the main window for the MGC backup viewer.
Figure 3-15 MCG Restore Viewer Window

 Feedback